. 2022 Sep 1;163(9):bqac104.
doi: 10.1210/endocr/bqac104.

N/C Interactions Are Dispensable for Normal In Vivo Functioning of the Androgen Receptor in Male Mice

Affiliations

N/C Interactions Are Dispensable for Normal In Vivo Functioning of the Androgen Receptor in Male Mice

Sarah El Kharraz et al. Endocrinology. .

Abstract

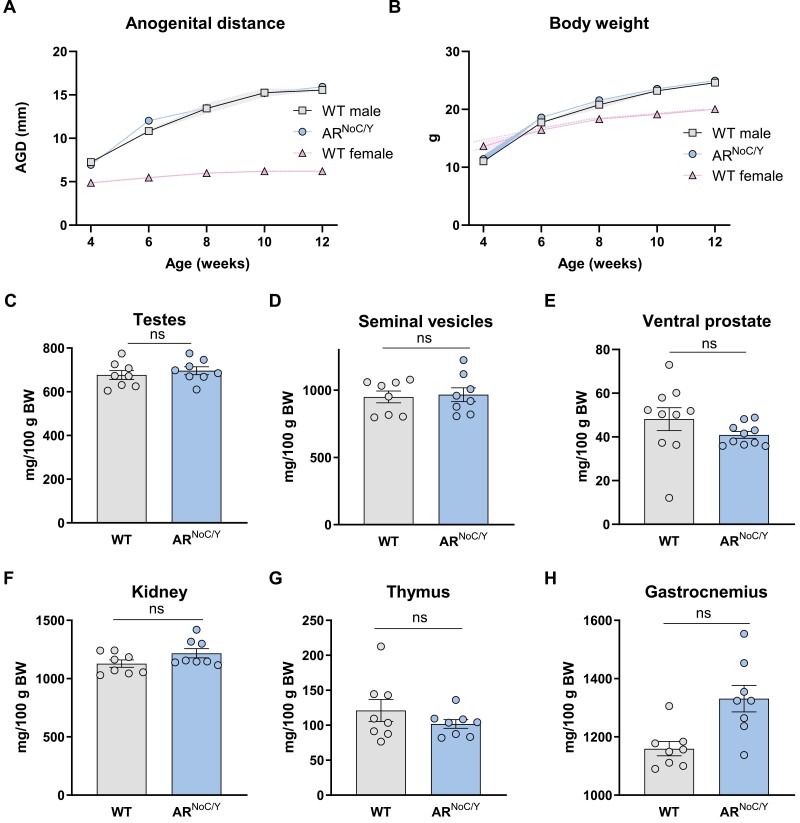
The androgen receptor (AR) plays a central role in the development and maintenance of the male phenotype. The binding of androgens to the receptor induces interactions between the carboxyterminal ligand-binding domain and the highly conserved 23FQNLF27 motif in the aminoterminal domain. The role of these so-called N/C interactions in AR functioning is debated. In vitro assays show that mutating the AR in the 23FQNLF27 motif (called ARNoC) attenuates the AR transactivation of reporter genes, has no effect on ligand binding, but does affect protein-protein interactions with several AR coregulators. To test the in vivo relevance of the N/C interaction, we analyzed the consequences of the genomic introduction of the ARNoC mutation in mice. Surprisingly, the ARNoC/Y mice show a normal male development, with unaffected male anogenital distance and normal accessory sex glands, male circulating androgen levels, body composition, and fertility. The responsiveness of androgen target genes in kidney, prostate, and testes was also unaffected. We thus conclude that the N/C interactions in the AR are not essential for the development of a male phenotype under normal physiological conditions.

Keywords: N/C interaction; androgen receptor; male development; mouse model; prostate.


Conflict of interest statement

The authors declare no competing interests.

The authors have nothing to disclose.

Figures

Figure 1.
Figure 1.
Evolutionary conservation of the 23FQNLF27 motif and its interaction with the AR LBD. The motifs at the aminoterminal end of the AR corresponding with the 23FQNLF27 motif in human AR are shown in orange. Below, the AR LBD structure is shown in green with the positions of the LXXLL-containing peptide (TIF2 740-753) (left; shown in blue; PBD 2AO6) and the FQNLF of the AR NTD (AR 20-30) (right; shown orange; PDB: 1XOW). The ligand (DHT) is shown in yellow.
Figure 2.
Figure 2.
In vitro functional analysis of the ARNoC. (A) Transactivation assay in HEK293 T-Rex cells with an integrated 4xSLP-HRE2 E1B TATA Luc reporter and transiently transfected with either human WT or 23AQNAA27 AR followed by stimulation with increasing DHT concentrations. The curves show means and shaded parts represent SEM (n = 4, two-way ANOVA with Sidak’s multiple comparisons test, * < P 0.05, ** < P 0.01, *** < P 0.001, ns = not significant). (B) Transactivation assay in HEK293 T-Rex cells with an integrated 4xC3(1)-ARE E1B TATA Luc reporter performed as in panel B. (C) Specific ligand-binding assay in stably AR-expressing U2OS cells. Values are normalized to protein expression. Individual data points are shown with nonlinear regression curve fit (n = 2). A representative Western blot on cell extracts is shown on the right. Lanes that are not relevant for this study are marked with an asterisk. (D) Heatmap showing the MS spectral counts of high confidence interactors (FDR < 0.05 after SAINT analysis) identified with hAR-WT-BirA* and hAR-23AQNAA27-BirA* upon DHT or vehicle exposure. Values of 3 biological replicates from DHT-and vehicle-exposed samples are shown. On the bottom, FDRs are shown for the DHT-treated samples. Spectral counts of each protein have been normalized to those of AR in each sample.
Figure 3.
Figure 3.
Phenotypic analysis of the ARNoC/Y mice. (A) Evolution of the anogenital distance over time. Average is shown and shaded areas represent SEM (n = 10). (B) Body weight followed over time. Average is shown and shaded areas represent SEM (n = 10). (C-H) Weight of testes (C), seminal vesicles (D), ventral prostate (E), kidney (F), thymus (G), and gastrocnemius (H) normalized to body weight of 13-week-old WT males and ARNoC/Y mice. The bar graphs show means ± SEM (n = 8, unpaired two-tailed Student’s t test, ns = not significant).
Figure 4.
Figure 4.
Serum hormone levels and testicular analysis in ARNoC/Y mice. (A) RT-qPCR analyses of Star (A), Cyp17a1 (B), Hsd17b3 (C) in testes from 13-week-old WT males and ARNoC/Y mice. Expression levels are normalized to WT levels. The bar graphs show means ± SEM (biological replicates, n = 8, unpaired two-tailed Student’s t test, ns = not significant). (D) Representative image of H&E staining on testis of an ARNoC/Y mouse. Yellow and white arrows indicate Sertoli and Leydig cells, respectively. Scale bar = 50 µm. (E-F) RT-qPCR analysis of Insl3 (E) and Rhox5 (F) in testes from 13-week-old WT males and ARNoC/Y mice. Expression levels are normalized to WT levels. The bar graphs show means ± SEM (n = 8, unpaired two-tailed Student’s t test, ns = not significant).
Figure 5.
Figure 5.
The effect of orchidectomy and T replacement in ARNoC/Y mice. (A) The experimental setup to study differences in androgen response between WT and ARNoC/Y mice during an ORX intervention. (B-D) Weight of seminal vesicles (B), BCLA (C), and ventral prostate (D) normalized to body weight in 13-week-old mice that underwent ORX with vehicle or T replacement. The bar graphs show means ± SEM (n ≥ 9, two-way ANOVA with Tukey’s multiple comparisons test, **P < 0.01, ***P < 0.001, ns = not significant). (E) Representative pictures of the urogenital tract (upper panels) and individual prostate lobes of the prostate (lower panels; abbreviations: VP, ventral prostate; AP, anterior prostate; DP, dorsolateral prostate) of WT ORX + T, ARNoC/Y ORX + T, and ARNoC/Y ORX. Scale bar = 1 cm.
Figure 6.
Figure 6.
Evaluation of kidneys after ORX +/- T replacement in ARNoC/Y mice. (A) Kidney weight normalized to body weight in 13-week-old mice that underwent ORX with vehicle or T replacement. The bar graphs show means ± SEM (n ≥ 9, two-way ANOVA with Tukey’s multiple comparisons test, ns = not significant). (B-E) RT-qPCR analysis of Fkbp5 (B), Kap (C), Odc1 (C), and Ar (E) in kidney from 13-week-old WT males and ARNoC/Y mice that underwent ORX with vehicle or T replacement. Expression levels are normalized to WT ORX levels. The bar graphs show means ± SEM (n ≥ 9, two-way ANOVA with Tukey’s multiple comparisons test, **P < 0.01, ***P < 0.001, ns = not significant).
Figure 7.
Figure 7.
Analysis of AR-regulated gene expression in prostates after ORX +/- T replacement in ARNoC/Y mice. (A-E) RT-qPCR analysis of Fkbp5 (A), Nkx3-1 (B), Odc1 (C), Pbsn (D), and Ar (E) in ventral prostates from 13-week-old WT males and ARNoC/Y mice that underwent ORX with vehicle or T replacement. Expression levels are normalized to WT ORX levels. The bar graphs show means ± SEM (n ≥ 9, two-way ANOVA with Tukey’s multiple comparisons test, **P < 0.01, ***P < 0.001, ns = not significant).
Figure 8.
Figure 8.
Transcriptome analysis in prostates after ORX +/- T replacement in WT and ARNoC/Y mice. (A) Principal component analysis on the ventral prostate transcriptome of 13-week-old WT males and ARNoC/Y mice that underwent ORX with vehicle or T replacement. (B) Heatmap for the genes that are differentially expressed in the ventral prostate between WT ORX and WT ORX + T (q-value ≤ 0.01; FC ≥ 1.5) and corresponding expression levels in ARNoC/Y ORX and ARNoC/Y ORX + T. (C) Enrichment plots from gene set enrichment analysis using gene sets of up- and downregulated genes in prostates of WT mice after ORX and T supplementation for 3 days (extracted from (34)). The corresponding NES (normalized enrichment score) and q-value are given. Upper panels: ranked expression levels for WT ORX + T compared to WT ORX, lower panels: ranked expression levels for ARNoC/Y ORX + T compared to ARNoC/Y ORX.

References

    1. Helsen C, Claessens F. Looking at nuclear receptors from a new angle. Mol Cell Endocrinol. 2014;382(1):97-106. doi:10.1016/j.mce.2013.09.009 - DOI - PubMed
    1. Shaffer PL, Jivan A, Dollins DE, Claessens F, Gewirth DT. Structural basis of androgen receptor binding to selective androgen response elements. Proc Natl Acad Sci USA. 2004;101(14):4758-4763. doi:10.1073/pnas.0401123101 - DOI - PMC - PubMed
    1. Matias PM, Donner P, Coelho R, et al. Structural evidence for Ligand specificity in the binding domain of the human androgen receptor. J Biol Chem. 2000;275(34):26164-26171. doi:10.1074/jbc.m004571200 - DOI - PubMed
    1. Heery DM, Hoare S, Hussain S, Parker MG, Sheppard H. Core LXXLL motif sequences in CREB-binding protein, SRC1, and RIP140 define affinity and selectivity for steroid and retinoid receptors. J Biol Chem. 2001;276(9):6695-6702. doi:10.1074/jbc.M009404200 - DOI - PubMed
    1. Alen P, Claessens F, Verhoeven G, Rombauts W, Peeters B. The androgen receptor amino-terminal domain plays a key role in p160 coactivator-stimulated gene transcription. Mol Cell Biol. 1999;19(9):6085-6097. doi:10.1128/MCB.19.9.6085 - DOI - PMC - PubMed

Publication types