. 2022 Aug;12(8):e997.
doi: 10.1002/ctm2.997.

Glioblastoma-educated mesenchymal stem-like cells promote glioblastoma infiltration via extracellular matrix remodelling in the tumour microenvironment

Affiliations

Glioblastoma-educated mesenchymal stem-like cells promote glioblastoma infiltration via extracellular matrix remodelling in the tumour microenvironment

Seung-Mo Kim et al. Clin Transl Med. 2022 Aug.

Abstract

Background: The biological function of mesenchymal stem-like cells (MSLCs), a type of stromal cells, in the regulation of the tumour microenvironment is unclear. Here, we investigated the molecular mechanisms underlying extracellular matrix (ECM) remodelling and crosstalk between MSLCs and glioblastomas (GBMs) in tumour progression.

Methods: In vitro and in vivo co-culture systems were used to analyze ECM remodelling and GBM infiltration. In addition, clinical databases, samples from patients with GBM and a xenografted mouse model of GBM were used.

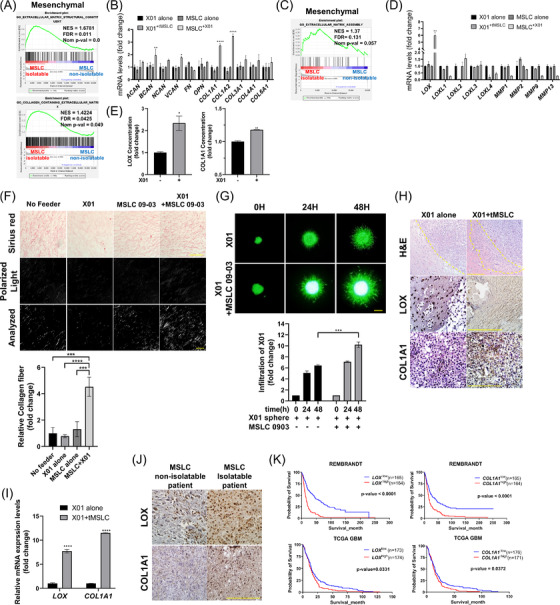
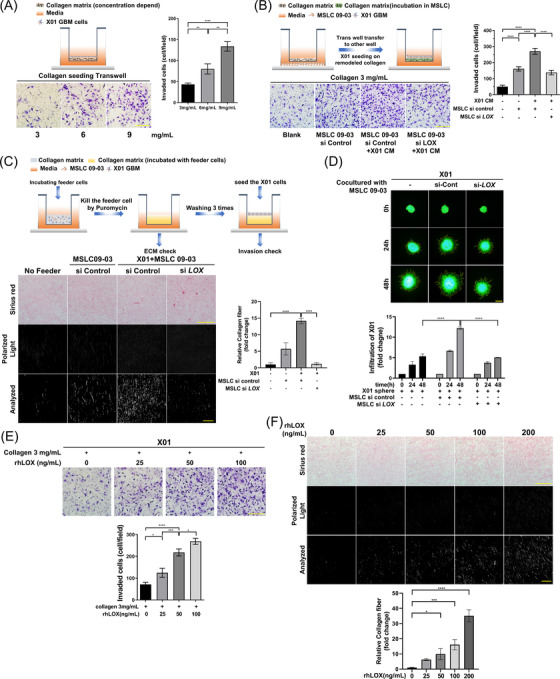
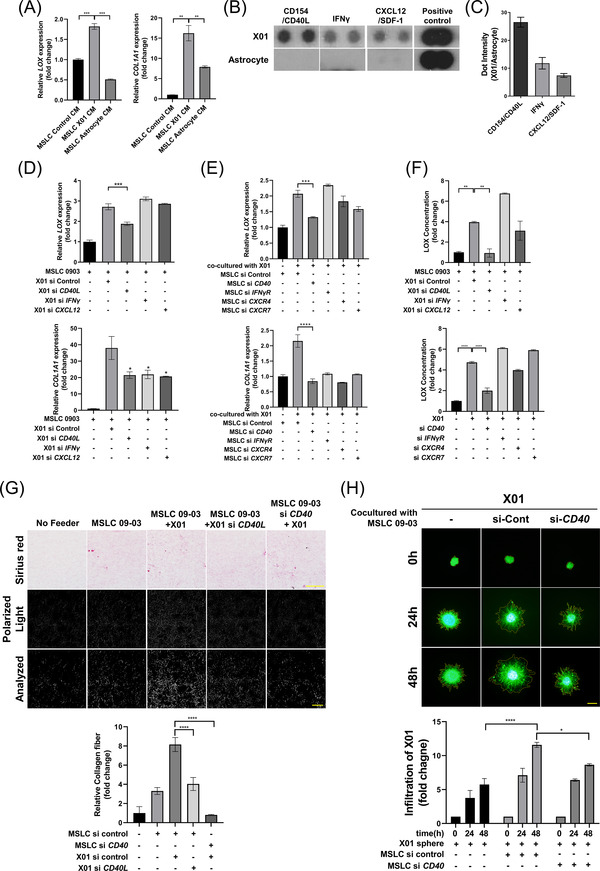
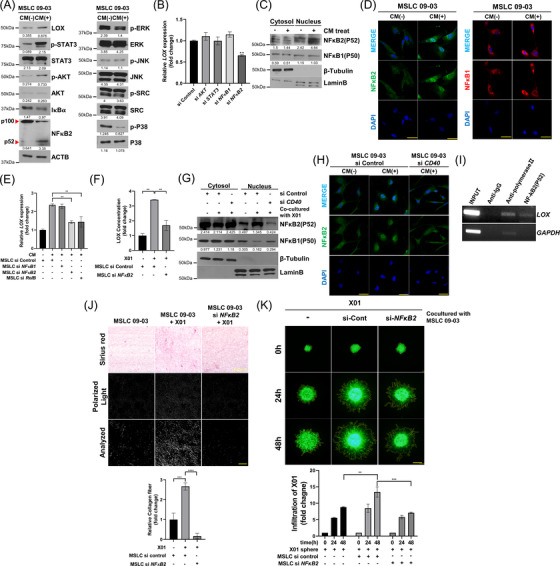
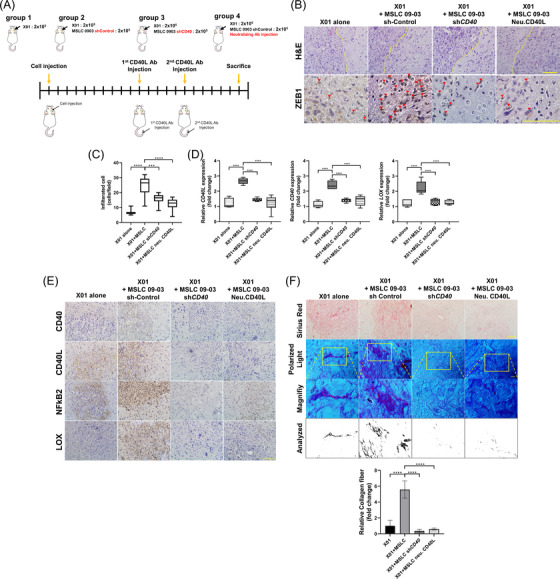
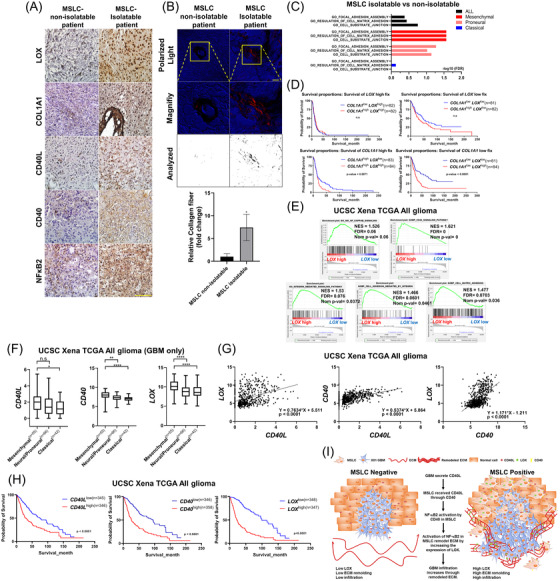
Results: Previous studies have shown that the survival of patients with GBM from whom MSLCs could be isolated is substantially shorter than that of patients from whom MSLCs could not be isolated. Therefore, we determined the correlation between changes in ECM-related gene expression in MSLC-isolatable patients with that in MSLC non-isolatable patients using gene set enrichment analysis (GSEA). We found that lysyl oxidase (LOX) and COL1A1 expressions increased in MSLCs via GBM-derived clusters of differentiation 40 ligand (CD40L). Mechanistically, MSLCs are reprogrammed by the CD40L/CD40/NFκB2 signalling axis to build a tumour infiltrative microenvironment involving collagen crosslinking. Importantly, blocking of CD40L by a neutralizing antibody-suppressed LOX expression and ECM remodelling, decreasing GBM infiltration in mouse xenograft models. Clinically, high expression of CD40L, clusters of differentiation 40 (CD40) and LOX correlated with poor survival in patients with glioma. This indicated that GBM-educated MSLCs promote GBM infiltration via ECM remodelling in the tumour microenvironment.

Conclusion: Our findings provide mechanistic insights into the pro-infiltrative tumour microenvironment produced by GBM-educated MSLCs and highlight a potential therapeutic target that can be used for suppressing GBM infiltration.

Keywords: cluster of differentiation 40 ligand; extracellular matrix remodelling; glioblastoma; lysyl oxidase; mesenchymal stem-like cells.


Conflict of interest statement

The authors declare that there is no potential conflict of interest.

Figures

FIGURE 1
FIGURE 1
Glioblastoma (GBM) upregulated LOX and COL1A1 in mesenchymal stem‐like cells (MSLCs), which promoted GBM cell infiltration. (A) Gene set enrichment analysis (GSEA) for extracellular matrix (ECM)‐related signature in MSLC‐isolatable and MSLC‐non‐isolatable patients. (B) Quantitative reverse transcription‐polymerase chain reaction (qRT‐PCR) of ECM molecules in MSLCs and X01 cells co‐cultured with each other. Normalization was performed from each X01 to X01+MSLC and MSLC to MSLC+X01. +X01 or +MSLC, designated by superscripts, indicates the cells that have been co‐cultured with MSLC and X01, respectively. (C) GSEA for ECM remodelling‐related signature for MSLC‐isolatable and MSLC‐non‐isolatable patients. (D) qRT‐PCR of ECM remodelling enzymes in MSLCs and X01 cells co‐cultured with each other. Normalization was performed from each X01 to X01+MSLC and MSLC to MSLC+X01. +X01 or +MSLC, designated by superscripts, indicates the cells that have been co‐cultured with MSLC and X01, respectively. (E) Enzyme‐linked immunosorbent assay of LOX and COL1A1 levels in MSLCs co‐cultured with X01 (n = 3). (F) Representative image of 3D collagen‐based matrix incubated with X01 and/or MSLCs, stained with Picrosirius red. Image: bright field on top, collagen fibre in the middle (polarized light) and analysis of polarized area at the bottom. Collagen fibre area = polarized area/total area (n = 4). Bright field scale bar: 100 μm; polarized light scale bar: 10 μm. (G) X01 spheroid infiltration within 3D collagen‐based matrix co‐cultured with MSLCs. Bottom graph shows calculation results of the infiltration area. Scale bar: 200 μm. (H) H&E staining and immunohistochemistry (IHC) of LOX and COL1A1 in mouse brain coronal section (n = 6 mice/group). Scale bar: 200 μm. (I) LOX and COL1A1 expression levels in mouse brains injected with X01 alone and X01+MSLC (n = 6 mice/group). (J) IHC for LOX and COL1A1 in MSLC‐non‐isolatable and MSLC‐isolatable GBM patient specimen. Scale bar: 100 μm. (K) Kaplan–Meier survival curve of all patients with glioma (REMBRANDT) and GBM (The Cancer Genome Atlas; TCGA) with high or low LOX and COL1A1 median expression. *p < .05, **p < .01, ***p < .001, ****p < .0001
FIGURE 2
FIGURE 2
LOX promoted glioblastoma (GBM) infiltration by remodelling the extracellular matrix (ECM). (A) Schematic model (top) and collagen concentration‐dependent X01 GBM cell invasion assay. Scale bar: 200 μm. (B) Schematic model (top) and invasion of GBM cells after incubation in a transwell coated with 3 mg/ml collagen. Scale bar: 200 μm. (C) Schematic model (top) and representative image of 3D collagen‐based matrix pre‐incubated with X01 cells and/or MSLCs transfected with siRNA‐control or si‐LOX, stained with Picrosirius red. Image: bright field at the top, collagen fibre in the middle (polarized light), and analysis of polarized area at the bottom. Collagen fibre area = polarized area/total area (n = 4). Bright field scale bar: 100 μm; polarized light scale bar: 10 μm. (D) X01 spheroid infiltration in 3D collagen‐based matrix co‐cultured with MSLCs transfected with siRNA‐control or si‐LOX. Bottom graph shows calculation results of the infiltration area. Scale bar: 200 μm. (E) Invasion of GBM cells after pre‐incubation in DMEM treated with rhLOX in a concentration‐dependent manner in transwell coated with 3 mg/ml collagen. Scale bar: 200 μm. (F) Representative image of 3D collagen‐based matrix pre‐incubated with rhLOX in a concentration‐dependent manner, stained with Picrosirius red. Image: bright field (top), collagen fibre (mid, polarized light), and analysis of polarized area (bottom). Collagen fibre area = polarized area/total area (n = 4). Bright field scale bar: 100 μm; polarized light scale bar: 10 μm. *p < .05, **p < .01, ***p < .001, ****p < .0001
FIGURE 3
FIGURE 3
Glioblastoma (GBM) secretes CD40L to upregulate LOX expression via CD40 in MSLCs. (A) Quantitative reverse transcription‐polymerase chain reaction (qRT‐PCR) analysis in MSLC treatment control conditioned media (CM), X01 CM or astrocyte CM. (B) Cytokine array of X01 CM or astrocyte CM as indicated (n = 2). (C) Densitometry analysis of cytokine array shown in (B). (D) qRT‐PCR for LOX and COL1A1 in MSLCs co‐cultured with X01 cells depleted of cytokine genes using siRNA. (E) qRT‐PCR for LOX and COL1A1 in MSLCs depleted of cytokine receptor gene using siRNA co‐cultured with X01. (F) Enzyme‐linked immunosorbent assay of LOX level in CM from (D) and (E). (G) Representative image of 3D collagen‐based matrix pre‐incubated with X01 cells transfected with siRNA‐control or si‐CD40L and/or MSLCs transfected with siRNA‐control or si‐CD40 stained with Picrosirius red. Image: bright field (top), collagen fibre (mid, polarized light), and analysis of polarized area (bottom). Collagen fibre area = polarized area/total area (n = 4). Bright field scale bar: 100 μm; polarized light scale bar: 10 μm. (H) X01 spheroid infiltration in 3D collagen‐based matrix co‐cultured with MSLCs transfected with siRNA‐control or si‐CD40. Bottom graph shows calculation results of the infiltration area. Scale bar: 200 μm. *p < .05, **p < .01, ***p < .001, ****p < .0001
FIGURE 4
FIGURE 4
CD40L increased LOX expression via CD40‐mediated NF‐κB2 nucleus translocation. (A) Western blot analysis to determine CD40 downstream effector activation status in MSLCs treated with control conditioned medium (CM) or X01 CM. (B) Quantitative reverse transcription‐polymerase chain reaction (qRT‐PCR) of LOX expression in MSLCs transfected with siRNA as indicated. (C) Western blot analysis of the nucleus translocation of NF‐κB1 or NF‐κB2 by X01 CM in the cytosol‐nuclear fraction of MSLCs. (D) Immunocytochemistry in MSLCs and nucleus translocation of NF‐κB1 or NF‐κB2 by X01 CM. Scale bar: 50 μm. (E) qRT‐PCR of LOX expression in MSLCs treated with X01 CM and transfected with siRNA as indicated. (F) Enzyme‐linked immunosorbent assay of LOX in CM after co‐culture with each transfected cell type. (G) Western blots of fractionated lysates of MSLCs transfected with siRNA‐control or si‐CD40 after co‐culture with X01. (H) Nuclear translocation of NF‐κB2 in MSLC siRNA‐control or MSLC si‐CD40 treated or not treated with X01 CM. Scale bar: 50 μm. (I) Chromatin immunoprecipitation for assessing NF‐κB2 binding to LOX promoter in MSLCs. (J) Representative image of 3D collagen‐based matrix pre‐incubated with MSLCs transfected with siRNA‐control or si‐NF‐κB2 and/or X01 cells stained with Picrosirius red. Image: bright field (top), collagen fibre (mid, polarized light), and analysis of polarized area (bottom). Bottom graph shows collagen fibre area = polarized area/total area (n = 4). Bright field scale bar: 100 μm; polarized light scale bar: 10 μm. (K) X01 spheroid infiltration in 3D collagen‐based matrix co‐cultured with MSLCs transfected with siRNA‐control or si‐NF‐κB2. Bottom graph shows calculation results of the infiltration area. Scale bar: 200 μm. **p < .01, ***p < .001, ****p < .0001
FIGURE 5
FIGURE 5
CD40L neutralizing antibody and knockdown of CD40 suppressed ECM remodelling and GBM infiltration. (A) Schematic illustration of GBM model generation and the overall therapeutic procedure for orthotopic xenograft animal model. (B) H&E and ZEB1 staining of coronally sectioned mouse brain. Yellow dash represents tumour margin. Red triangles represent ZEB1‐positive infiltration cells (n = 6 mouse/group). Scale bar: 100 μm. (C) The number of ZEB1‐positive cells infiltrated outside the tumour margin in (B). (D) Quantitative reverse transcription‐polymerase chain reaction (qRT‐PCR) of CD40L, CD40 and LOX expression in mouse brain tissue (n = 3 mouse/group). (E) IHC of CD40, CD40L, NFκB2 and LOX in the indicated groups (n = 6 mouse/group). Scale bar: 100 μm. (F) Representative image of Picrosirius red‐stained mouse brain tissue for each xenograft group. Collagen fibre area = polarized area/total area (n = 6 mouse/group). Collagen fibre area (right) = polarized area/total area (n = 6 mouse/group). Bright field scale bar: 100 μm; polarized light scale bar: 10 μm. ***p < .001, ****p < .0001
FIGURE 6
FIGURE 6
Correlation between tumour MSLC‐isolatable patients and clinical outcome. (A) IHC of LOX, COL1A1, CD40L, CD40 and NF‐κB2 in MSLC‐isolatable (n = 4) and MSLC‐non‐isolatable (n = 4) patient samples. Scale bar: 100 μm. (B) Picrosirius red‐stained MSLC‐isolatable (n = 3) and MSLC‐non‐isolatable (n = 3) GBM patient samples. Image: collagen fibre (top, polarized light) and analysis of polarized area (bottom). Graph shows collagen fibre area = polarized area/total area (n = 3). (C) Gene set enrichment analysis (GSEA) of MSLC‐isolatable and non‐isolatable patients. Analysis of gene set related to ECM‐cell adhesion by each GBM subtype. (D) Kaplan–Meier survival curves of all glioma patients (REMBRANDT) with fixed high or low LOX and COL1A1 median expression. (E) GSEA of all GBMLGG patients with high and low median LOX expression. (F) GBM subtype‐specific expression of the indicated genes in patients with GBM in The Cancer Genome Atlas (TCGA). (G) Two‐gene scatter plots of the indicated genes in patients with glioma in TCGA. (H) Kaplan–Meier survival curves of all glioma patients (TCGA) with high or low indicated median expression of gene. (I) Schematic summarizing promotion of ECM remodelling and GBM infiltration by GBM‐educated MSLCs in the tumour microenvironment. n.s. = not significant, *p < .05, **p < .01, ****p < .0001

Similar articles

Cited by

References

    1. Ohka F, Natsume A, Wakabayashi T. Current trends in targeted therapies for glioblastoma multiforme. Neurol Res Int. 2012;2012:878425. - PMC - PubMed
    1. Thakkar JP, Dolecek TA, Horbinski C, et al. Epidemiologic and molecular prognostic review of glioblastoma. Cancer Epidemiol Biomarkers Prev. 2014;23(10):1985‐1996. - PMC - PubMed
    1. Stummer W, Pichlmeier U, Meinel T, Wiestler OD, Zanella F, Reulen HJ. Fluorescence‐guided surgery with 5‐aminolevulinic acid for resection of malignant glioma: a randomised controlled multicentre phase III trial. Lancet Oncol. 2006;7(5):392‐401. - PubMed
    1. Caverzasi E, SL Hervey‐Jumper, Jordan KM, et al. Identifying preoperative language tracts and predicting postoperative functional recovery using HARDI q‐ball fiber tractography in patients with gliomas. J Neurosurg. 2016;125(1):33‐45. - PubMed
    1. Arvanitis CD, Ferraro GB, Jain RK. The blood‐brain barrier and blood‐tumour barrier in brain tumours and metastases. Nat Rev Cancer. 2020;20(1):26‐41. - PMC - PubMed

Publication types