. 2022 Dec 16;31(24):4255-4274.
doi: 10.1093/hmg/ddac170.

A novel mouse model of CMT1B identifies hyperglycosylation as a new pathogenetic mechanism

Affiliations

A novel mouse model of CMT1B identifies hyperglycosylation as a new pathogenetic mechanism

Francesca A Veneri et al. Hum Mol Genet. .

Abstract

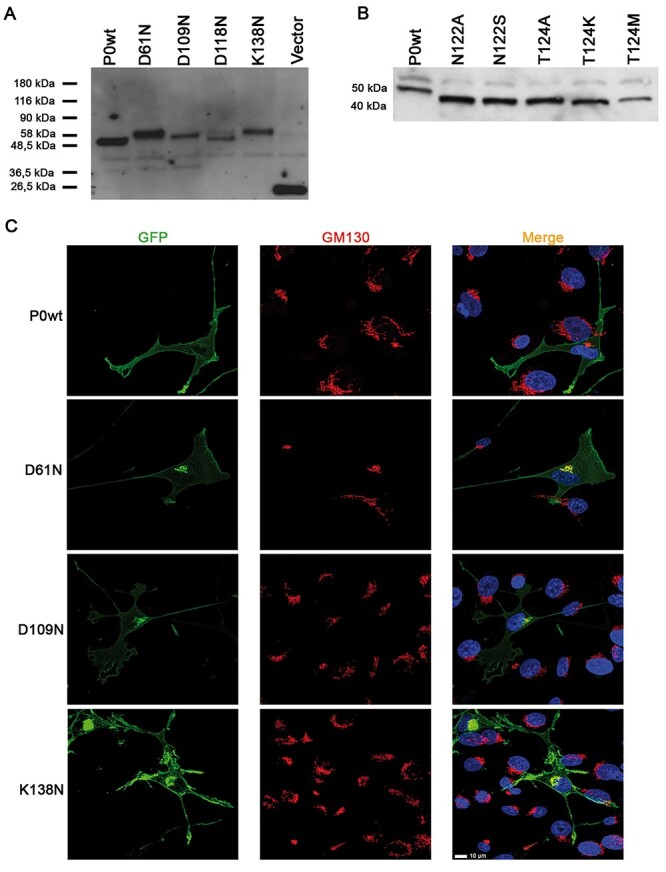
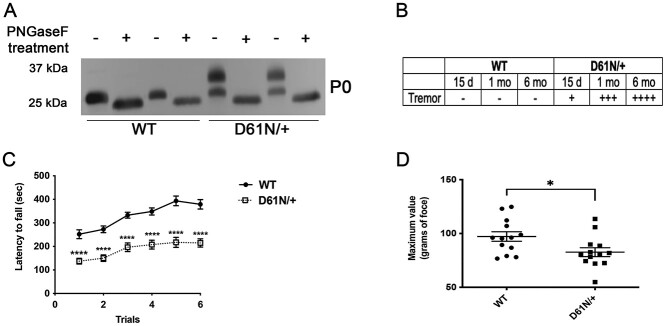
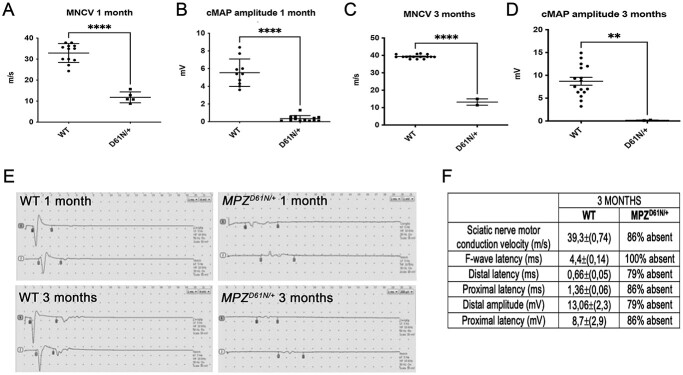
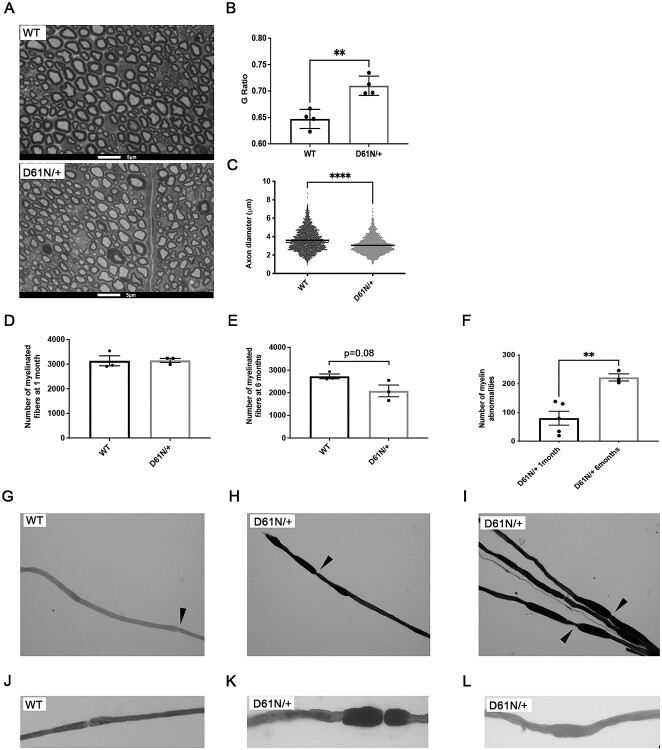
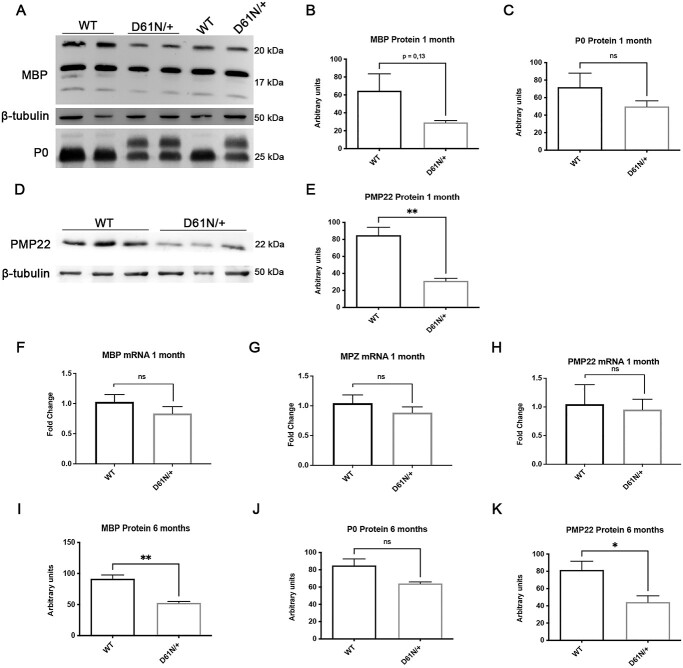
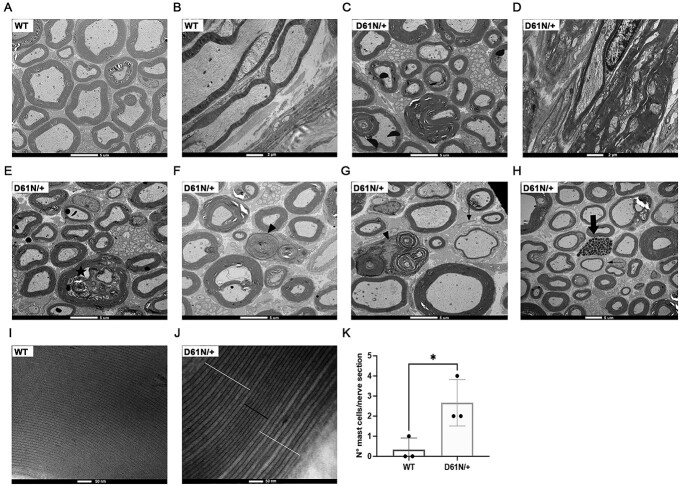
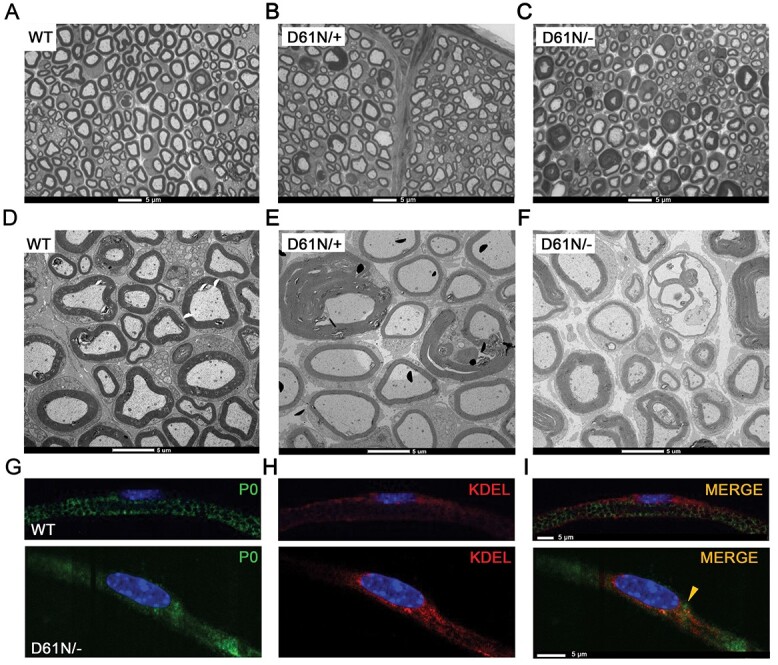
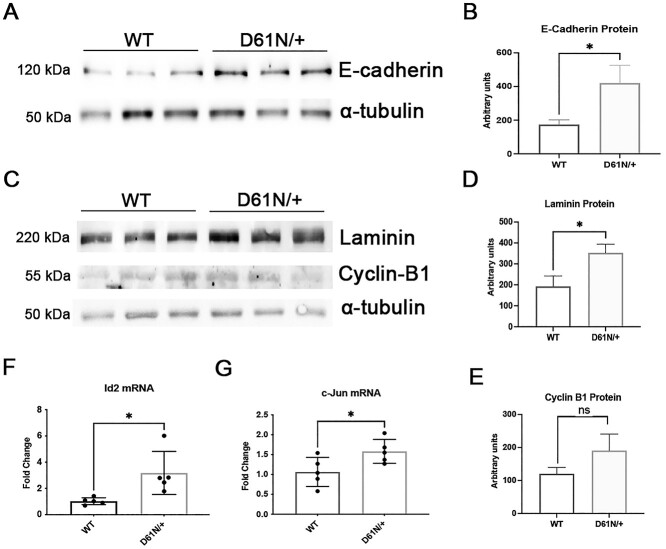
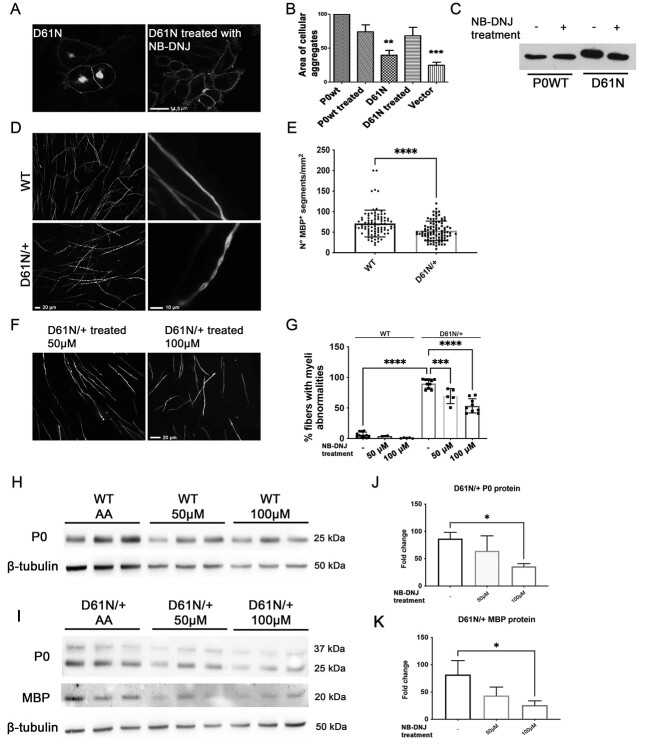
Mutations in the Myelin Protein Zero gene (MPZ), encoding P0, the major structural glycoprotein of peripheral nerve myelin, are the cause of Charcot-Marie-Tooth (CMT) type 1B neuropathy, and most P0 mutations appear to act through gain-of-function mechanisms. Here, we investigated how misglycosylation, a pathomechanism encompassing several genetic disorders, may affect P0 function. Using in vitro assays, we showed that gain of glycosylation is more damaging for P0 trafficking and functionality as compared with a loss of glycosylation. Hence, we generated, via CRISPR/Cas9, a mouse model carrying the MPZD61N mutation, predicted to generate a new N-glycosylation site in P0. In humans, MPZD61N causes a severe early-onset form of CMT1B, suggesting that hyperglycosylation may interfere with myelin formation, leading to pathology. We show here that MPZD61N/+ mice develop a tremor as early as P15 which worsens with age and correlates with a significant motor impairment, reduced muscular strength and substantial alterations in neurophysiology. The pathological analysis confirmed a dysmyelinating phenotype characterized by diffuse hypomyelination and focal hypermyelination. We find that the mutant P0D61N does not cause significant endoplasmic reticulum stress, a common pathomechanism in CMT1B, but is properly trafficked to myelin where it causes myelin uncompaction. Finally, we show that myelinating dorsal root ganglia cultures from MPZD61N mice replicate some of the abnormalities seen in vivo, suggesting that they may represent a valuable tool to investigate therapeutic approaches. Collectively, our data indicate that the MPZD61N/+ mouse represents an authentic model of severe CMT1B affirming gain-of-glycosylation in P0 as a novel pathomechanism of disease.


Figures

Figure 1
Figure 1
P0 mutant proteins analysis. (A) WB on extracts from Schwannoma cells transiently transfected with plasmids expressing predicted P0 hyperglycosylating mutants. (B) WB on extracts from Schwannoma cells transiently transfected with plasmids expressing predicted P0 hypoglycosylating mutants. (C) Confocal microscopy of Schwannoma cells transiently transfected with the EGFP-tagged hyperglycosylated P0 proteins D61N, D109N and K138N costained with the Golgi marker GM130; mutant proteins, but not P0wt, partially colocalize with GM130. Scale bar = 10 μm.
Figure 2
Figure 2
Analysis of the MpzD61N mouse model. (A) WB for P0 on proteins extracted from sciatic nerves of WT and MpzD61N/+ animals treated with PNGaseF. Before PNGase digestion P0D61N/+ extracts show a double band; after treatment with PNGaseF, the MW of P0 in MpzD61N/+ samples decreases to a single band of the same MW as in the WT. (B) Table describing the tremor in WT and MpzD61N/+ mice at different time points; the scale is visual and goes from – (no tremor) to + (mild tremor) to ++++ (very severe tremor). (C) Rotarod analysis, performed at 3 months of age, shows that MpzD61N/+ have a severe reduction in motor capacity as compared with WT; ****P-value < 0.0001 by two-way ANOVA with Sidak multiple comparison post-hoc test. n = 8 for each genotype. (D) Grip strength test, performed at 3 months of age, shows that MpzD61N/+ mice have reduced strength in hind limbs as compared with WT. *P-value = 0.0246 by unpaired Student t-test. n = 13 for each genotype.
Figure 3
Figure 3
Mpz  D61N/+ mice present altered electrophysiological parameters. (A) MNCVs and (B) CMAP amplitudes recorded at 1 month in WT and MpzD61N/+ mice; ****P-value < 0.0001 by unpaired Student t-test. n = 8 for each genotype. (C) MNCVs and (D) CMAP amplitudes recorded at 3 months in WT and MpzD61N/+ mice; ****P-value < 0.0001 by unpaired Student t-test. n = 8 for each genotype. (E) Original recordings in WT and MpzD61N/+ at 1 and 3 months. Flags indicate the onset and end of the CMAPs; MpzD61N/+ mice showed a significant reduction of nerve conduction velocities, a prolonged latency of both distal and proximal CMAP as well as a reduced CMAP amplitude compared with controls. (F) Table representing the analysis of different electrophysiological parameters in WT and MpzD61N/+ animals at 3 months. In the MpzD61N/+ column, we indicated the percentage of animals in which the different parameters were unrecordable.
Figure 4
Figure 4
Morphological analysis of WT and MpzD61N/+ sciatic nerves. (A) Images of semithin section of sciatic nerves from WT and MpzD61N/+ mice at 1 month. Magnification: 100X; Scale bar = 5 μm. (B) G-ratio of WT and MpzD61N/+ fibers. Error bars, SEM; **P = 0.0027 by unpaired, two-tailed, Student t-test. n = 4 for each genotype. (C) Comparison between axon diameter of WT and MpzD61N/+ fibers. Unpaired, two-tailed, Student t-test; ****P-value < 0.0001. (D) Number of fibers in WT and MpzD61N/+ sciatic nerves at 1 month and (E) 6 months (n = 3 mice at both time points). Unpaired, two-tails, Student t-test; P-value 0.93 and 0.08, respectively. (F) Number of myelin abnormalities in MpzD61N/+ sciatic nerves at 1 month and 6 months (n = 4 mice at both time points). Error bars, SEM. P = 0.0055 by unpaired, two-tails, Student t-test. (G–L) Osmicated teased nerve fibers from WT and MpzD61N/+ mice. Focal myelin thickenings, absent in the WT, originate both at paranodal regions (magnified in K) and at internodal regions (magnified in L). Magnification 20X in G-I, 40X in J–L. Arrows in G–I indicate nodes of Ranvier.
Figure 5
Figure 5
Analysis of myelin proteins. (A) WB and protein quantification of (B) MBP and (C) P0 in sciatic nerves of 1-month WT and MpzD61N/+ animals. Error bars, SEM; unpaired, two-tails, Student t-test; P-value 0.1357 and 0.2702, respectively. One representative blot of three is shown. (D) WB and (E) protein quantification of PMP22 in sciatic nerves of 1-month WT and MpzD61N/+ animals. Error bars, SEM; unpaired, two-tails, Student t-test; P-value = 0.0055. One representative blot of three is shown. mRNA level of (F) MBP, (G) MPZ and (H) PMP22 in sciatic nerves of 1-month WT and MpzD61N/+ animals. Error bars, SEM; unpaired, two-tails, Student t-test; P-values of 0.2779, 0.3723 and 0.5991, respectively. Each experiment was repeated five times. Protein quantification for (I) MPB, (J) P0 and (K) PMP22 in sciatic nerves of 6-month WT and MpzD61N/+ animals. Error bars, SEM; unpaired, two-tails, Student t-test; P-values of 0.0041, 0.0555 and 0.0412, respectively. β-tubulin was used as loading control.
Figure 6
Figure 6
Electron microscopy of WT and MpzD61N/+ sciatic nerves. (A) Transverse and (B) longitudinal section of WT and (C, D) MpzD61N/+ sciatic nerves. Scale bar: 5 μm in the transverse sections, 2 μm in the longitudinal sections. (E) In MpzD61N/+ sciatic nerve signs of axonal degeneration (star), (F, G) macrophages (arrowheads), (H) inflammatory infiltrate (thick arrow) and (G, H) rare cases of onion bulbs (thin arrows) are shown. Scale bar= 5 μm. (I) Transverse section of a WT and (J) MpzD61N/+ sciatic nerve myelin. The black bar indicates normally compacted myelin lamellae, whereas white bars indicate myelin uncompaction and widening of the IPL. Scale bar = 500 nm. (K) Quantification of mast cells per nerve section in WT and MpzD61N/+ reconstructed sciatic nerves. Error bars, SEM; unpaired, two-tails, Student t-test; P-value = 0.0352.
Figure 7
Figure 7
Analysis of WT, MpzD61N/+ and MpzD61N/− mice. Semithin section of sciatic nerves from (A) WT, (B) MpzD61N/+ and (C) MpzD61N/− mice at 1 month. Magnification: 100X; Scale bar = 5 μm. Electron microscopy images of transverse sections of sciatic nerves from (D) WT, (E) MpzD61N/+ and (F) MpzD61N/− mice. Scale bar = 5 μm. Immunofluorescence for (G) P0 (green) and (H) KDEL (red) in teased fibers from 1-month sciatic nerves of WT and MpzD61N/− mice. The third panel (I) represents the merge between P0 and KDEL. Nuclei were stained in blue (DAPI). Scale bar = 5 μm.
Figure 8
Figure 8
Validation of a small selection of genes altered in the RNA-seq data. (A) WB and protein quantification (B) for E-Cadherin. (C) WB and protein quantification (D) for Laminin and (E) Cyclin B-1 in sciatic nerves of 2-month WT and MpzD61N/+ animals. Error bars, SEM; unpaired, two-tails, Student t-test; P-values of 0.0313, 0.0328 and 0.3044, respectively. One representative blot of three is shown. Quantitative RT-PCR analysis for (F) Id2 and (G) c-Jun on mRNA extracted form WT and MpzD61N/+ sciatic nerves. Error bars, SEM; unpaired, two-tails, Student t-test; P-values of 0.0202 and 0.0402, respectively; n = 5 RT from independent nerves.
Figure 9
Figure 9
Treatment with NB-DNJ in vitro and ex vivo. (A) Confocal images of HeLa cells expressing the mutant protein P0D61N before and after the treatment with NB-DNJ; scale bar = 14.5 μm. (B) Adhesion assay performed on HeLa cells treated with NB-DNJ, the nontreated cells have been used as control. **P < 0.01 and ***P < 0.001 by one-way ANOVA with Tukey post-hoc test. (C) WB analysis on extracts from HeLa cells expressing P0wt or P0D61N treated with NB-DNJ. (D) Images of WT (upper panel) and MpzD61N/+ (lower panel) DRGs stained for MBP. In mutant cultures, there are fewer and often abnormal myelinated internodes. Scale bars 20 and 10 μm in the left and right panels, respectively. (E) Quantification of MBP+ segments in WT and MpzD61N/+ DRGs. ****P < 0.0001 by one-way ANOVA with Tukey post-hoc test. Three different dissections were performed. (F) DRG cultures from MpzD61N/+ embryos treated with 50 or 100 μM NB-DNJ and (G) quantification of myelin abnormalities before and after the treatment. ****P < 0.0001 by one-way ANOVA followed by Holm–Sidak test. Scale bar in (F), 20 μm. WB analysis for P0 and MBP on protein extracts from DRG from (H) WT and (I) MpzD61N/+ embryos treated with ascorbic acid only (AA) or with AA + NB-DNJ for 14 days. β-tubulin was used as loading control. Quantification of the amount of (J) P0 and (K) MBP proteins in MpzD61N/+ DRGs after the treatment with NB-DNJ. *P < 0.05 by one-way ANOVA with Tukey post-hoc test.

Similar articles

Cited by

References

    1. Sherman, D.L. and Brophy, P.J. (2005) Mechanisms of axon ensheathment and myelin growth. Nat. Rev. Neurosci., 6, 683–690. - PubMed
    1. Jessen, K.R. and Mirsky, R. (2005) The origin and development of glial cells in peripheral nerves. Nat. Rev. Neurosci., 6, 671–682. - PubMed
    1. Patzig, J., Jahn, O., Tenzer, S., Wichert, S.P., de Monasterio-Schrader, P., Rosfa, S., Kuharev, J., Yan, K., Bormuth, I., Bremer, J. et al. (2011) Quantitative and integrative proteome analysis of peripheral nerve myelin identifies novel myelin proteins and candidate neuropathy loci. J. Neurosci., 31, 16369–16386. - PMC - PubMed
    1. Filbin, M.T., Walsh, F.S., Trapp, B.D., Pizzey, J.A. and Tennekoon, G.I. (1990) Role of myelin P0 protein as a homophilic adhesion molecule. Nature, 344, 871–872. - PubMed
    1. Shapiro, L., Doyle, J.P., Hensley, P., Colman, D.R. and Hendrickson, W.A. (1996) Crystal structure of the extracellular domain from P0, the major structural protein of peripheral nerve myelin. Neuron, 17, 435–449. - PubMed

Publication types

Substances