. 2022 Sep:106:102622.
doi: 10.1016/j.ceca.2022.102622. Epub 2022 Jul 20.

Ca2+ signalling system initiated by endoplasmic reticulum stress stimulates PERK activation

Affiliations

Ca2+ signalling system initiated by endoplasmic reticulum stress stimulates PERK activation

Constanza Feliziani et al. Cell Calcium. 2022 Sep.

Abstract

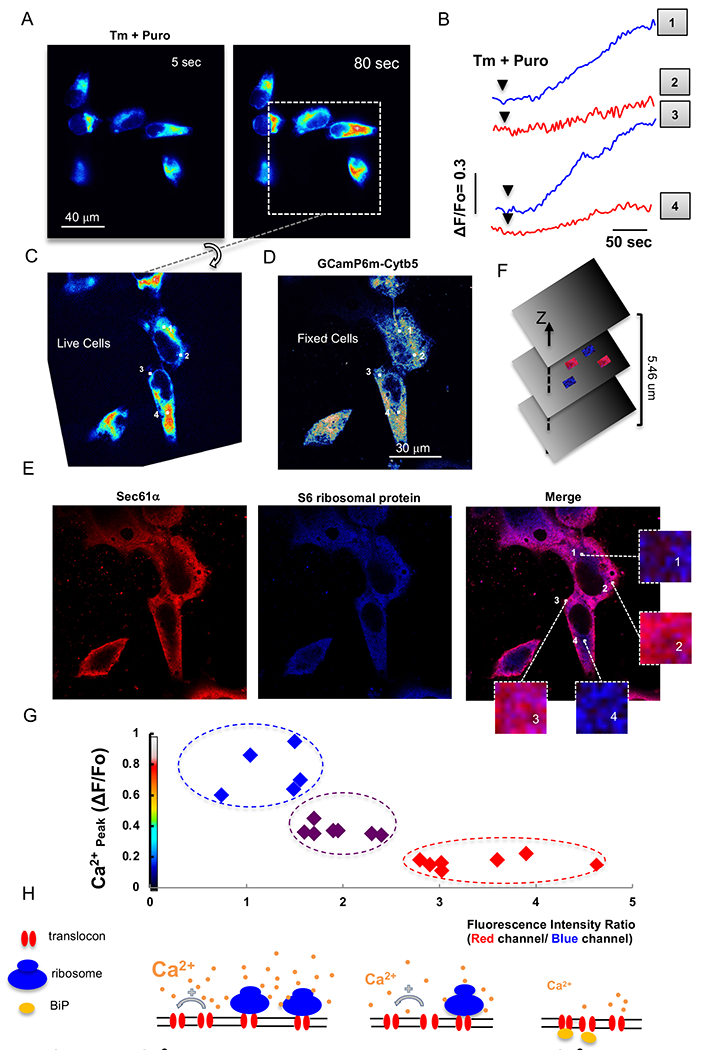
The accumulation of unfolded proteins within the Endoplasmic Reticulum (ER) activates a signal transduction pathway termed the unfolded protein response (UPR), which attempts to restore ER homoeostasis. If this cannot be done, UPR signalling ultimately induces apoptosis. Ca2+ depletion in the ER is a potent inducer of ER stress. Despite the ubiquity of Ca2+ as an intracellular messenger, the precise mechanism(s) by which Ca2+ release affects the UPR remains unknown. Tethering a genetically encoded Ca2+ indicator (GCamP6) to the ER membrane revealed novel Ca2+ signalling events initiated by Ca2+ microdomains in human astrocytes under ER stress, induced by tunicamycin (Tm), an N-glycosylation inhibitor, as well as in a cell model deficient in all three inositol triphosphate receptor isoforms. Pharmacological and molecular studies indicate that these local events are mediated by translocons and that the Ca2+ microdomains impact (PKR)-like-ER kinase (PERK), an UPR sensor, activation. These findings reveal the existence of a Ca2+ signal mechanism by which stressor-mediated Ca2+ release regulates ER stress.

Keywords: (PKR)-like-ER kinase (PERK); Calcium signalling; Inositol triphosphate receptor; Translocon; Unfolded protein response.


Conflict of interest statement

Declaration of Competing Interest

The authors declare no competing financial interests.

Figures

Fig. 1:
Fig. 1:. Global calcium increases following addition of high-concentration tunicamycin.
Measurement of cytosolic Ca2+ changes by confocal imaging of cultured human astrocytes expressing Ca2+ indicator GCaMP6-Cytb5. (A) Schematic representation of GCaMP6-Cytb5. GCaMP6 fused at the C-terminus to the transmembrane domain of cytochrome b5 (Cytb5) for tethering to ER membrane. Images obtained by Nikon Swept Field confocal microscopy (see Materials and methods). (B) Single confocal image frames in pseudo-colour showing Ca2+ release before and after Tm treatment (Tm; 2.5 μg/ml) at indicated times. Intensity scale bar for these images shown. (C) Fluorescence intensity values obtained by selecting a 5x5-pixel region from subsequent images during recording of individual astrocytes. Values normalised against values obtained prior to Tm treatment (ΔF/F0) and plotted as a function of time. Numbers 1-4 correspond to specific regions marked on frame shown in panel (A). A representative experiment from 3 independent experiments is shown.
Fig. 2:
Fig. 2:. Low-concentration tunicamycin induces local calcium releases in microdomains near ER.
Cytosolic Ca2+ changes measured as in Fig. 1. (A) Confocal images (greyscale) corresponding to Ca2+ release before (71 sec) and after (389, 395, 594 sec) Tm (0.5 μg/ml) treatment. Insets: magnification of regions with changes in cytosolic Ca2+ shown in pseudo-colour. (B) Surface plot corresponds to magnified regions, illustrating local changes in cytosolic Ca2+. (C) Fluorescence intensity values obtained as in Fig. 1, and ΔF/F0 plotted as a function of time. A representative experiment from 6 independent experiments is shown. Data derived from the data set of 2A-C, Fig. 5 and Table 2 plotted as scatter plots showing a significant correlation (Pearson’s R2) between Time-to-Peak Amplitude (sec.) (D) and Amplitude (90% of ΔF/F0) (E) against the logarithm of their corresponding Ca2+ event Spatial spread μm2); dotted lines, significant negative (D) and positive (E) regression. (D, E): number of cells tested are indicated. The same data as in (D-E) grouped by sites of similar size (average of 3 or 4 values). Histograms show the distribution either of Time-to-Peak Amplitude (sec.) (F) or Amplitude (90% of ΔF/F0) (G) as functions of their corresponding Ca2+ event Spatial spread μm2). (H) Fluorescence intensity values obtained as in Fig. 1, and ΔF/F0 plotted as a function of time after Tm (Tm; 0.5 μg/ml) and Tg (1μM) treatments. A representative experiment from 11 independent experiments is shown.
Fig. 3:
Fig. 3:. AB5 subtilase cytotoxin and emetine modulate Tm-induced local Ca2+ increase.
Human astrocytes pre-incubated with either AB5 subtilase cytotoxin (SubAB; 1 μg/ml, 30 min) or emetine (1 μM, 30 min), and added with 0.5 μg/ml Tm. (A) Sequential confocal images in pseudo-colour illustrating Tm-induced Ca2+ release by control, SubAB-treated, and emetine-treated cells. Insets show Ca2+ increase events. (B) Data for GCamP6-Cytb5 Ca2+ increase in terms of ΔF/F0 obtained as in Fig. 1 and plotted as a function of time for each condition. Representative data from 4 independent experiments are shown. (C) Histograms (mean ± SEM) showing maximal ΔF/F0 for each condition. *p<0.05, ***p<0.0001 (ANOVA, Tukey’s HSD test).
Figure 4:
Figure 4:. Pharmacological inhibition of Tm-evoked Ca2+ microdomains decrease PERK activation.
Human astrocytes pre-incubated in the absence or presence of emetine (100 μM, 30 min), and treated with Tm (0.5 μg/ml, 30 min). Fixed cells, immunolabelled with anti-P-PERK primary antibody and visualised with Alexa-488 conjugated secondary antibody (green). DAPI (blue) and rhodamine phalloidin (red), used to visualise nuclei and F actin, respectively. Images from Zeiss LSM 800 confocal microscope. (B) Boxplots indicates median, 25th and 75th percentile limits and extreme values. (C) Astrocytes treated as indicated, cytosolic Ca2+ changes measured and fluorescence intensity values obtained as in Fig. 1. 9F/F0 plotted as a function of time. (D) Dot blots show maximal ΔF/F0 of Ca2+ events (means: dashed lines). (E) Cells pre-incubated in the absence or presence of BAPTA-AM (20 μM, 30 min), and treated with Tm (0.5 μg/ml, 15min);. The proteins were resolved through 12% SDS-PAGE and visualized as described in Materials and Methods. (F) Histograms (mean ± SEM) represent densitometric analysis. (A-F): Representative data from 3 independent experiments are shown. (B) *p<0.05, ns: not significant (ANOVA, Tukey’s HSD test). (D) ***p≤0.0001 (Student T test). (F) * p≤0.05, ***p≤0.0001, ns: not significant (ANOVA, Tukey’s HSD test).
Fig. 5:
Fig. 5:. EGTA-AM and xesto/ryano treatments increase the likelihood of local Ca2+ increase following Tm addition.
Human astrocytes pre-incubated with either EGTA-AM (1 μM, 20 min) or xesto (3 μM, 30 min)/ryano (50 μM, 60 min), and added with 0.5 μg/ml Tm. Sequential subtraction: pixel-by-pixel intensity values for each frame subtracted from the values of some earlier frame for clear visualisation of microdomains (A). Percentages of cells with microdomains before and after subtraction (mean ± SEM) for each condition shown respectively as blue and red. (B) Total numbers of Ca2+ microdomains before (Initial) and after subtraction in positive cells (mean ± SEM) for each condition shown respectively as blue and red. (C-E) Confocal image stacks in pseudo-colour before and after subtraction for control (C), xesto/ryano-treated (D), and EGTA-treated (E) cells. Insets show microdomains. (A, B): Representative data shown from 5 independent experiment. *p<0.05, ***p<0.0001, ns: not significant (ANOVA, Tukey’s HSD test)
Fig.6:
Fig.6:. Puromycin treatment enhances Tm-induced local Ca2+ increase in TKO-HEK cells.
TKO-HEK treated with Tm (2.5 μg/ml) and puromycin (20 μM). Images obtained by Olympus Spinning Disk confocal microscopy (see Materials and methods). (A) Confocal images in pseudo-colour illustrating Ca2+ release in response to Tm + puromycin addition. (B-C) Histograms showing numbers of microdomains (B) or local areas (C) in positive cells for each condition. (D-E) Dot plots showing spatial spread μm2) of microdomains (D) or local areas (E) for each condition. (F-G) Histograms showing maximal ΔF/F0 of microdomains (F) or local areas (G) for each condition. Data are mean ± SEM. Number either of cells tested (B-E) or of local events (F-G) indicated next to the dot plots or above each bar. (B-G): Representative data shown from 4 independent experiment. Statistics: *p<0.05, ns: not significant (ANOVA, Tukey’s HSD test).
Fig. 7:
Fig. 7:. Tm-induced local Ca2+ increase is reduced by chaperone BiP overexpression.
TKO-HEK cells co-overexpressing either GCaMP6-Cytb5 and mCherry-BiP or GCaMP6-Cytb5 and an empty mCherry vector (pUltra hot) added with 2.5 μg/ml Tm, and Ca2+ confocal images taken. (A) Representative images of GCamp6-Cytb5 (green) and mCherry-BiP (red) expression by TKO-HEK. Scale bar: 20 μm. (B) Confocal image sequences in pseudo-colour illustrating Tm-induced Ca2+ release for each condition. Insets show Ca2+ increase events. The two fluorophores were recorded alternately. (C) Data for GCamP6-Cytb5 Ca2+ increase in terms of ΔF/F0 obtained as in Fig. 1 and plotted as a function of time for each condition. Representative data shown from 3 independent experiments. (D) MOCs calculated for a 5x5-pixel ROI showing Ca2+ release. MOC M2 pooled as sets of values <0.5 and >0.5 (low and high co-localisation, respectively), and average. M2 averages plotted vs. average peak Ca2+ responses. Boxplots indicates median, 25th and 75th percentile limits and extreme values. ROIs in which mCherry-BiP overlapped GCamP6-Cytb5 displayed a significant reduction in the amplitude of Ca2+ release (shown red in (C) and (D)) relative to ROIs with no overlap (shown blue in (C) and (D). (E) Cells co-overexpressing GCaMP6-Cytb5 and empty mCherry vector treated and Ca2+ confocal images taken. MOCs calculated and data analysed as in D. (D, E): Data pooled from 3 independent experiments, analysing: 30 cells / 50 ROIs in the mCherry-BiP condition and 25 cells / 62 ROIs in the empty mCherry vector condition. ***p<0.0001; ns: not significant (ANOVA, Tukey’s HSD test). (F) Scheme illustrating sequence of events under ER stress, leading BiP titrated by the unfolded proteins and then Ca2+-dependent PERK activation.
Fig. 8:
Fig. 8:. Cytosolic Ca2+ concentration regulates Tm-induced local Ca2+ increase.
TKO-HEK cells expressing GCamP6-Cytb5 cultured in dishes with imprinted grids added with Tm (0.5 μg/ml) and puromycin (20 μM). (A) Confocal image sequences in pseudo-colour illustrating Tm-induced Ca2+ release before (5 sec) and after (80 sec) Tm + puromycin treatment. Scale bar: 40 μm. (B) Data for GCamP6-Cytb5 Ca2+ increase in terms of ΔF/F0 obtained as in Fig. 1 and plotted as a function of time for each cell. Representative data for 3 independent experiments shown. (C) Cells fixed in formaldehyde immediately after Ca2+ release detected. Left: last stack of Ca2+ imaging recorded. Right: same group of cells after fixation. Each fixed cell recorded in Ca2+ imaging identified and then rotated. Numbers 1-4 indicate regions with differing magnitudes of Ca2+ increase (see (B)). (D-E) Fixed cells immunostained. Optical sectioning of confocal images performed using Zeiss LSM 800 confocal microscope. (F) Schematic representation of 21 optical sections (plane thickness: 0.23 μm; total thickness: 5.46 μm). Fluorescence intensities analysed only in the Z-plane, in which blue and red regions were obvious. (E) Fixed cells stained with anti-S6 ribosomal protein (shown as red) and with anti-Sec61α (shown as blue), and with Alexa-conjugated anti-rabbit Alexa Fluor 568 and anti-mouse Alexa Fluor 405 (respectively) secondary antibodies, or the corresponding merge image. Magnified image shows ROI in which Ca2 + was measured (see (B)). There are clear immunostaining differences between ROIs #1 and #4 vs. #2 and #3. (G) Red and blue fluorescence intensities expressed as a ratio and plotted vs. changes in GCamP6-Cytb5 fluorescence (ΔF/Fo) for the same ROIs. (H) Scheme illustrating cytosolic Ca2+ regulation of Ca2+ release through translocon. ROIs with abundant ribosome-free translocons displayed a significantly lower amplitude of Ca2+ release (shown as red in (G)) than ROIs with predominantly ribosome-bound translocons (shown as blue in (G)).
Fig. 9:
Fig. 9:. Ca2+ signal generated by translocon during early phase of ER stress.
(1) Steady state of ER: protein (shown as spirals) processing and luminal Ca2+ concentration optimal. Most translocon pores blocked by BiP and/or ribosomes, maintaining the permeability barrier. When translocation is completed, ion permeability increases because of release of the nascent chain and the dissociation of ribosomes from the Sec61 complex, accounting for the passive Ca2+ leak. SERCA2b counteracts the loss of Ca2+. (2) ER stress: eIF2α phosphorylation inhibits delivery of the initiator methionyl-tRNAi to the ribosome and its association to the Sec61α, resulting in protein translation attenuation, and BiP titrated by unfolded protein is dissociated from the luminal domain of ribosome-free translocon. Ca2+ release through the translocon enhanced, and further amplified by CICR, which recruit neighbouring translocons. (3) New translocon clusters activated by Ca2+ positive feedback. (4) High local Ca2+ concentration becomes inhibitory, binding CaM that engage ribosomes to block translocon Ca2+ flux, and thus Ca2+ signal remains a local event. (5) SERCA2b activated and mediates removal of Ca2+ from Ca2+ microdomains, and the consequent dissociation of Ca2+ from CaM. Cessation of Ca2+ inhibition accounts in part for generation of repetitive Ca2+ microdomains. (6) Ca2+ released from translocon clusters activates Ca2+ flux through the IP3R by the CICR mechanism, which further amplifies the signal, resulting in generation either of Ca2+ waves (astrocytes) or of a rise in Ca2+ with higher amplitude (HEK wt cells).

Similar articles

Cited by

References

    1. Zheng K, Bard L, Reynolds JP, King C, Jensen TP, Gourine AV, Rusakov DA, Time-Resolved Imaging Reveals Heterogeneous Landscapes of Nanomolar Ca(2+) in Neurons and Astroglia, Neuron 88(2) (2015) 277–88. - PMC - PubMed
    1. Sneyd J, Keizer J, Sanderson MJ, Mechanisms of calcium oscillations and waves: a quantitative analysis, FASEB journal : official publication of the Federation of American Societies for Experimental Biology 9(14) (1995) 1463–72. - PubMed
    1. Berridge MJ, Bootman MD, Roderick HL, Calcium signalling: dynamics, homeostasis and remodelling, Nature reviews. Molecular cell biology 4(7) (2003) 517–29. - PubMed
    1. Berridge MJ, Elementary and global aspects of calcium signalling, The Journal of physiology 499 ( Pt 2) (1997) 291–306. - PMC - PubMed
    1. Camacho P, Lechleiter JD, Spiral calcium waves: implications for signalling, Ciba Foundation symposium 188 (1995) 66–77; discussion 78-84. - PubMed

Publication types