. 2022 Aug 4;109(8):1405-1420.
doi: 10.1016/j.ajhg.2022.06.016. Epub 2022 Jul 30.

Simultaneous inference of parental admixture proportions and admixture times from unphased local ancestry calls

Affiliations

Simultaneous inference of parental admixture proportions and admixture times from unphased local ancestry calls

Siddharth Avadhanam et al. Am J Hum Genet. .

Abstract

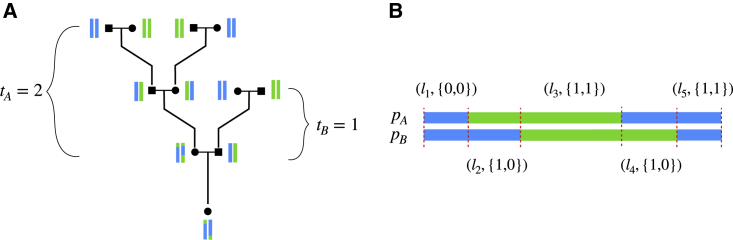
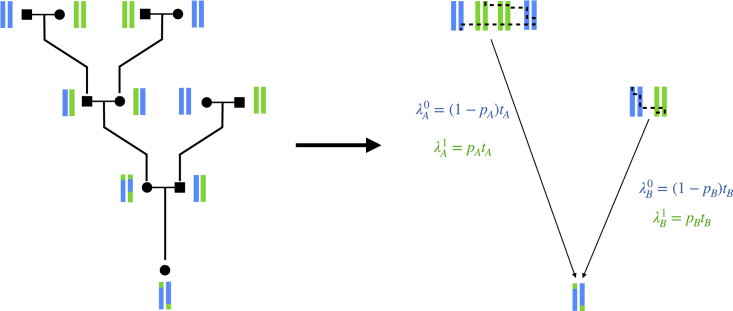
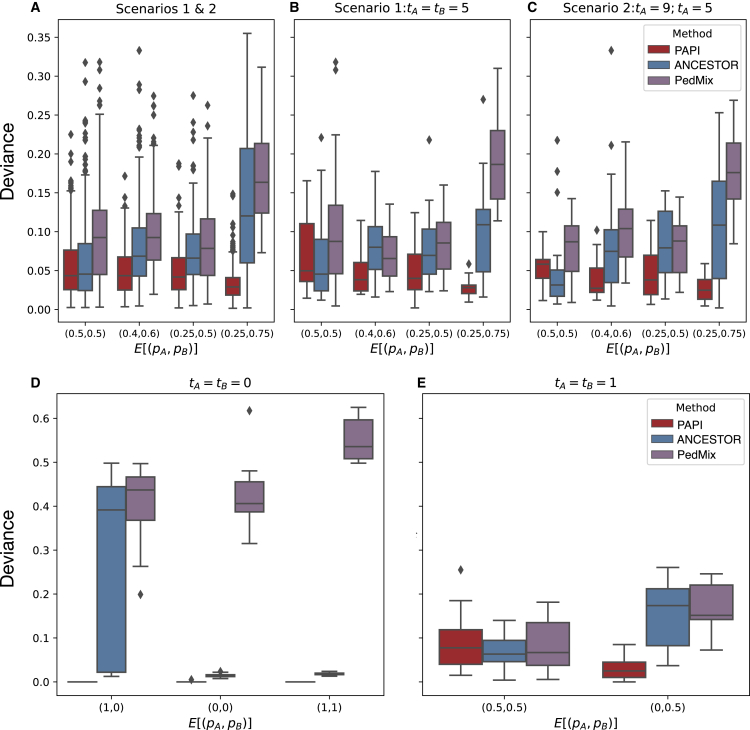
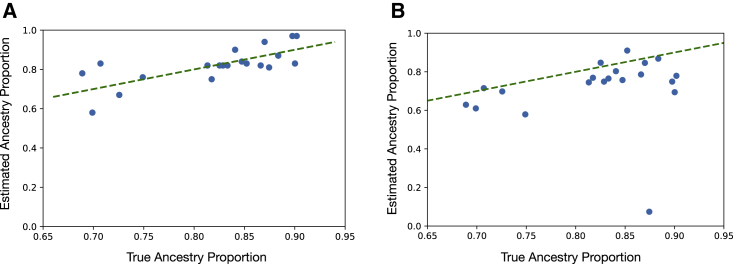
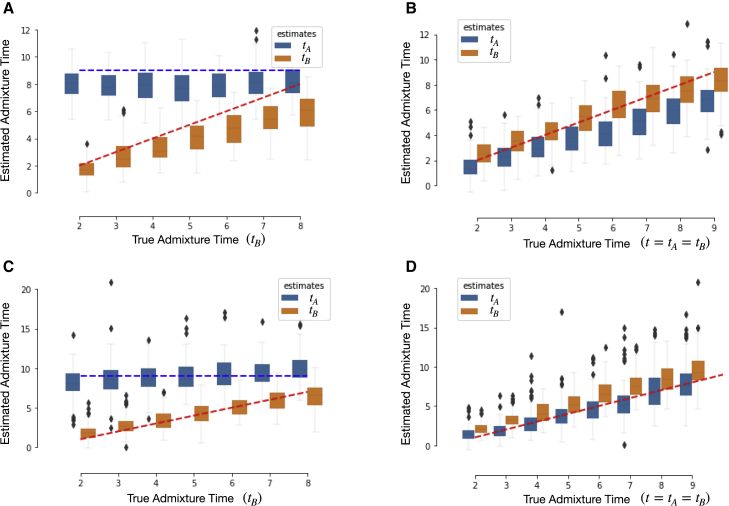
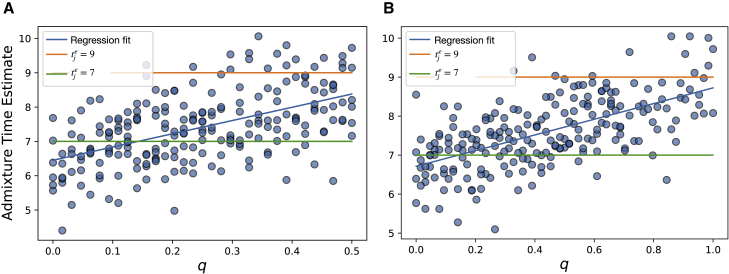
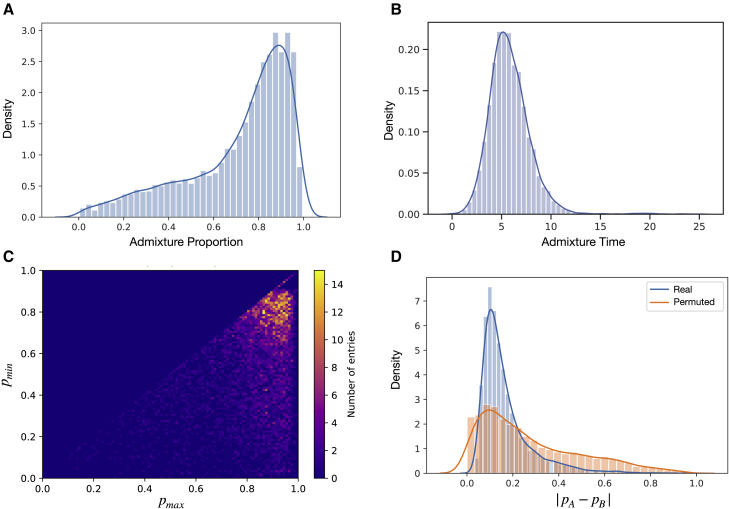
Population genetic analyses of local ancestry tracts routinely assume that the ancestral admixture process is identical for both parents of an individual, an assumption that may be invalid when considering recent admixture. Here, we present Parental Admixture Proportion Inference (PAPI), a Bayesian tool for inferring the admixture proportions and admixture times for each parent of a single admixed individual. PAPI analyzes unphased local ancestry tracts and has two components: a binomial model that leverages genome-wide ancestry fractions to infer parental admixture proportions and a hidden Markov model (HMM) that infers admixture times from tract lengths. Crucially, the HMM accounts for unobserved within-ancestry recombination by approximating the pedigree crossover dynamics, enabling inference of parental admixture times. In simulations, we find that PAPI's admixture proportion estimates deviate from the truth by 0.047 on average, outperforming ANCESTOR and PedMix by 46.0% and 57.6%, respectively. Moreover, PAPI's admixture time estimates were strongly correlated with the truth (R=0.76) but have an average downward bias of 1.01 generations that is partly attributable to inaccuracies in local ancestry inference. As an illustration of its utility, we ran PAPI on African American genotypes from the PAGE study (N = 5,786) and found strong evidence of assortative mating by ancestry proportion: couples' ancestry proportions are highly correlated (R = 0.87) and are closer to each other than expected under random mating (p < 10-6). We anticipate that PAPI will be useful in studying the population dynamics of admixture and will also be of interest to individuals seeking to learn about their personal genealogies.

Keywords: admixture; assortative mating; local ancestry.


Conflict of interest statement

Declaration of interests A.L.W. is an employee of and holds stock in 23andMe and is the owner of HAPI-DNA LLC.

Figures

Figure 1
Figure 1
Example pedigree and local ancestry data (A) Pedigree with vertical bars next to each individual representing two of their chromosomes, each colored to represent local ancestry from two populations, blue and green. tA and tB are the number of generations to the unadmixed ancestors for parents A and B, respectively; this is the generation in which at least one couple contains individuals of different ancestries. (B) PAPI takes in unphased local ancestry tracts denoted by xi = (li, ai). The image depicts a particular phasing of the data with labels that correspond to the observed unphased data.
Figure 2
Figure 2
Markovian approximation to an individual’s full pedigree Example pedigree for an admixed individual (left). Viewing the unadmixed ancestors as a pool of founder haplotypes (right), one for each parent, and further viewing recombinations as a Markovian switching process in this pool motivates the use of a single-pulse migration model to capture the effect of tj and pj on the observed between-ancestry Poisson switch rates λj0 and λj1.
Figure 3
Figure 3
Deviance statistics in simulated data for inferred parent ancestry proportions (pA,pB) from PedMix, ANCESTOR, and PAPI (A) Average absolute deviances (dabs,p) on all scenario 1 and 2 data. (B and C) Absolute deviances for data points where (B) tA = tB = 5 and (C) tA = 9 and tB = 5. (D and E) Average absolute deviance on all scenario 3 data. (D) PAPI estimates the ground truth near perfectly when E[(pA,pB)]{(1,0),(0,0),(1,1)} and (E) ANCESTOR and PedMix outperform PAPI when E[(pA,pB)]=(0.5,0.5) but PAPI’s deviance is low when E[(pA,pB)]=(0,0.5).
Figure 4
Figure 4
PAPI and ANCESTOR’s parent ancestry proportion estimates for the HapMap ASW trio children Scatter plots of estimated versus true parent ancestry proportions for (A) PAPI’s full model and (B) ANCESTOR.
Figure 5
Figure 5
PAPI’s estimated time since admixture in simulated individuals (A and B) Box plots of estimated times based on HAPMIX local ancestry tracts for (A) scenario 1 samples (where tA>tB) and (B) scenario 2 data (where tA = tB). (C and D) Estimated times based on exact local ancestry tracts for (C) scenario 1 and (D) scenario 2 individuals. In (A) and (C), the x-axis gives the true tB since tA is held fixed in these cases. Blue and orange dashed lines represent the simulation ground truths for tA and tB, respectively in (A) and (C), while the red dashed lines in (B) and (D) represent the simulation ground truths for tA and tB.
Figure 6
Figure 6
PAPI’s estimated time since admixture with two migrant pulses Plots show estimated time since admixture versus q (the proportion of couples in the tje generation with unadmixed individuals of different ancestries) when tje=9 and tjl=7 for (A) E[pj]=0.25 and (B) E[pj]=0.5. The blue lines depict the least-squares regressions on the plotted data points.
Figure 7
Figure 7
PAPI analyses from African Americans in the BioMe Biobank subset of PAGE (A) Distribution of the parent ancestry estimates (both pA and pB plotted separately) in these African Americans. (B) Distribution of time since admixture estimates (tA and tB plotted separately). (C) Heatmap of the ancestry proportions of couples (pA, pB) ordered as (pmax, pmin). (D) Distribution of |pApB| estimates from the real couples along with a permuted distribution.

References

    1. Ruhl G.L., Hazel J.W., Wright Clayton E., Malin B.A. Public attitudes toward direct to consumer genetic testing. AMIA Annu. Symp. Proc. 2019;2019:774. - PMC - PubMed
    1. Regalado A. More than 26 million people have taken an at-home ancestry test. MIT Tech. Rev. 2019;11:2019.
    1. Bryc K., Durand E.Y., Macpherson J.M., Reich D., Mountain J.L. The genetic ancestry of African Americans, Latinos, and European Americans across the United States. Am. J. Hum. Genet. 2015;96:37–53. - PMC - PubMed
    1. Han E., Carbonetto P., Curtis R.E., Wang Y., Granka J.M., Byrnes J., Noto K., Kermany A.R., Myres N.M., Barber M.J., et al. Clustering of 770, 000 genomes reveals post-colonial population structure of North America. Nat. Commun. 2017;8:14238. - PMC - PubMed
    1. Micheletti S.J., Bryc K., Ancona Esselmann S.G., Freyman W.A., Moreno M.E., Poznik G.D., Shastri A.J., 23andMe Research Team. Mountain J.L., et al. Genetic consequences of the transatlantic slave trade in the Americas. Am. J. Hum. Genet. 2020;107:265–277. - PMC - PubMed

Publication types