

NMR-based isotope editing, chemoselection and isotopomer distribution analysis in stable isotope resolved metabolomics
- PMID: 35908585
- PMCID: PMC9539636
- DOI: 10.1016/j.ymeth.2022.07.014
NMR-based isotope editing, chemoselection and isotopomer distribution analysis in stable isotope resolved metabolomics
Abstract
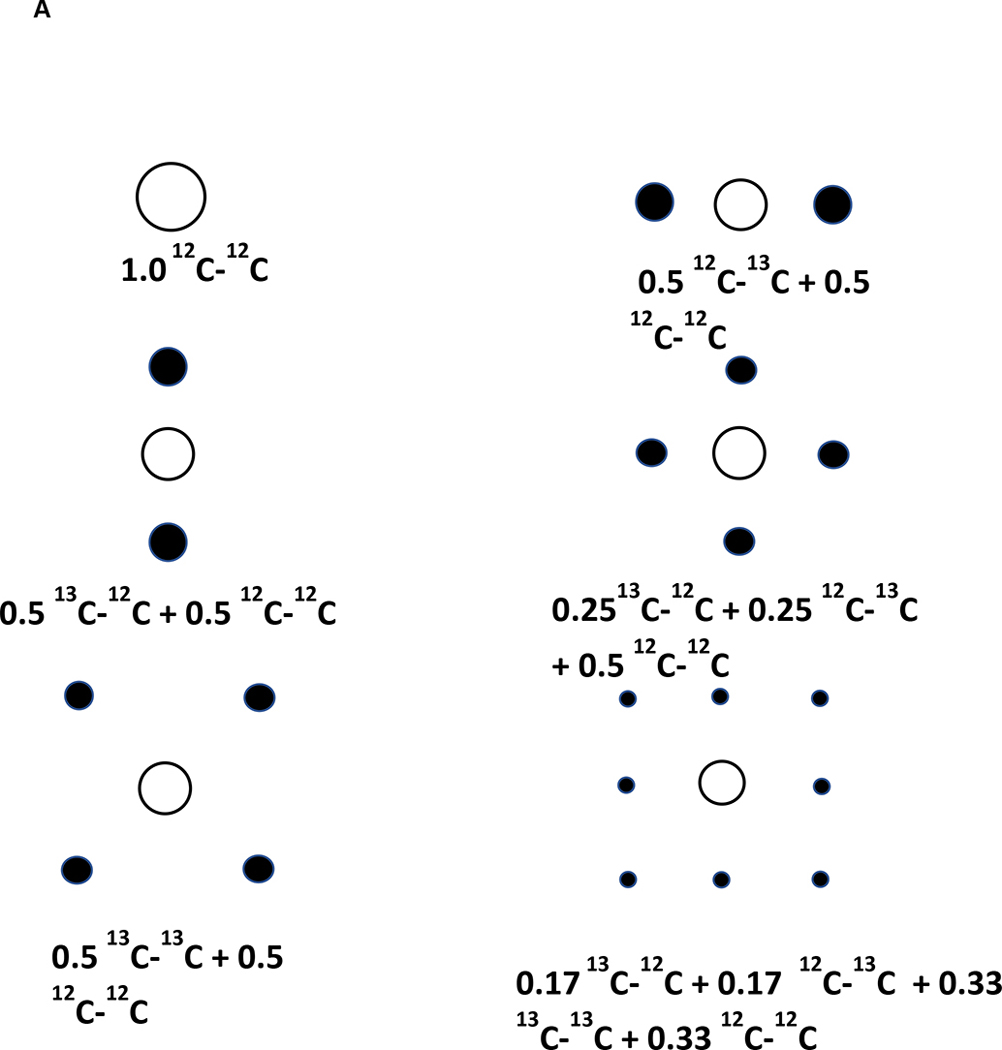
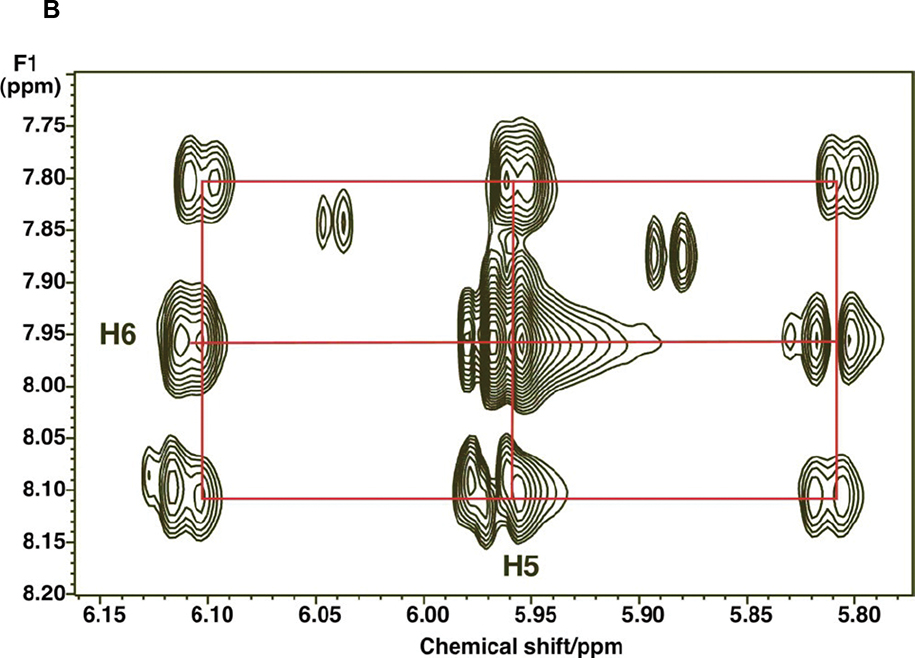
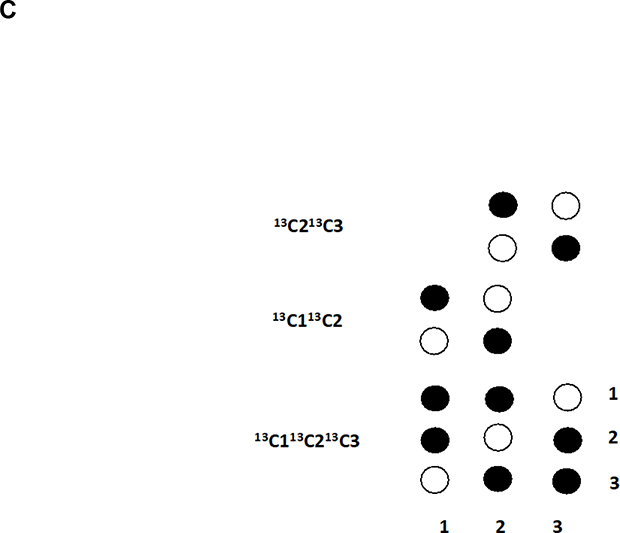
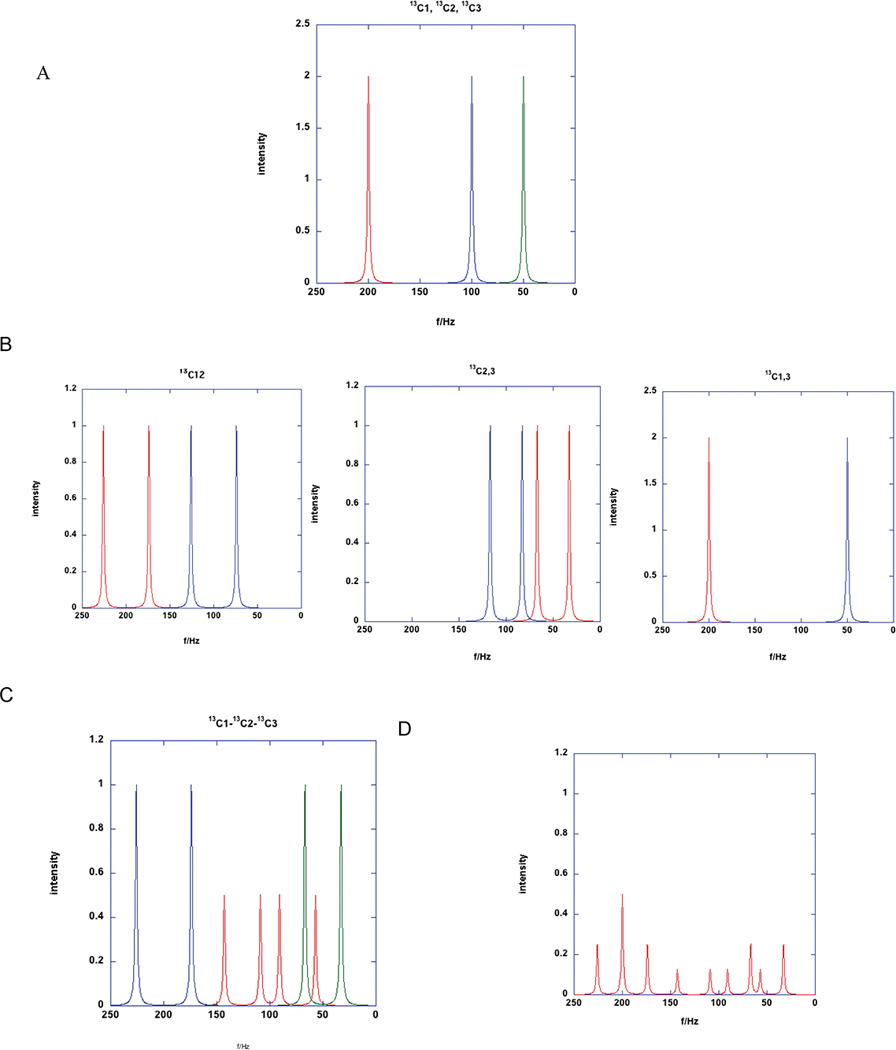
NMR is a very powerful tool for identifying and quantifying compounds within complex mixtures without the need for individual standards or chromatographic separation. Stable Isotope Resolved Metabolomics (or SIRM) is an approach to following the fate of individual atoms from precursors through metabolic transformation, producing an atom-resolved metabolic fate map. However, extracts of cells or tissue give rise to very complex NMR spectra. While multidimensional NMR experiments may partially overcome the spectral overlap problem, additional tools may be needed to determine site-specific isotopomer distributions. NMR is especially powerful by virtue of its isotope editing capabilities using NMR active nuclei such as 13C, 15N, 19F and 31P to select molecules containing just these atoms in a complex mixture, and provide direct information about which atoms are present in identified compounds and their relative abundances. The isotope-editing capability of NMR can also be employed to select for those compounds that have been selectively derivatized with an NMR-active stable isotope at particular functional groups, leading to considerable spectral simplification. Here we review isotope analysis by NMR, and methods of chemoselection both for spectral simplification, and for enhanced isotopomer analysis.
Keywords: Chemoselection; Isotopomer distribution analysis; Stable isotope resolved metabolomics.
Copyright © 2022 Elsevier Inc. All rights reserved.
Conflict of interest statement
Declaration of Competing Interest The authors declare that they have no known competing financial interests or personal relationships that could have appeared to influence the work reported in this paper.
Figures
Similar articles
-
NMR-Based Stable Isotope Tracing of Cancer Metabolism.Methods Mol Biol. 2025;2855:457-504. doi: 10.1007/978-1-0716-4116-3_26. Methods Mol Biol. 2025. PMID: 39354323
-
Stable Isotope-Resolved Metabolomics by NMR.Methods Mol Biol. 2019;2037:151-168. doi: 10.1007/978-1-4939-9690-2_9. Methods Mol Biol. 2019. PMID: 31463844 Free PMC article.
-
Applications of NMR spectroscopy to systems biochemistry.Prog Nucl Magn Reson Spectrosc. 2016 Feb;92-93:18-53. doi: 10.1016/j.pnmrs.2016.01.005. Epub 2016 Feb 6. Prog Nucl Magn Reson Spectrosc. 2016. PMID: 26952191 Free PMC article. Review.
-
A novel deconvolution method for modeling UDP-N-acetyl-D-glucosamine biosynthetic pathways based on (13)C mass isotopologue profiles under non-steady-state conditions.BMC Biol. 2011 May 31;9:37. doi: 10.1186/1741-7007-9-37. BMC Biol. 2011. PMID: 21627825 Free PMC article.
-
NMR-based Stable Isotope Resolved Metabolomics in systems biochemistry.Arch Biochem Biophys. 2017 Aug 15;628:123-131. doi: 10.1016/j.abb.2017.02.009. Epub 2017 Mar 2. Arch Biochem Biophys. 2017. PMID: 28263717 Free PMC article. Review.
Cited by
-
NMR-Based Stable Isotope Tracing of Cancer Metabolism.Methods Mol Biol. 2025;2855:457-504. doi: 10.1007/978-1-0716-4116-3_26. Methods Mol Biol. 2025. PMID: 39354323
-
Stable Isotope Tracing Analysis in Cancer Research: Advancements and Challenges in Identifying Dysregulated Cancer Metabolism and Treatment Strategies.Metabolites. 2024 May 31;14(6):318. doi: 10.3390/metabo14060318. Metabolites. 2024. PMID: 38921453 Free PMC article. Review.
-
Challenges of Spatially Resolved Metabolism in Cancer Research.Metabolites. 2024 Jul 11;14(7):383. doi: 10.3390/metabo14070383. Metabolites. 2024. PMID: 39057706 Free PMC article. Review.
References
-
- Chong M, Jayaraman A, Marin S, Selivanov V, de Atauri Carulla PR, Tennant DA, Cascante M, Günther UL and Ludwig C (2017) Combined Analysis of NMR and MS Spectra (CANMS). Angew Chem Int Ed Engl, 56, 4140–4144. - PubMed
Publication types
MeSH terms
Substances
Grants and funding
LinkOut - more resources
Full Text Sources
Medical
