. 2022 Oct 15:173:105831.
doi: 10.1016/j.nbd.2022.105831. Epub 2022 Jul 28.

Loss of mitochondrial enzyme GPT2 causes early neurodegeneration in locus coeruleus

Affiliations

Loss of mitochondrial enzyme GPT2 causes early neurodegeneration in locus coeruleus

Ozan Baytas et al. Neurobiol Dis. .

Abstract

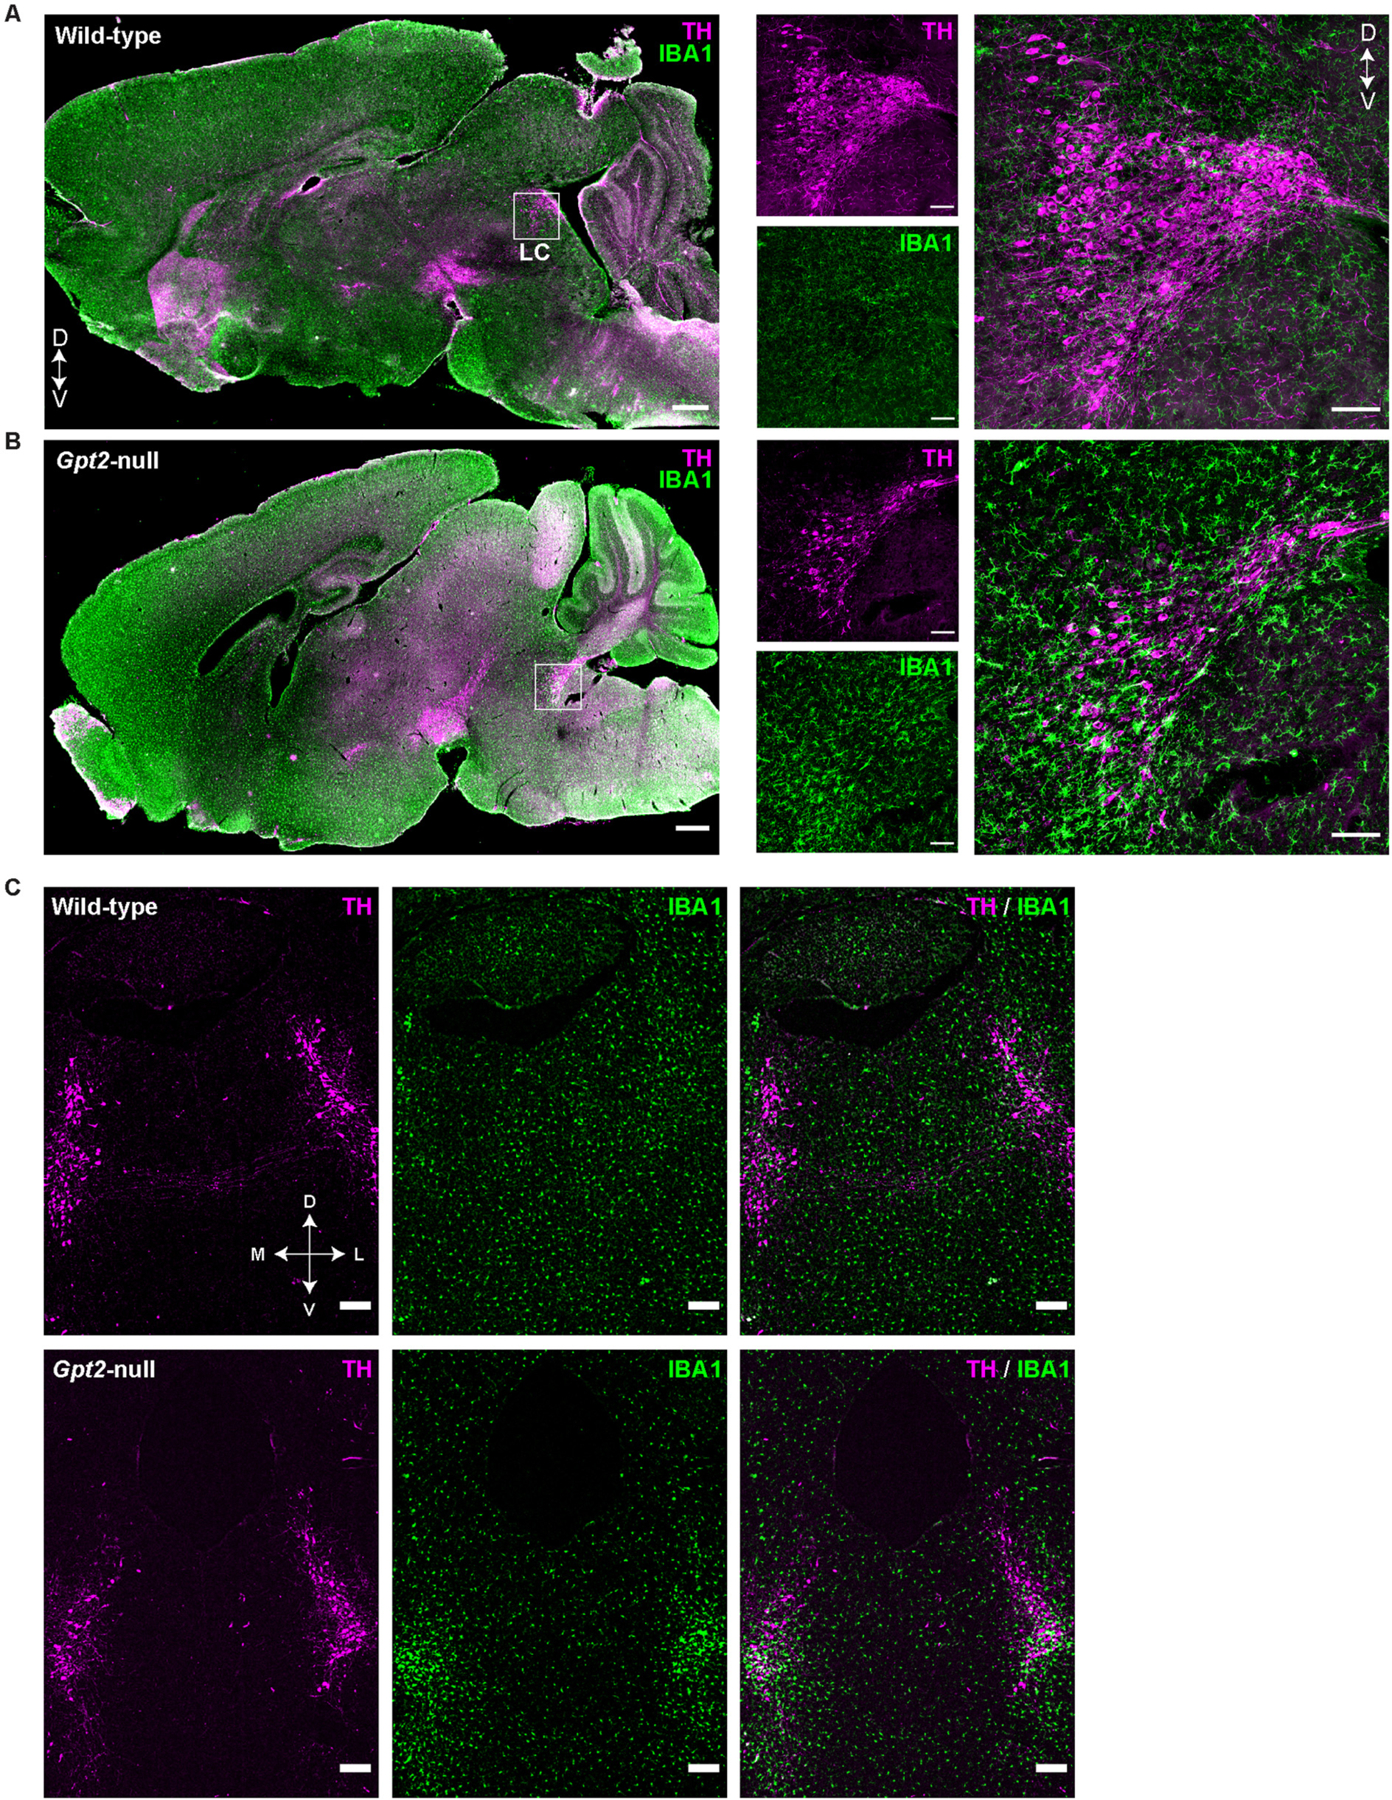
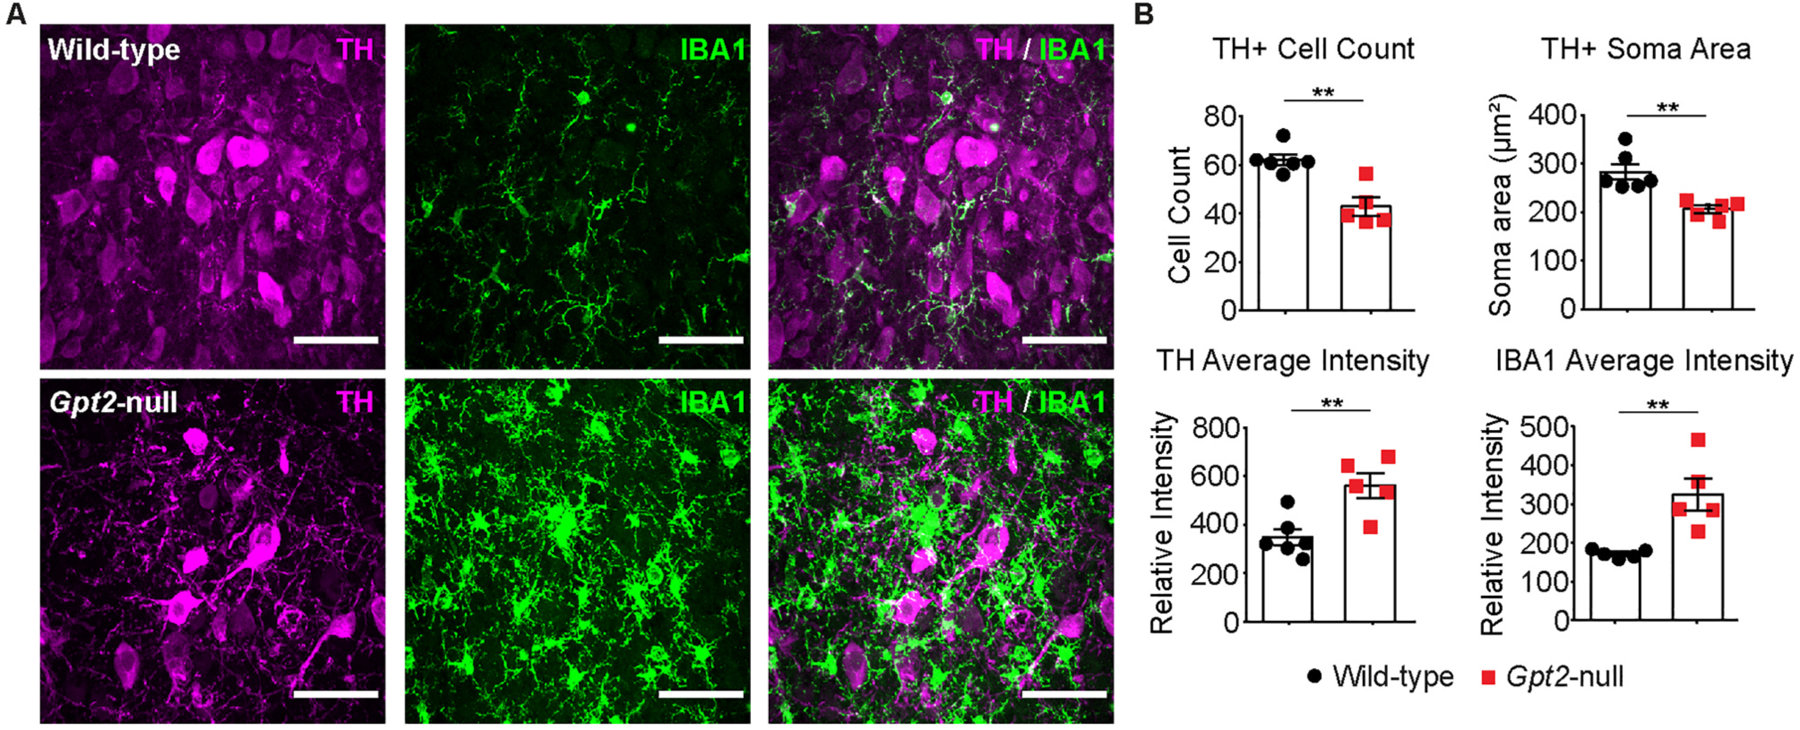
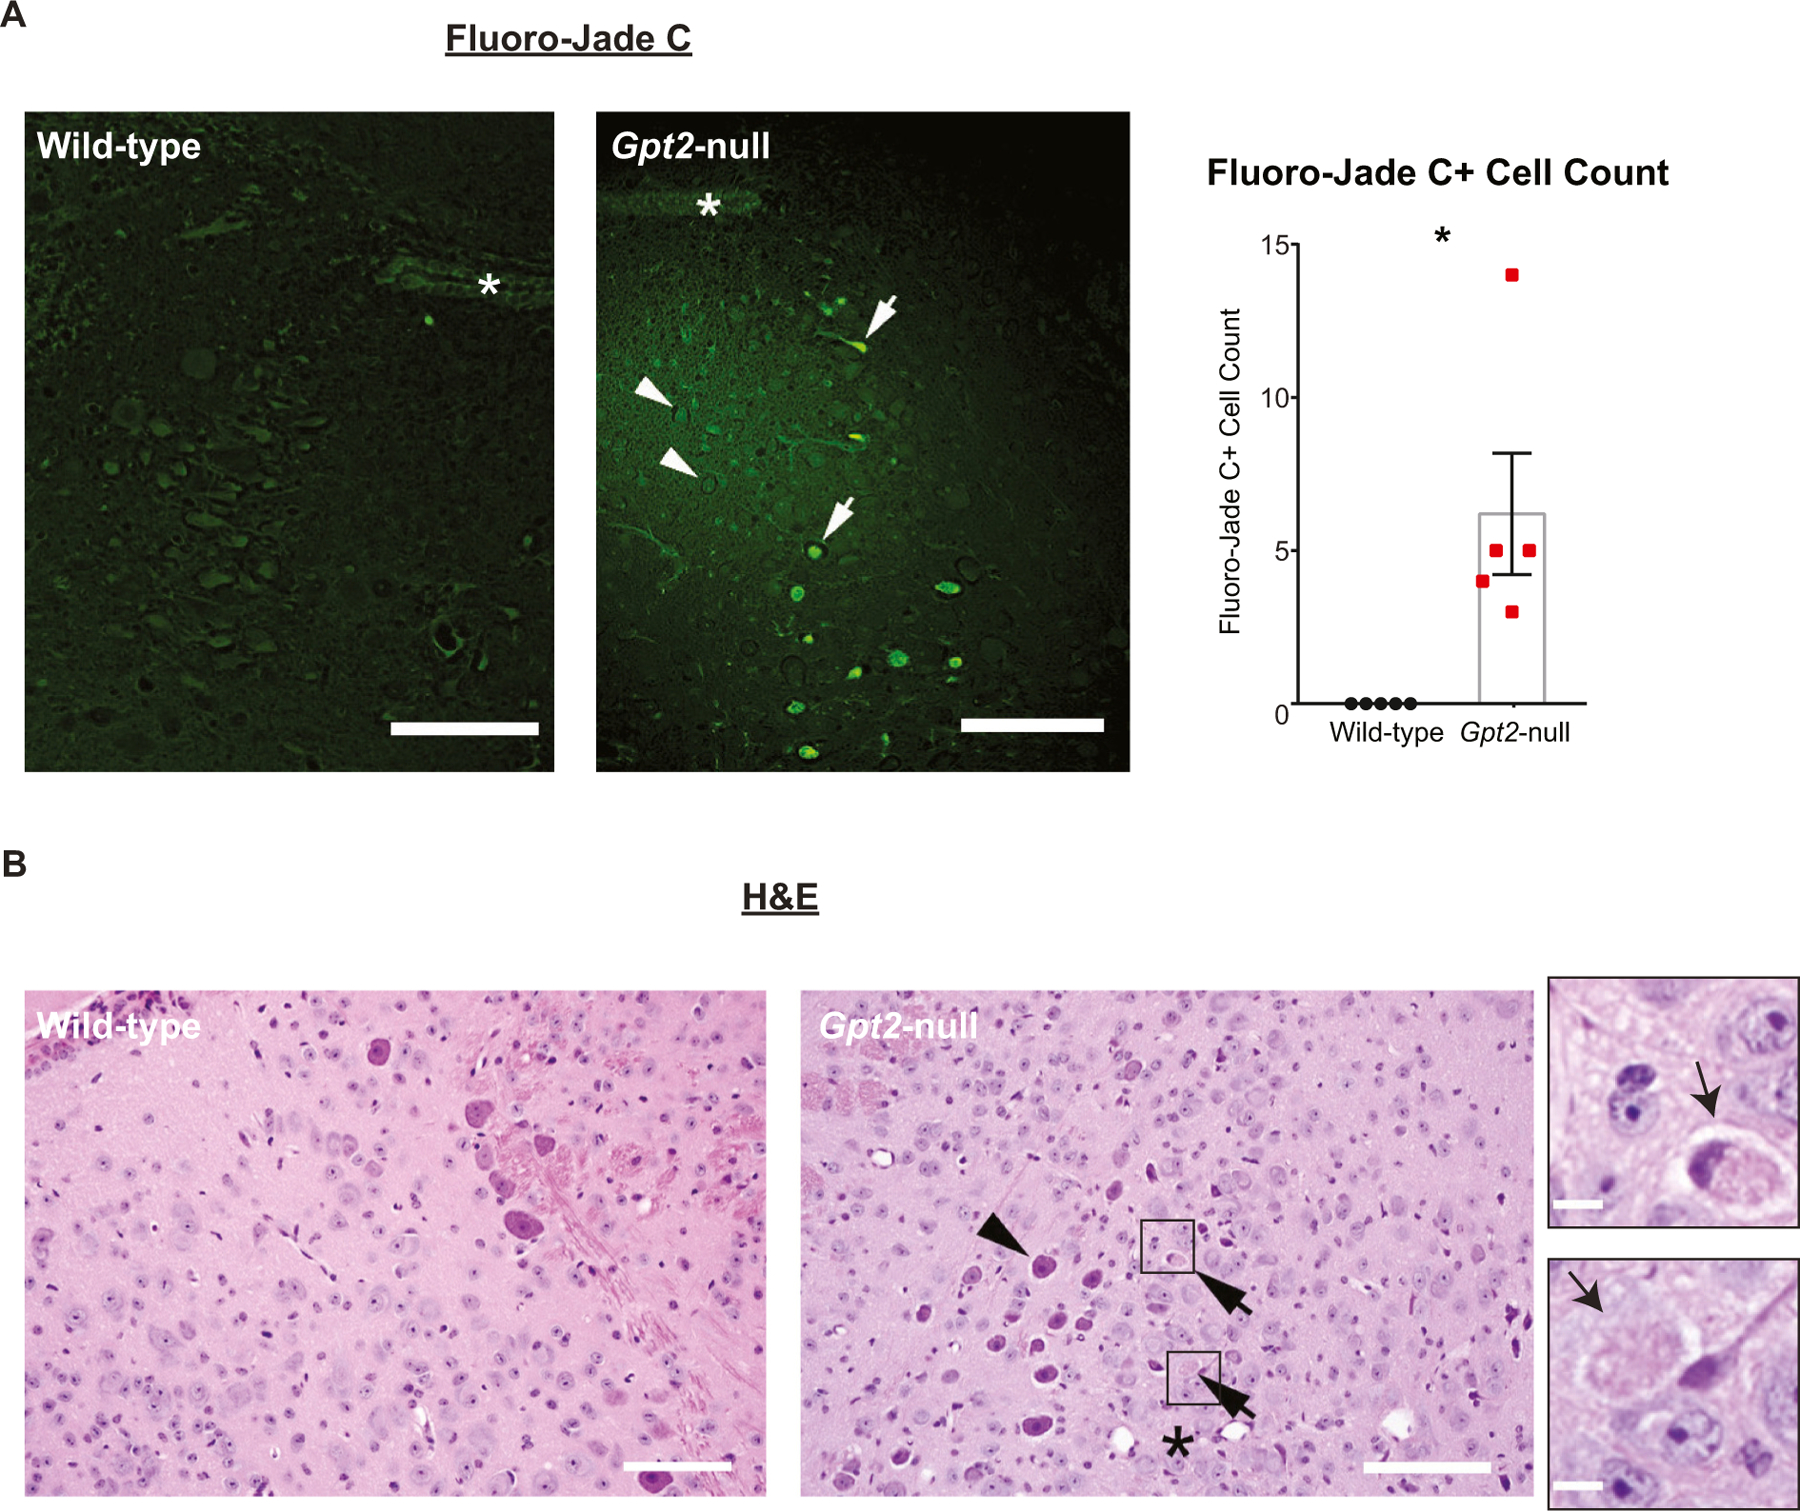
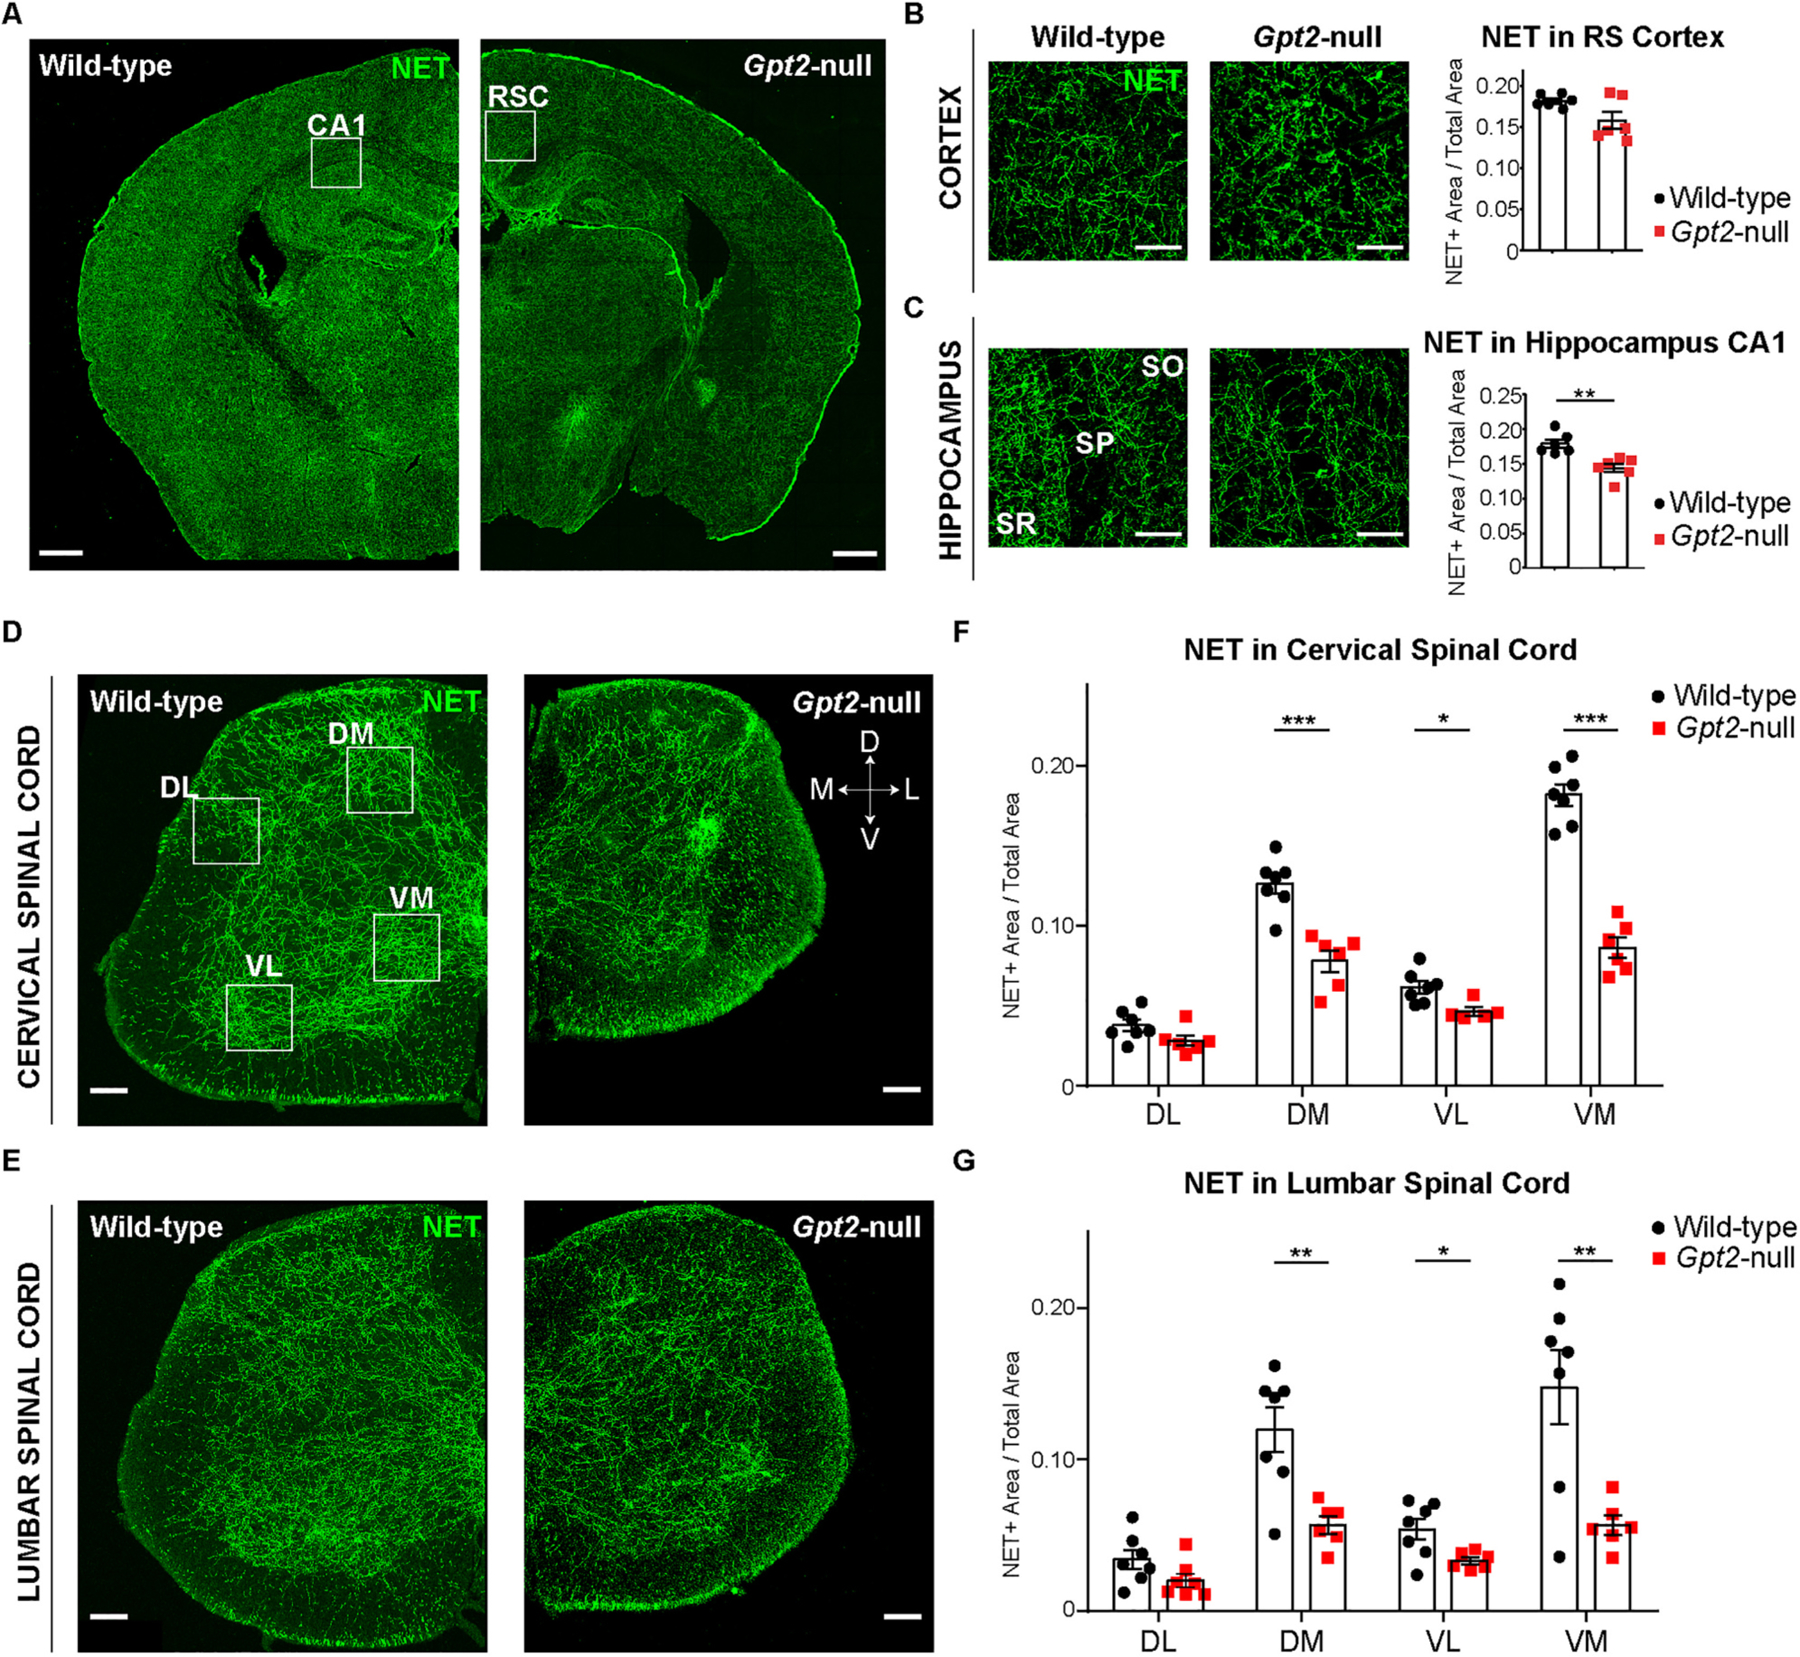
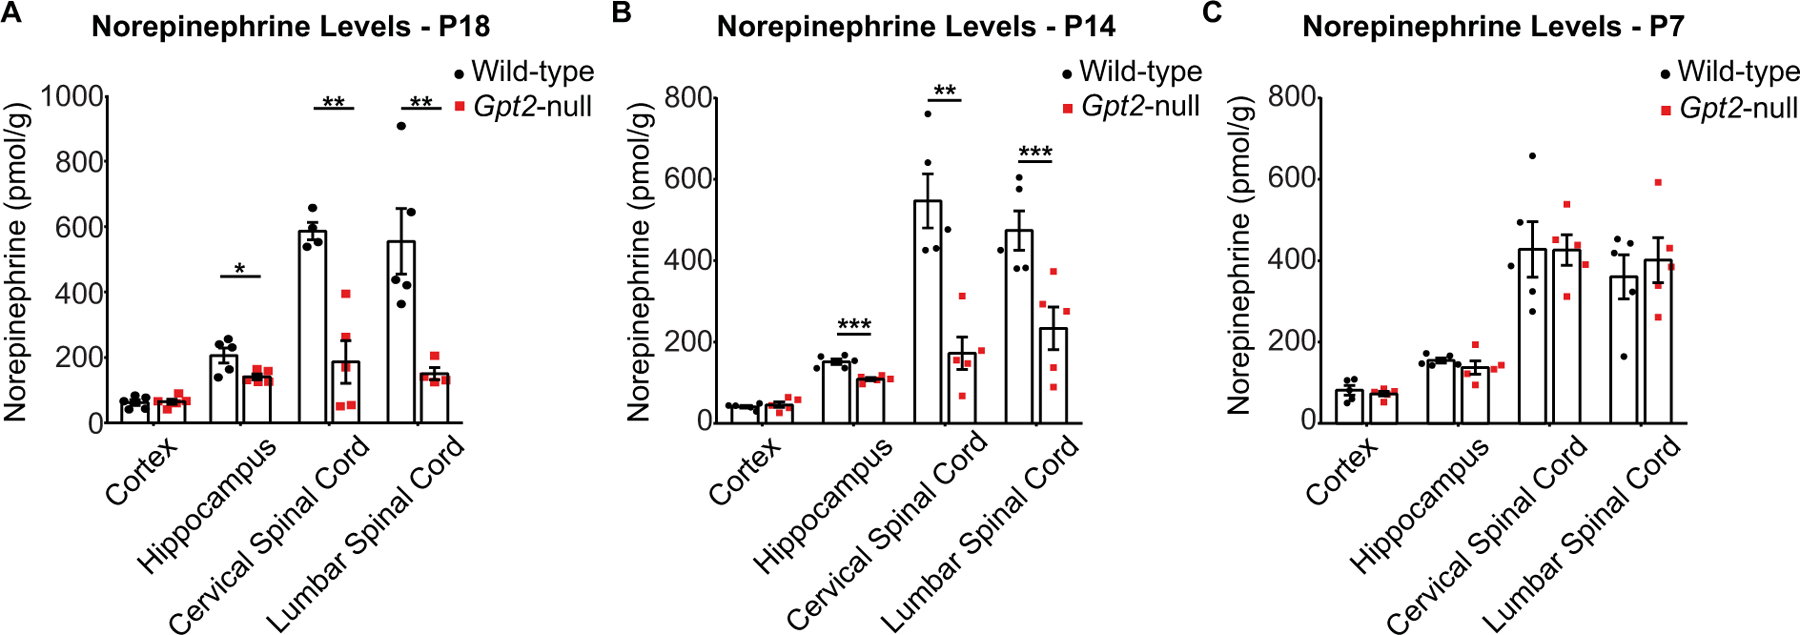
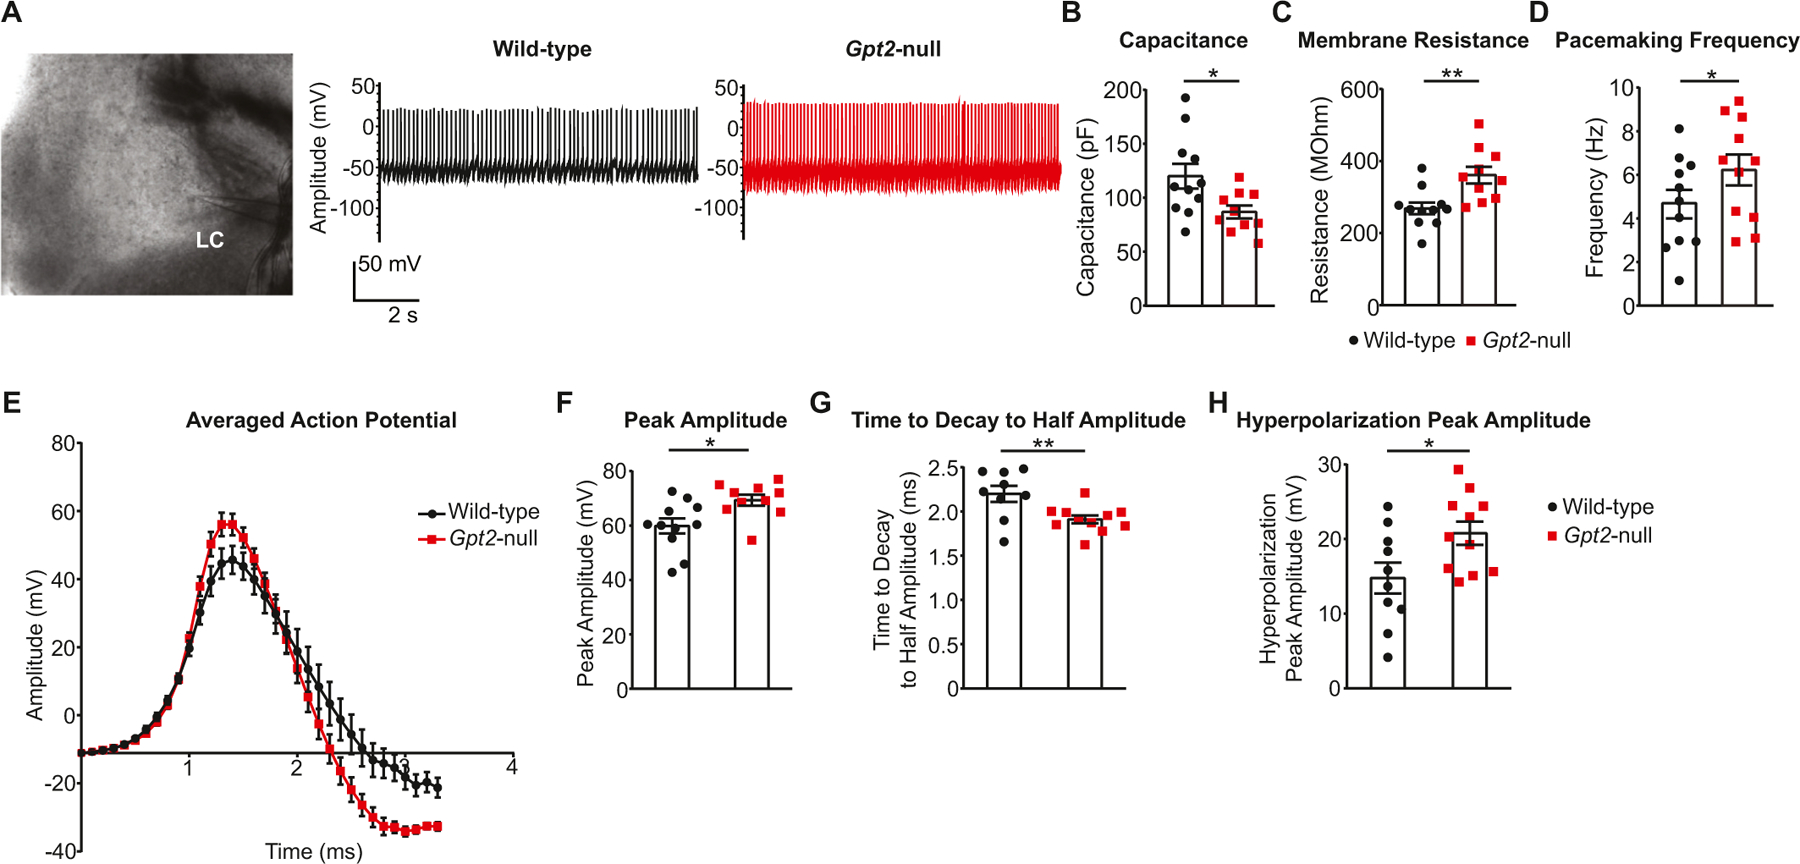
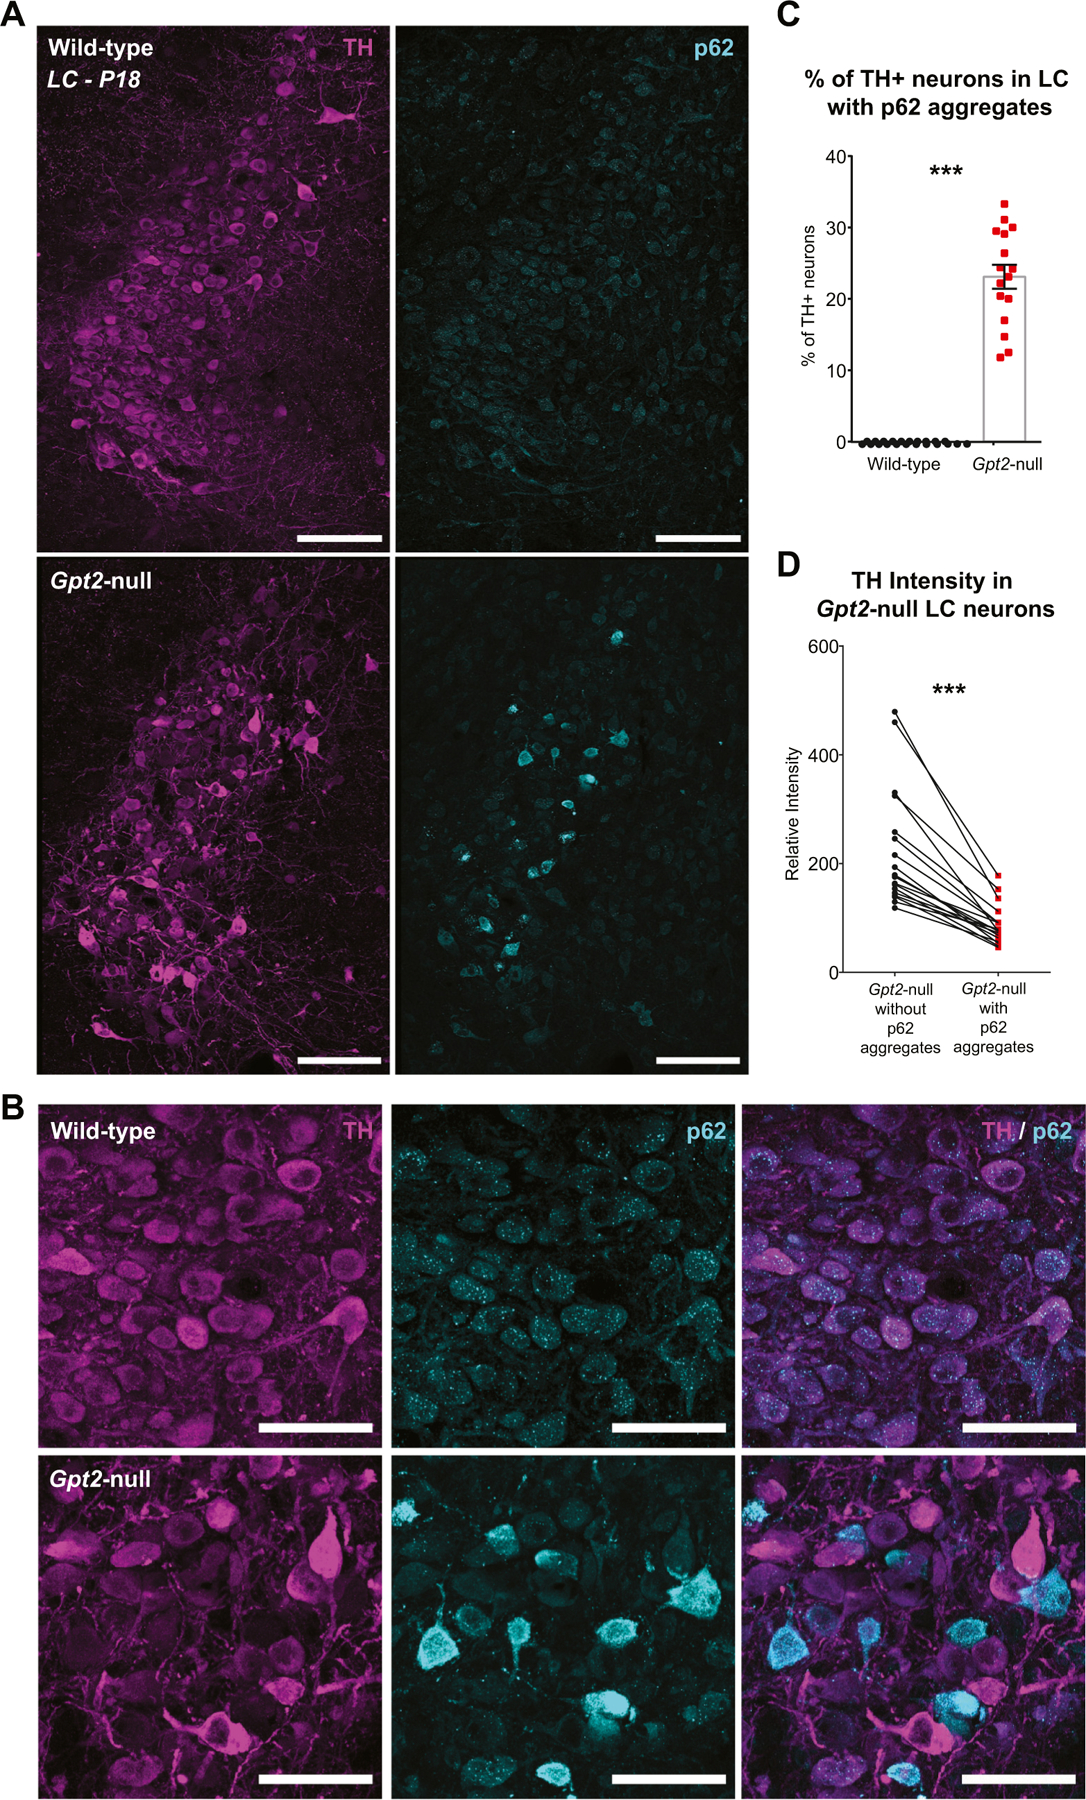
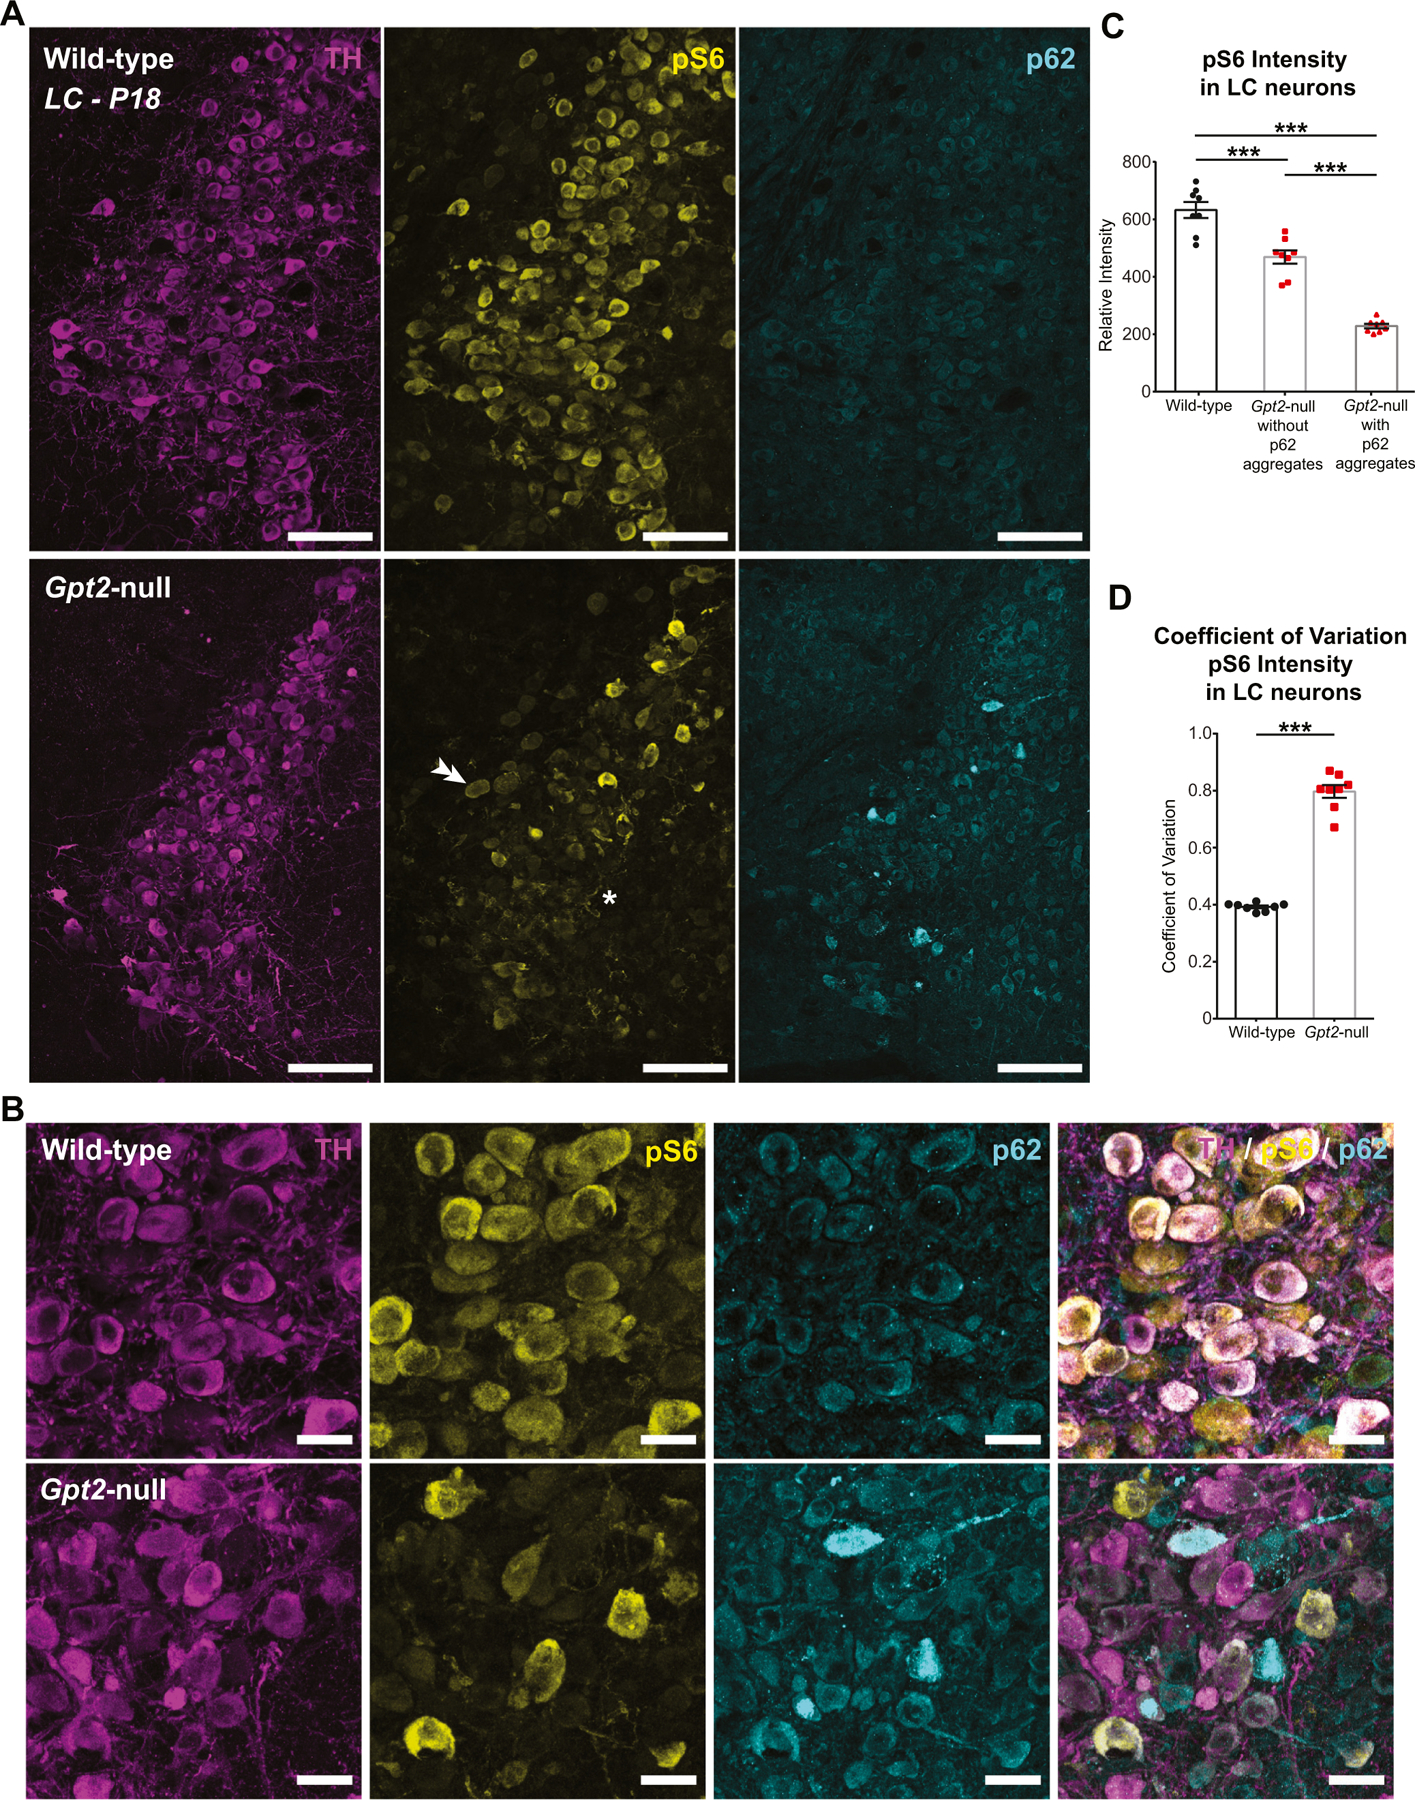
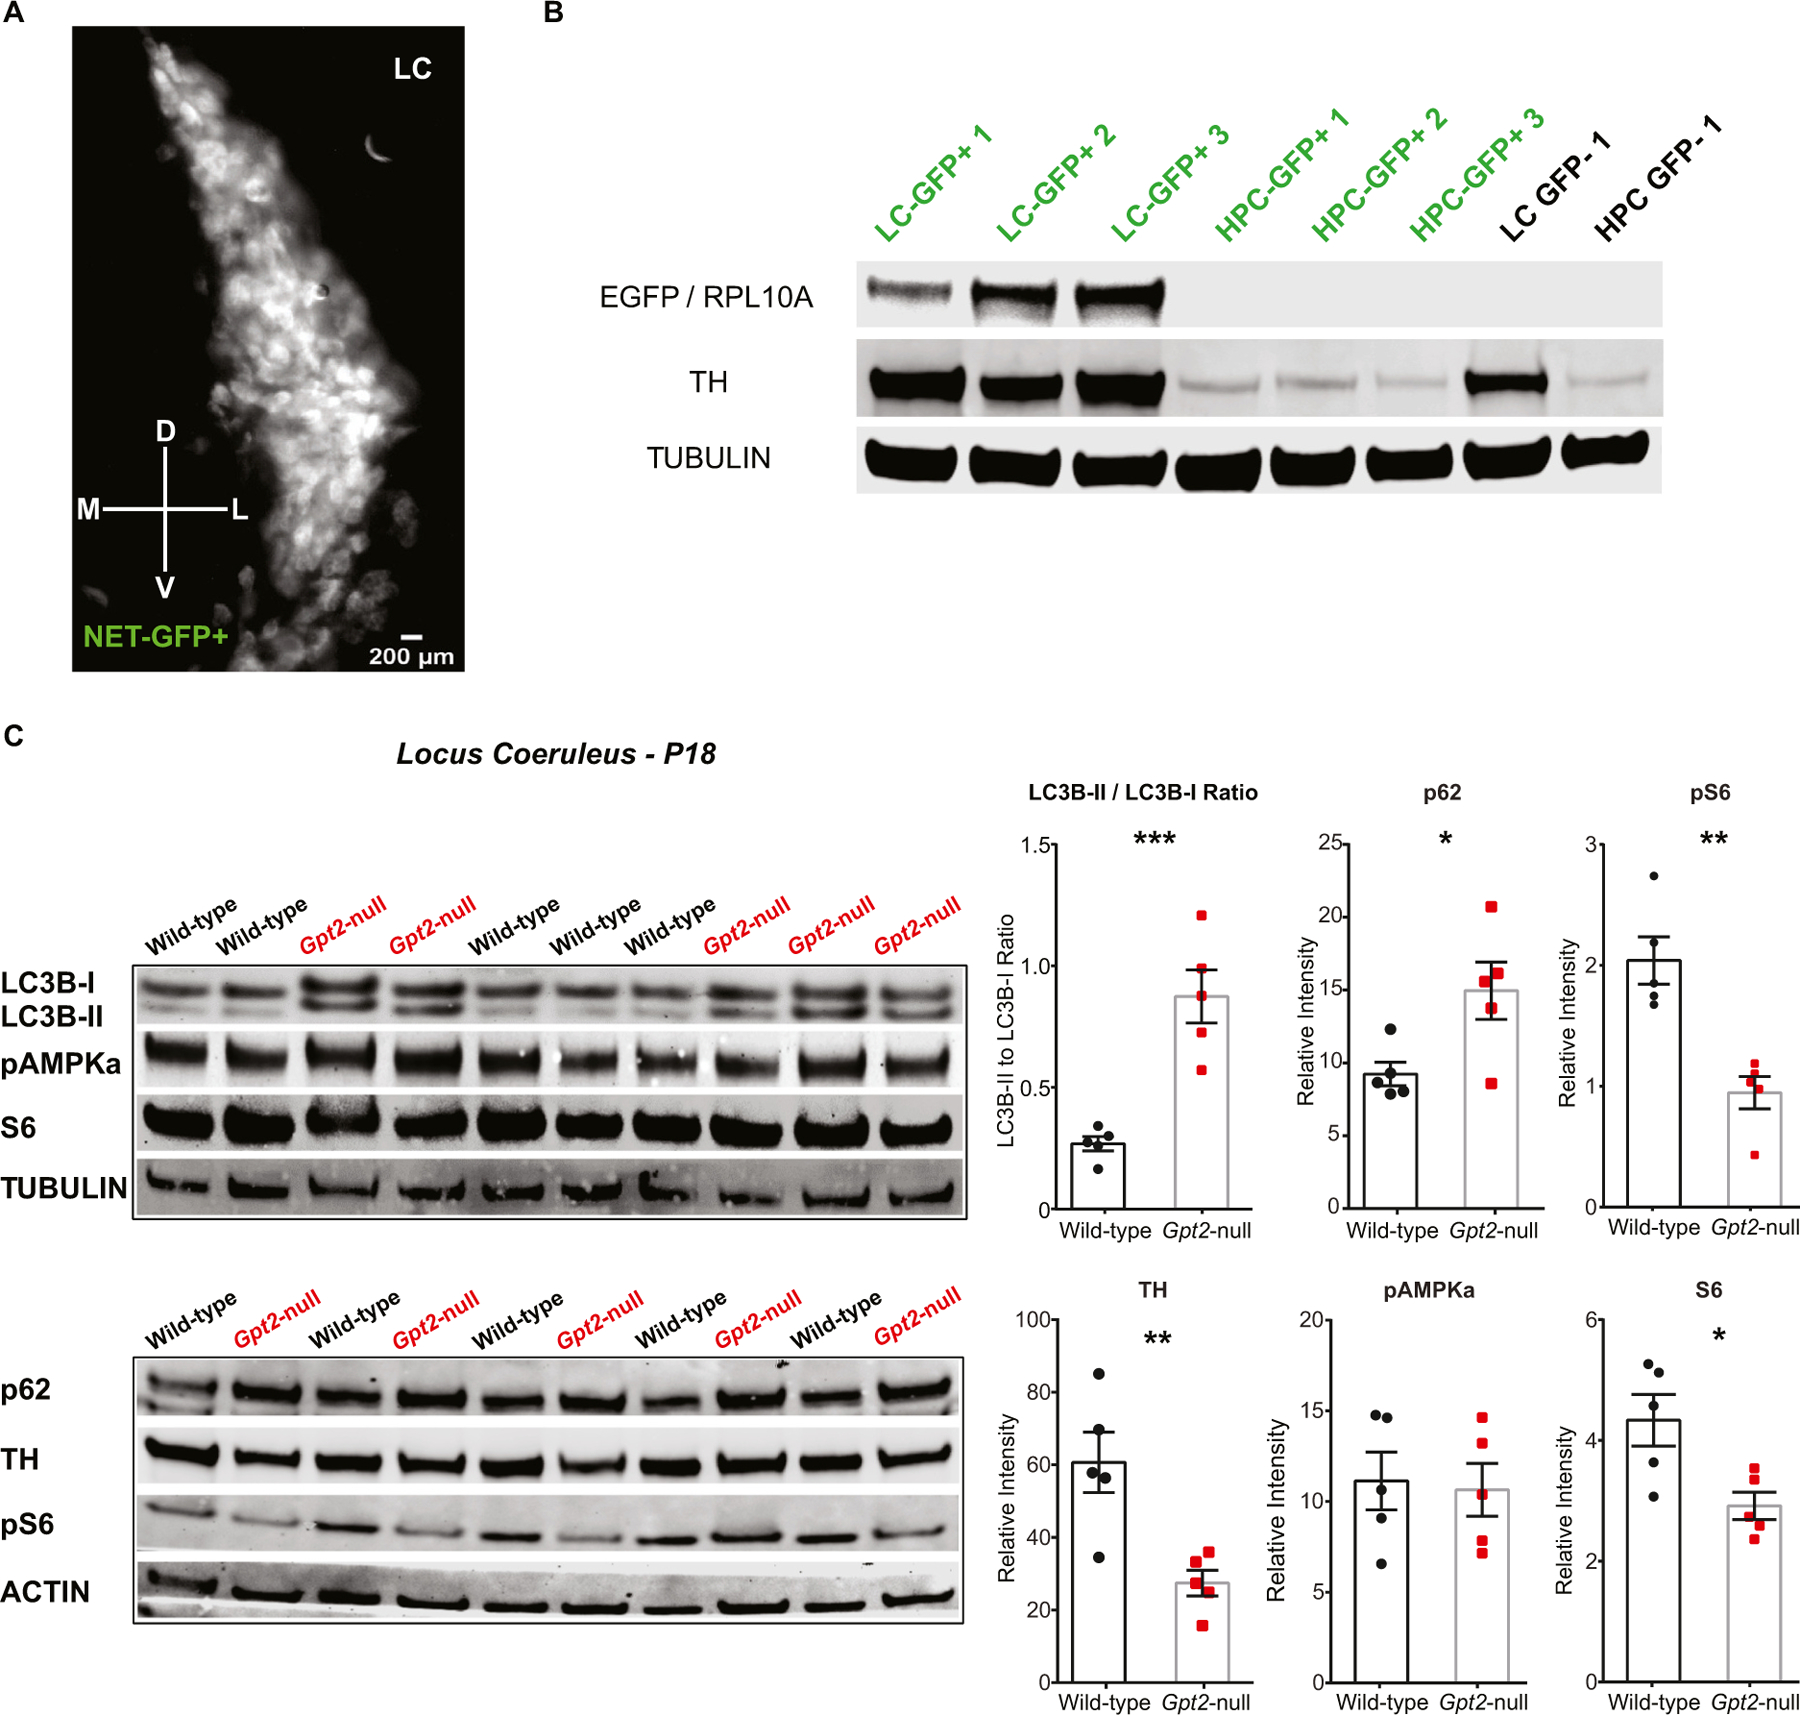
Locus coeruleus (LC) is among the first brain areas to degenerate in Alzheimer's disease and Parkinson's disease; however, the underlying causes for the vulnerability of LC neurons are not well defined. Here we report a novel mechanism of degeneration of LC neurons caused by loss of the mitochondrial enzyme glutamate pyruvate transaminase 2 (GPT2). GPT2 Deficiency is a newly-recognized childhood neurometabolic disorder. The GPT2 enzyme regulates cell growth through replenishment of tricarboxylic acid (TCA) cycle intermediates and modulation of amino acid metabolism. In Gpt2-null mice, we observe an early loss of tyrosine hydroxylase (TH)-positive neurons in LC and reduced soma size at postnatal day 18. Gpt2-null LC shows selective positive Fluoro-Jade C staining. Neuron loss is accompanied by selective, prominent microgliosis and astrogliosis in LC. We observe reduced noradrenergic projections to and norepinephrine levels in hippocampus and spinal cord. Whole cell recordings in Gpt2-null LC slices show reduced soma size and abnormal action potentials with altered firing kinetics. Strikingly, we observe early decreases in phosphorylated S6 in Gpt2-null LC, preceding prominent p62 aggregation, increased LC3B-II to LC3B-I ratio, and neuronal loss. These data are consistent with a possible mechanism involving deficiency in protein synthesis and cell growth, associated subsequently with abnormal autophagy and neurodegeneration. As compared to the few genetic animal models with LC degeneration, loss of LC neurons in Gpt2-null mice is developmentally the earliest. Early neuron loss in LC in a model of human neurometabolic disease provides important clues regarding the metabolic vulnerability of LC and may lead to new therapeutic targets.

Keywords: Autophagy; GPT2; Locus coeruleus; Neurodegeneration; Neurogenetics; Neurometabolism; Proteostasis; Selective vulnerability.


Conflict of interest statement

Declaration of Competing Interest The authors declare no competing interests.

Figures

Fig. 1.
Fig. 1.. GPT2 Deficiency leads to selective gliosis in locus coeruleus.
Selective microgliosis in Gpt2-null LC in sagittal brain sections at P18. Images of tyrosine hydroxylase (TH, magenta), IBA1 (green) staining in wild-type (A) and Gpt2-null (B) sagittal sections. D: Dorsal V: Ventral. Low magnification images taken with a 2× objective are shown on the left, (scale bar: 500 μm), high magnification images taken with a 60× objective are on the right (scale bar: 100 μm). C. Selective microgliosis in Gpt2-null LC in coronal brain sections at P18. Images of tyrosine hydroxylase (TH, magenta), IBA1 (green) staining in wild-type and Gpt2-null coronal sections containing LC. D: Dorsal, V: Ventral, M: Medial, L: Lateral. Scale bar: 200 μm.
Fig. 2.
Fig. 2.. Smaller TH+ neurons and loss of TH+ neurons in Gpt2-null LC at P18.
A. High magnification images of microgliosis in Gpt2-null ventral LC at P18. Tyrosine hydroxylase (TH, magenta) and IBA1 (green) staining in wild-type and Gpt2-null LC. Scale bar: 50 μm. B. Quantification of TH+ cell count, TH+ soma area, TH average relative fluorescence intensity and IBA1 average relative fluorescence intensity. Each dot represents the average of staining in 3 sections per animal (wild-type: black, n = 5; Gpt2-null: red, n = 5 mice). The statistical test for comparisons of two groups was unpaired two-tailed Student t-test. **0.001 < P < 0.01.
Fig. 3.
Fig. 3.. Degeneration of neurons in Gpt2-null LC.
A. Fluoro-Jade C staining in wildtype and Gpt2-null LC at P18. Arrows point to degenerating cells and arrowheads point to normal cells. The asterisk denotes the 4th ventricle. Quantification of Fluoro-Jade C+ cells is given on the right. Each dot represents the average of counts in 2–3 sections per animal (wild-type: black, n = 5; Gpt2-null: red, n = 5 mice). *0.01 < P < 0.05. Scale bar: 100 μm. B. Eosinophilic and necrotic neurons are present in Gpt2-null LC at P18. Images of hematoxylin and eosin (H&E) staining in wild-type and Gpt2-null LC (Scale bar: 100 μm). The top arrow points to a necrotic neuron and the bottom arrow points to a hypereosinophilic neuron in Gpt2-null LC, both visualized with higher magnification on the right (Scale bar: 5 μm). The arrowhead points to a healthy neuron of the motor nucleus of the trigeminal nerve bordering the LC laterally. The asterisk denotes the LC.
Fig. 4.
Fig. 4.. Noradrenergic innervation in hippocampus and spinal cord is reduced in Gpt2-null mice.
A. Noradrenergic innervation in hippocampus of Gpt2-null mice at P18 is reduced. Images of norepinephrine transporter (NET, green) staining in coronal sections containing hippocampus of wild-type and Gpt2-null mice (scale bar: 500 μm). The white boxes indicate example areas of CA1 of hippocampus and retrospenial cortex (RSC) where the staining was quantified. B. Representative images of higher magnification for RSC and quantification of NET staining as a fraction of the total field of view. Each dot represents the average of staining in 2–3 sections per animal (wild-type: black, n = 6; Gpt2-null: red, n = 6 mice). Decrease in RSC demonstrates a statistical trend (two-tailed Student’s t-test, P = 0.0553). The statistical test for comparisons of two groups was unpaired two-tailed Student t-test. Scale bar: 100 μm. C. Representative images of higher magnification for CA1 hippocampus and quantification of NET staining as a fraction of the total field of view. Each dot represents the average of staining in 2–3 sections per animal (wild-type: black, n = 6; Gpt2-null: red, n = 6 mice). SR: stratum radiatum, SP: stratum pyramidale, SO: stratum oriens. Scale bar: 100 μm. The statistical test for comparisons of two groups was unpaired two-tailed Student t-test. **0.001 < P < 0.01. D. Images of norepinephrine transporter (NET, green) staining in coronal sections of cervical spinal cord of wild-type and Gpt2-null mice at P18. Each dot represents the average of staining in 3 sections per animal (wild-type: black, n = 7; Gpt2-null: red, n = 6 mice). The white boxes indicate example areas where the staining was quantified for cervical spinal cord and lumbar spinal cord (DL: dorsolateral, DM: dorsomedial, VL: ventrolateral, VM: ventromedial). Scale bar: 200 μm. E. Images of NET (green) staining in coronal sections of lumbar spinal cord of wild-type and Gpt2-null mice at P18. Scale bar: 200 μm. F. Quantification of NET staining in cervical spinal cord as a fraction of the total field of view. Each dot represents the average of staining in 3 sections per animal (wild-type: black, n = 7; Gpt2-null: red, n = 6 mice). The statistical test for comparisons of two groups was unpaired two-tailed Student t-test. Two-way ANOVA was performed to determine statistical effects of region and genotype (interaction: F (3,43) = 27.67, P < 0.0001; region factor: F (3,43) = 149.6, P < 0.0001; genotype factor: F (3,43) = 124.1, P < 0.0001). *0.01 < P < 0.05; ***P < 0.001. G. Quantification of NET staining in lumbar spinal cord as a fraction of the total field of view. Each dot represents the average of staining in 3 sections per animal (wild-type: black, n = 7; Gpt2-null: red, n = 6 mice). The statistical test for comparisons of two groups was unpaired two-tailed Student t-test. Two-way ANOVA was performed to determine statistical effects of region and genotype (interaction: F (3,45) = 4.8, P = 0.0056; region factor: F (3,45) = 18.4, P < 0.0001; genotype factor: F (1,45) = 31.8, P < 0.0001). *0.01 < P < 0.05; **0.001 < P < 0.01; ***P < 0.001.
Fig. 5.
Fig. 5.. Norepinephrine levels in hippocampus and spinal cord of Gpt2-null mice are reduced at P18 and P14 but unchanged at P7.
A. Quantification of norepinephrine levels per wet weight of tissue (pmol/g) in cortex, hippocampus, cervical and lumbar spinal cord of wild-type and Gpt2-null mice at P18 as detected by enzyme-linked immunosorbent assay (ELISA). Each dot represents the average of duplicates of a tissue sample from one animal (wild-type: black, n = 5; Gpt2-null: red, n = 5 mice). The statistical test for comparisons of two groups was unpaired two-tailed Student t-test. Two-way ANOVA was performed to determine statistical effects of region and genotype (interaction: F (3,30) = 10.50, P < 0.0001; region factor: F (3,30) = 20.98, P < 0.0001; genotype factor: F (1,30) = 42.24, P < 0.0001). *0.01 < P < 0.05; **0.001 < P < 0.01. B. Quantification of norepinephrine levels per wet weight of tissue (pmol/g) in cortex, hippocampus, cervical and lumbar spinal cord of wild-type and Gpt2-null mice at P14. Each dot represents the average of duplicates of a tissue sample from one animal (wild-type: black, n = 5; Gpt2-null: red, n = 5 mice). The statistical test for comparisons of two groups was unpaired two-tailed Student t-test. Two-way ANOVA was performed to determine statistical effects of region and genotype (interaction: F (3,32) = 11.13, P < 0.0001; region factor: F (3,32) = 36.52, P < 0.0001; genotype factor: F (1,32) = 38.05, P < 0.0001). *0.01 < P < 0.05; **0.001 < P < 0.01. C. Quantification of norepinephrine levels per wet weight of tissue (pmol/g) in cortex, hippocampus, cervical and lumbar spinal cord of wild-type and Gpt2-null mice at P7. Each dot represents the average of duplicates of a tissue sample from one animal (wild-type: black, n = 5; Gpt2-null: red, n = 5 mice). The statistical test for comparisons of two groups was unpaired two-tailed Student t-test. Two-way ANOVA was performed to determine statistical effects of region and genotype (interaction: F (3,32) = 0.22, P = 0.88; region factor: F (3,32) = 37.91, P < 0.0001; genotype factor: F (1,32) = 0.01, P = 0.90). *0.01 < P < 0.05; **0.001 < P < 0.01.
Fig. 6.
Fig. 6.. Electrophysiological characterization of LC in Gpt2-null mice reveals changes in intrinsic cell properties and action potential parameters.
A. Representative image of LC with a patch pipette (left) and representative traces of recordings in LC neurons of wild-type (black) and Gpt2-null (red) mice at P18. B. Capacitance of Gpt2-null LC neurons at P18 is reduced. Each dot represents a different cell (wild-type: black, n = 11 cells, n = 4 mice; Gpt2-null: red, n = 10 cells, n = 4 mice). The statistical test for comparisons of two groups was unpaired two-tailed Student t-test. *0.01 < P < 0.05. C. Membrane resistance of Gpt2-null LC neurons at P18 is increased. Each dot represents a different cell (wild-type: black, n = 11 cells, n = 4 mice; Gpt2-null: red, n = 10 cells, n = 4 mice). The statistical test for comparisons of two groups was unpaired two-tailed Student t-test. ***0.001 < P < 0.01. D. Pacemaking frequency of Gpt2-null LC neurons at P18 is slightly increased. Each dot represents a different cell (wild-type: black, n = 11 cells, n = 4 mice; Gpt2-null: red, n = 11 cells, n = 4 mice). Mixed model analysis was employed here with fixed effects: genotype, presence of hyperpolarization in resting membrane potential toward the end of recording and whether the pacemaking activity was retained throughout the recording, random effects: day of recording. *P = 0.0318. E. Shape of the averaged action potential from the pacemaking activity of wild-type (black, n = 11 cells, n = 4 mice) and Gpt2-null (red, n = 11 cells, n = 4 mice) LC neurons at P18. F. Peak amplitude of Gpt2-null LC neuron action potential at P18 is increased. Each dot represents a different cell (wild-type: black, n = 11 cells, n = 4 mice; Gpt2-null: red, n = 10 cells, n = 4 mice). The statistical test for comparisons of two groups was unpaired two-tailed Student t-test. *0.01 < P < 0.05. G. Time to decay to half amplitude of Gpt2-null LC neuron action potential at P18 is decreased. Each dot represents a different cell (wild-type: black, n = 9 cells, n = 4 mice; Gpt2-null: red, n = 11 cells, n = 4 mice). The statistical test for comparisons of two groups was unpaired two-tailed Student t-test. **0.001 < P < 0.01. H. Hyperpolarization peak amplitude of Gpt2-null LC neuron action potential at P18 is increased. Each dot represents a different cell (wild-type: black, n = 10 cells, n = 4 mice; Gpt2-null: red, n = 11 cells, n = 4 mice). The statistical test for comparisons of two groups was unpaired two-tailed Student t-test. *0.01 < P < 0.05.
Fig. 7.
Fig. 7.. p62 aggregates in Gpt2-null LC.
A. Representative images of TH (magenta) and p62 (cyan) staining in wild-type and Gpt2-null LC at P18. Scale bar: 100 μm. B. Higher magnification images of tissue sections provided in (A) showing TH (magenta) and p62 (cyan) staining in wild-type and Gpt2-null LC at P18. Note that the TH intensity is lower in Gpt2-null LC neurons with p62 aggregates and the remaining Gpt2-null LC neurons without p62 aggregates may have increased TH intensity. Scale bar: 50 μm. C. Approximately 20% of TH+ neurons have p62 aggregates in Gpt2-null LC. Each dot represents a different coronal section of LC (wild-type: black, n = 18 sections, n = 7 mice; Gpt2-null: red, n = 16 sections, n = 7 mice). The statistical test for comparisons of two groups was unpaired two-tailed Student t-test. ***P < 0.0001. D. TH intensity is reduced in Gpt2-null LC neurons with p62 aggregates. Each dot represents a different coronal section of LC (n = 16 sections, n = 7 mice). The statistical test for comparisons of two groups was paired Student t-test.
Fig. 8.
Fig. 8.. Reduced levels of phosphorylated ribosomal protein S6 (pS6) in Gpt2-null LC.
A. Representative images of TH (magenta), pS6 (yellow) and p62 (cyan) in wild-type and Gpt2-null LC at P18. Note the very dim pS6 intensity across the Gpt2-null LC (asterisk) and normal pS6 intensity in motor nucleus of the trigeminal nerve (double arrowheads). B. Higher magnification images of tissue sections provided in (A) showing TH (magenta), pS6 (yellow) and p62 (cyan) staining in wild-type and Gpt2-null LC at P18. Note that the Gpt2-null LC neurons with p62 aggregates have little to no pS6 signal. C. Overall pS6 intensity is reduced in Gpt2-null LC neurons and further reduced in neurons with p62 aggregates. Each dot represents a different coronal section of LC (wild-type: black, n = 8 sections, n = 4 mice; Gpt2-null: red, n = 8 sections, n = 4 mice). The statistical test for comparisons of two groups was unpaired two-tailed Student t-test. ***P < 0.001. D. pS6 intensity is differentially affected across TH+ neurons in Gpt2-null LC at P18 as quantified by coefficient of variation of intensities. Each dot represents a different coronal section of LC (wild-type: black, n = 8 sections, n = 4 mice; Gpt2-null: red, n = 8 sections, n = 4 mice). The statistical test for comparisons of two groups was unpaired two-tailed Student t-test. ***P < 0.001.
Fig. 9.
Fig. 9.. Increased ratio of LC3B-II to LC3B-I protein levels in Gpt2-null LC.
A. Validation of the use of NET-GFP (EGFP fused to the ribosomal protein RPL10A that is expressed under the promoter of norepinephrine transporter, Slc6a2). A representative image of neurons with EGFP in LC at P18, taken using an inverted epifluorescent microscope. Scale bar: 200 μm. B. TH and EGFP in LC tissue samples of NET-GFP+ mice as determined by western blotting, indicating that the GFP marker assists with efforts to enrich for TH+ LC cells relative to the dissection without GFP (GFP-). Each lane represents a protein lysate sample obtained from a different mouse. Note that the EGFP / RPL10A protein is absent in the hippocampus (HPC) of NET-GFP+ mice as well as in LC and HPC samples of an animal without the NET-GFP transgene (GFP-). Tubulin was used as loading control. There is a relative enrichment of TH+ tissue in the GFP+ as compared to GFP-dissections. C. Increased LC3B-II to LC3B-I ratio, increased p62 and decreased pS6 protein levels in Gpt2-null LC at P18. Each lane represents a protein lysate sample obtained from a different mouse and each protein level was normalized either to tubulin or actin (wild-type: black, n = 5 mice; Gpt2-null: red, n = 5 mice). The statistical test for comparisons of two groups was unpaired two-tailed Student t-test. *0.01 < P < 0.05, **0.001 < P < 0.01, ***P < 0.001.

Similar articles

Cited by

References

    1. Acheson AL, Zigmond MJ, 1981. Short and long term changes in tyrosine hydroxylase activity in rat brain after subtotal destruction of central noradrenergic neurons. J. Neurosci 1, 493–504. - PMC - PubMed
    1. Amaral D, Sinnamon H, 1977. The locus coeruleus: neurobiology of a central noradrenergic nucleus. Prog. Neurobiol 9, 147–196. - PubMed
    1. Aston-Jones G, Rajkowski J, Cohen J, 1999. Role of locus coeruleus in attention and behavioral flexibility. Biol. Psychiatry 46, 1309–1320. - PubMed
    1. Bartlett BJ, Isakson P, Lewerenz J, Sanchez H, Kotzebue RW, Cumming RC, Harris GL, Nezis IP, Schubert DR, Simonsen A, et al. , 2011. p62, ref(2)P and ubiquitinated proteins are conserved markers of neuronal aging, aggregate formation and progressive autophagic defects. Autophagy 7, 572–583. - PMC - PubMed
    1. Baytas O, Davidson SM, DeBerardinis RJ, Morrow EM, 2022. Mitochondrial enzyme GPT2 regulates metabolic mechanisms required for neuron growth and motor function in vivo. Hum. Mol. Genet 31, 587–603. - PMC - PubMed

Publication types