Review
. 2022;98(7):283-324.
doi: 10.2183/pjab.98.016.

Central regulation of body fluid homeostasis

Affiliations
Review

Central regulation of body fluid homeostasis

Masaharu Noda et al. Proc Jpn Acad Ser B Phys Biol Sci. 2022.

Abstract

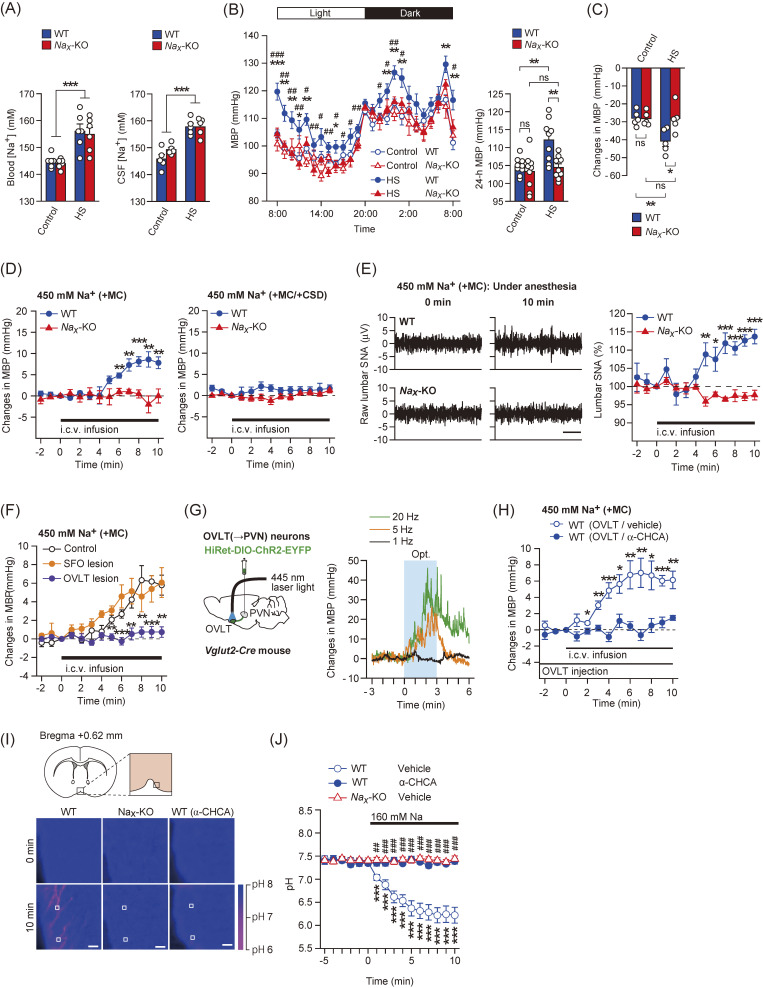
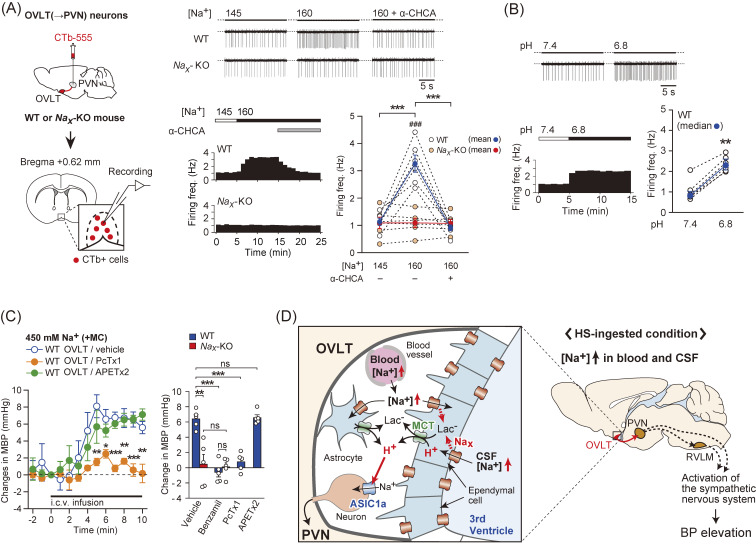
Extracellular fluids, including blood, lymphatic fluid, and cerebrospinal fluid, are collectively called body fluids. The Na+ concentration ([Na+]) in body fluids is maintained at 135-145 mM and is broadly conserved among terrestrial animals. Homeostatic osmoregulation by Na+ is vital for life because severe hyper- or hypotonicity elicits irreversible organ damage and lethal neurological trauma. To achieve "body fluid homeostasis" or "Na homeostasis", the brain continuously monitors [Na+] in body fluids and controls water/salt intake and water/salt excretion by the kidneys. These physiological functions are primarily regulated based on information on [Na+] and relevant circulating hormones, such as angiotensin II, aldosterone, and vasopressin. In this review, we discuss sensing mechanisms for [Na+] and hormones in the brain that control water/salt intake behaviors, together with the responsible sensors (receptors) and relevant neural pathways. We also describe mechanisms in the brain by which [Na+] increases in body fluids activate the sympathetic neural activity leading to hypertension.

Keywords: [Na+] sensor; angiotensin II; blood pressure; body fluid homeostasis; osmosensor; salt appetite; thirst.


Figures

Figure 1.
Figure 1.
A: [Na+]i imaging of SFO cells and immunostaining for glial marker proteins. Pseudocolor images of [Na+]i in SFO cells of WT mice in 145 and 170 mM NaCl solutions are shown in the center. Scale bar, 20 µm. B: GABAergic neurons (arrows) are surrounded by Nax-positive glial cell processes in the SFO. GFP fluorescence of GAD and Texas Red fluorescence of Nax. The inset figure indicates a GABAergic neuron with an asterisk. Scale bar, 50 µm. C: Immunoelectron microscopy of a core region of the SFO using an anti-Nax antibody. Arrows show neurons (N) and their processes (Np), including synapses, surrounded by Nax-positive thin processes of astrocytes (Ast). Scale bar, 1 µm. D: Schematic drawing of Nax-positive ependymal cells and astrocytes in the SFO. Figure references: Ref. for A, B, C and Ref. for D.
Figure 2.
Figure 2.
A: Whole-cell current responses of astrocytes in the SFO of WT and Nax-KO mice to ET-3. B: Relationship between current density and [ET-3] in 140 and 170 mM NaCl solutions. C: Relationship between current density and [Na+]o in the presence or absence of 1 nM ET-3. D: ET-3 induction in the SFO in dehydration conditions. E: Immunocytochemical detection of phosphorylated ERK1/2 (P-ERK) in the SFO. Scale bars, 50 µm. F: Activation cascade of Nax via ETBR receptors. The pathway indicated by the dotted line was suggested not to function in Nax activation by ETBR signaling. Figure reference: Ref. .
Figure 3.
Figure 3.
A: Glucose metabolism in glial cells. The anaerobic pathway leads to the production of lactate. B: Release of lactate from SFO tissue of WT and Nax-KO mice in Ringer’s solution containing 145 and 160 mM Na+. *, P < 0.05. C, D: Na+- and lactate-mediated control of the spike frequency of GABAergic neurons in the SFO. E: Schematic overview of the [Na+]-dependent control mechanism of salt intake in the SFO. Figure reference: Ref. .
Figure 4.
Figure 4.
A: [Na+]i imaging of SLC9A4-positive cells with 170 mM [Na+]o and equivalent osmolality. B: Relationship between the rates of increases in [Na+]i and [Na+]o. C: Co-expression of AT1a (purple) and SLC9A4 (brown) in the OVLT in AT1alacz/+ mice. *, double-positive cells. Scale bar, 50 µm. D: Suppression of the firing of SLC9A4-positive neurons in 160 mM NaCl solution with EIPA, an SLC9A4-specific antagonist. Scale bar, 2 s. *, P < 0.05; **, P < 0.01; n.s., not significant. Figure reference: Ref. .
Figure 5.
Figure 5.
A: Effects of arachidonic acid (AA) and 5,6-epoxyeicosatrienoic acid (EET) on water intake induced by the i.c.v. injection of a hypertonic NaCl solution in WT, TRPV4-KO, and Nax-KO mice. B: 5, 6-EET levels in the OVLT of WT and Nax-KO mice in water-deprived conditions. C: SLC9A4-positive OVLT neuronal activation by [Na+]o and Ang II. Scale bar, 2 s. ns, not significant; *, P < 0.05; **, P < 0.01. D: Schematic drawing of the mechanisms for sensing body fluid conditions in the OVLT that induce water intake. Increases in plasma and CSF [Na+] induce increases in osmolality. Activation of Nax channels (red) in glial cells (astrocytes and ependymal cells) in the OVLT induces the synthesis of EETs. These EETs are then released and activate TRPV4 channels (blue) in surrounding neurons, which induce water intake. SLC9A4 (purple)-positive neurons in the OVLT are also activated by increases in [Na+], which independently induces water intake. A H+-dependent mechanism appears to couple SLC9A4 to ASIC1a in water intake-driving neurons. Other than these two signaling mechanisms derived from distinct [Na+] sensors (Nax and SLC9A4), an independent mechanism originating from osmosensors (green) that also induces water intake has been proposed based on research conducted by several groups, including ours. Figure references: Refs. and .
Figure 6.
Figure 6.
A: Neural pathways responsible for the activation of thirst. Ang II-mediated thirst signals originate from AT1a neurons in the SFO and OVLT,96,115) and clock-driven thirst signals from VP neurons in the SCN.157) These signals are integrated in the MnPO and transmitted to the thalamus.115) B: Neural pathways responsible for the suppression of thirst. Water drinking signals sensed by the oral cavity and/or gastrointestinal tract are relayed to the NTS to activate CCK neurons in the SFO,138) GLP1R neurons in the MnPO,143) and Oxtr neurons and PDYN neurons in the PBN148,149) in order to suppress thirst. Arrowhead lines show neural projections from excitatory neurons and blunt-headed lines show those from inhibitory neurons. Dotted lines indicate hypothetical neural connections. Adcyap, adenylate cyclase-activating polypeptide; AP, area postrema; AT1a, angiotensin receptor 1a; CCK, cholecystokinin; GLP1R, glucagon-like peptide-1 receptor; LH, lateral hypothalamus; MnPO, median preoptic nucleus; NTS, nucleus of the solitary tract; OVLT, organum vasculosum of the lamina terminalis; Oxtr, oxytocin receptor; PBN, parabrachial nucleus; PDYN, prodynorphin; pre-LC, pre-locus coeruleus; PVN, paraventricular nucleus; PVT, paraventricular thalamus; SCN, suprachiasmatic nucleus; SFO, subfornical organ; VP, vasopressin.
Figure 7.
Figure 7.
A: Expression protocol of mCherry in CCK neurons in the SFO (left). A merged image showing the close apposition of mCherry-positive fibers of CCK neurons to GFP-positive GABAergic neurons (center, right). Scale bar, 50 µm. B: Stimulation of CCK neurons and whole-cell patch-clamp recording of GABAergic neurons with their synaptic connections in the SFO. C: Effects of CCK and its receptor antagonist on the firing activity of GABAergic neurons in the SFO. Scale bar, 1 s. D: Relationship between the firing activities of GABAergic neurons and their synaptically connected SFO(→OVLT) neurons. **, P < 0.01. Figure reference: Ref. .
Figure 8.
Figure 8.
Mechanisms controlling Ang II-induced thirst and salt appetite in the SFO in different conditions. In water-depleted conditions (left), [Ang II] and [Na+] both increase in the SFO. Nax in glial cells is activated by increases in [Na+], which stimulates anaerobic glycolysis in glial cells and ultimately induces the release of lactate, the endproduct of anaerobic glycolysis. Lactate is taken up and metabolized to generate ATP in GABAergic neurons, which leads to increases of the firing activity by depolarization through a KATP channel-dependent mechanism.27) GABAergic neurons thus stimulated by the Nax signal inhibit salt neurons, but not water neurons. Water neurons innervate the OVLT, and their selective activation induces water intake behavior in water-depleted conditions. In Na-depleted conditions (right), salt neurons that innervate the vBNST are activated by Ang II and enhance salt appetite in principle. In Na-depleted conditions, CCK is up-regulated in the SFO, and secreted CCK suppresses the Ang II-dependent neural activities of water neurons via activation of GABAergic neurons. This is one of the mechanisms suppressing water intake in Na-depleted conditions. Water and Na intakes both increase in water- and Na-depleted conditions, such as hypovolemia, because the Nax and CCK signals are not activated. Figure reference: Ref. .
Figure 9.
Figure 9.
A: Protocol for the Ca2+ imaging of CCK neurons at the single-cell level in the SFO (left). Representative fluorescence microscopic image of CCK neurons (right). B: Raster plots of three distinct populations of CCK neurons with different activation profiles. C: Protocol for the Ca2+ imaging of group 1 CCK neurons (left). Raster plots of Ca2+ responses by NaCl intake in individual group 1 CCK neurons in Na-depleted conditions (right). D: Protocol for the Ca2+ imaging of group 2 CCK-positive neurons during drinking behaviors (left). Raster plots of individual CCK-positive neurons at temporal positions in (A, right). Figure reference: Ref. .
Figure 10.
Figure 10.
Schematic drawings of neural mechanisms for the inhibition of water neurons by distinct groups of CCK neurons in the SFO. Water neurons (thirst-driving neurons) in the SFO generally transmit a thirst signal to the MnPO/OVLT in order to induce water intake behavior. The SFO contains two distinct subpopulations of CCK-positive neurons (groups 1 and 2) that receive humoral or neural signals, respectively. In Na-depleted conditions (upper right), circulating Ang II levels increase in blood. Ang II normally stimulates water neurons in the SFO; however, water neurons are inhibited by GABAergic neurons in Na-depleted conditions. Group 1 CCK-positive neurons may be activated by circulating signals, such as decreases in [Na+], in Na-depleted conditions. GABAergic neurons expressing CCK-B receptors (indicated by red marks on GABAergic neurons) are activated by CCK secreted from group 1 CCK-positive neurons in the SFO. Water intake is then inhibited in Na-depleted conditions. In water-depleted conditions (lower left), thirst signals, such as Ang II, continuously stimulate water neurons in the SFO. When animals drink water, group 2 CCK-positive neurons are tentatively activated by the intake of water (lower right). Consequently, GABAergic interneurons in the SFO are transiently activated by CCK to suppress water neurons and stop the excessive intake of water. These two CCK-mediated mechanisms suppress water intake to prevent excess water intake. Figure reference: Ref. .
Figure 11.
Figure 11.
A: Neural pathways responsible for the activation of salt appetite. Ang II-mediated salt appetite signals originate from AT1a neurons in the SFO,96) and aldosterone-mediated salt appetite signals originate from HSD11β2 neurons in the NTS226) innervating PDYN neurons in the pre-LC.232) These signals are integrated in the vBNST. B: Neural pathways responsible for the suppression of salt appetite. Increases in [Na+] in body fluids stimulate Nax-positive glial cells to suppress salt intake by activating the GABAergic neurons that control salt neurons in the SFO.27,96) Salt intake signals from the oral cavity and/or gastrointestinal tract are relayed to the NTS and activate Oxtr neurons in the PBN149) or inhibit PDYN neurons in the pre-LC232) in order to suppress salt appetite. Arrowhead lines show neural projections from excitatory neurons and blunt-headed lines show those from inhibitory neurons. Dotted lines indicate hypothetical neural connections. AP, area postrema; AT1a, angiotensin receptor 1a; CeA, central amygdala; HSD11β2, hydroxysteroid 11-β-dehydrogenase 2; NTS, nucleus of the solitary tract; Oxtr, oxytocin receptor; PBN, parabrachial nucleus; PDYN, prodynorphin; pre-LC, pre-locus coeruleus; SFO, subfornical organ; vBNST, ventral part of the bed nucleus of stria terminalis.
Figure 12.
Figure 12.
A: Water/salt intakes by WT, Nax-KO, AT1a-KO, and Nax/AT1a-DKO mice in water-depleted conditions (left). Salt solution preferences in the different genotypes (right). B: Labeling protocol of SFO→vBNST neurons with CTb-555 (left). Scale bar, 50 µm. Effects of [Na+] and Ang II on the firing activity of GABAergic neurons and their synaptically connected SFO→vBNST neurons (right). Scale bar, 1 s. C: Relationship between the activity of GABAergic neurons and that of SFO→vBNST neurons in WT and Nax-KO mice (left). Summary of data showing the effects of [Na+] and Ang II (right). D: Effects of the optical excitation of GABAergic neurons in the SFO on water/salt intakes in Na-depleted conditions. *, P < 0.05; **, P < 0.01. Figure reference: Ref. .
Figure 13.
Figure 13.
A: Increases in [Na+] in blood (left) and CSF (right) in WT and Nax-KO mice following the intake of 2% NaCl (HS) by mice for 7 days. B: Circadian changes in MBP in control and HS fed mice (left) and MBP averages for 24 h (right). C: Changes induced in MBP by the i.p. administration of CSD. D: Changes induced in MBP by the i.c.v. administration of hypertonic 0.45 M [Na+] solution after a pretreatment with MC (left) and MC plus CSD (right). E: Lumbar SNA before and after the i.c.v. administration of hypertonic Na solution. Scale bar, 0.1 s. F: Changes in MBP following the i.c.v. administration of hypertonic Na solution in mice with a focal lesion in the SFO or OVLT. G: Optical stimulation of the PVN→OVLT pathway using ChR2 with a blue laser at 1, 5, and 20 Hz. H: Changes in MBP following the i.c.v. administration of hypertonic Na solution. Effects of the infusion of α-CHCA into the OVLT. I: Imaging analysis of pH in the intercellular space of OVLT tissue. Scale bars, 20 µm. J: Time course of pH changes in the regions with squares in (I). Extracellular pH in OVLT tissue from WT mice decreases in response to increases in [Na+]o to 160 mM. ns, not significant; */#, P < 0.05; **/##, P < 0.01; ***/###, P < 0.001. Figure reference: Ref. .
Figure 14.
Figure 14.
A: Schematic of the labeling of OVLT(→PVN) neurons with CTb555 for electrophysiological experiments (left). Effects of hypertonic [Na+] with α-CHCA on the firing frequency of OVLT(→PVN) neurons in WT and Nax-KO mice (right). B: Effects of low pH solution on the firing frequency of OVLT(→PVN) neurons. C: Changes in MBP following the i.c.v. administration of hypertonic Na solution after vehicle, PcTx, or APETx2. ns, not significant; **, P < 0.01; ***/###, P < 0.001. D: Central mechanisms underlying salt-induced increases in BP. Increases in [Na+] are sensed by Nax in the OVLT, which subsequently induces the release of lactate and H+ from Nax-expressing ependymal cells and astrocytes through MCTs. The resultant extracellular acidification activates OVLT(→PVN) neurons via ASIC1a. The OVLT-PVN-RVLM neural pathway is then stimulated and increases BP through enhancements in SNA. Figure reference: Ref. .

Similar articles

Cited by

References

    1. Cox P.S., Denton D.A., Mouw D.R., Tarjan E. (1987) Natriuresis induced by localized perfusion within the third cerebral ventricle of sheep. Am. J. Physiol. 252, R1–R6. - PubMed
    1. Park R., Denton D.A., McKinley M.J., Pennington G., Weisinger R.S. (1989) Intracerebroventricular saccharide infusions inhibit thirst induced by systemic hypertonicity. Brain Res. 493, 123–128. - PubMed
    1. Denton D.A., McKinley M.J., Weisinger R.S. (1996) Hypothalamic integration of body fluid regulation. Proc. Natl. Acad. Sci. U.S.A. 93, 7397–7404. - PMC - PubMed
    1. McKinley M.J., McAllen R.M., Davern P., Giles M.E., Penschow J., Sunn N., et al. (2003) The sensory circumventricular organs of the mammalian brain. Adv. Anat. Embryol. Cell Biol. 172, III–XII, 1–122, back cover. - PubMed
    1. Johnson A.K., Gross P.M. (1993) Sensory circumventricular organs and brain homeostatic pathways. FASEB J. 7, 678–686. - PubMed