

Correcting magnification error in foveal avascular zone area measurements of optical coherence tomography angiography images with estimated axial length
- PMID: 35909098
- PMCID: PMC9341098
- DOI: 10.1186/s40662-022-00299-x
Correcting magnification error in foveal avascular zone area measurements of optical coherence tomography angiography images with estimated axial length
Abstract
Background: To generate and validate a method to estimate axial length estimated (ALest) from spherical equivalent (SE) and corneal curvature [keratometry (K)], and to determine if this ALest can replace actual axial length (ALact) for correcting transverse magnification error in optical coherence tomography angiography (OCTA) images using the Littmann-Bennett formula.
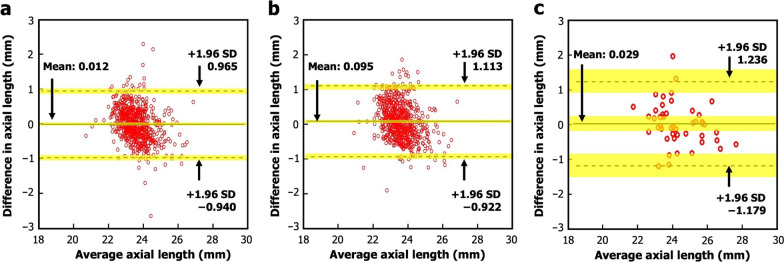
Methods: Data from 1301 participants of the Raine Study Gen2-20 year follow-up were divided into two datasets to generate (n = 650) and validate (n = 651) a relationship between AL, SE, and K. The developed formula was then applied to a separate dataset of 46 participants with AL, SE, and K measurements and OCTA images to estimate and compare the performance of ALest against ALact in correcting transverse magnification error in OCTA images when measuring the foveal avascular zone area (FAZA).
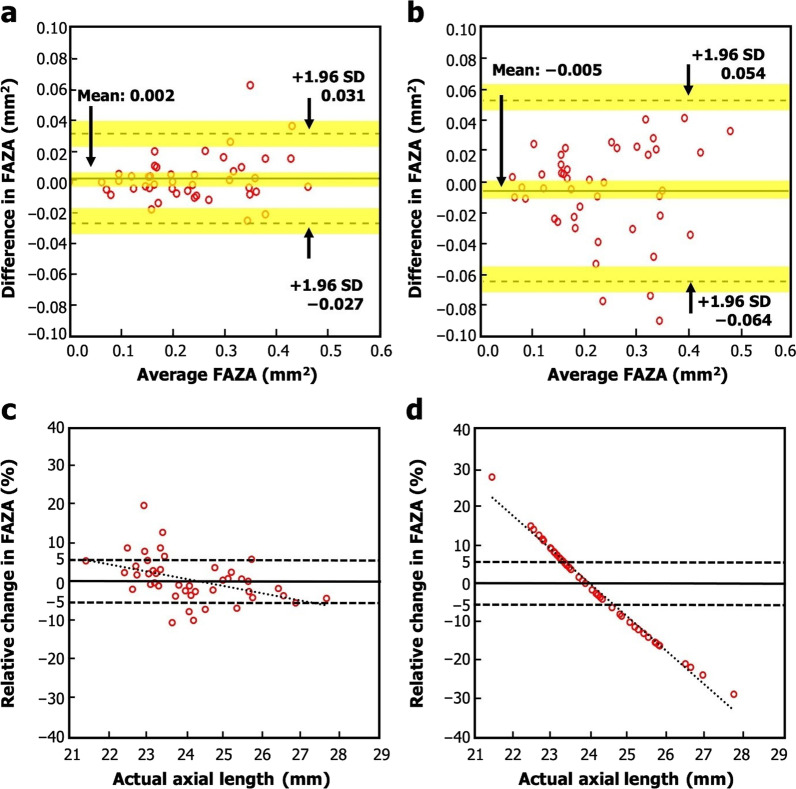
Results: The formula for ALest yielded the equation: ALest = 2.102K - 0.4125SE + 7.268, R2 = 0.794. There was good agreement between ALest and ALact for both study cohorts. The mean difference [standard deviation (SD)] between FAZA corrected with ALest and ALact was 0.002 (0.015) mm2 with the 95% limits of agreement (LoA) of - 0.027 to 0.031 mm2. In comparison, mean difference (SD) between FAZA uncorrected and corrected with ALact was - 0.005 (0.030) mm2, with 95% LoA of - 0.064 to 0.054 mm2.
Conclusions: ALact is more accurate than ALest and hence should be used preferentially in magnification error correction in the clinical setting. FAZA corrected with ALest is comparable to FAZA corrected with ALact, while FAZA measurements using images corrected with ALest have a greater accuracy than measurements on uncorrected images. Hence, in the absence of ALact, clinicians should use ALest to correct for magnification error as this provides for more accurate measurements of fundus parameters than uncorrected images.
Keywords: Axial length; Keratometry; Littmann-Bennett formula; OCTA; Spherical equivalent.
© 2022. The Author(s).
Conflict of interest statement
The authors declare that they have no competing interests.
Figures
References
-
- Wilk MA. Using imaging and genetics to characterize visual system structure across the pigmentation spectrum (Ph.D.). Ann Arbor, The Medical College of Wisconsin; 2017.
-
- Sampson DM, Gong P, An D, Menghini M, Hansen A, Mackey DA, et al. Axial length variation impacts on superficial retinal vessel density and foveal avascular zone area measurements using optical coherence tomography angiography. Invest Ophthalmol Vis Sci. 2017;58(7):3065–3072. doi: 10.1167/iovs.17-21551. - DOI - PubMed
LinkOut - more resources
Full Text Sources
Research Materials
