. 2022 Aug 1;7(1):259.
doi: 10.1038/s41392-022-01054-3.

Cardiomyocyte-specific knockout of ADAM17 ameliorates left ventricular remodeling and function in diabetic cardiomyopathy of mice

Affiliations

Cardiomyocyte-specific knockout of ADAM17 ameliorates left ventricular remodeling and function in diabetic cardiomyopathy of mice

Fei Xue et al. Signal Transduct Target Ther. .

Abstract

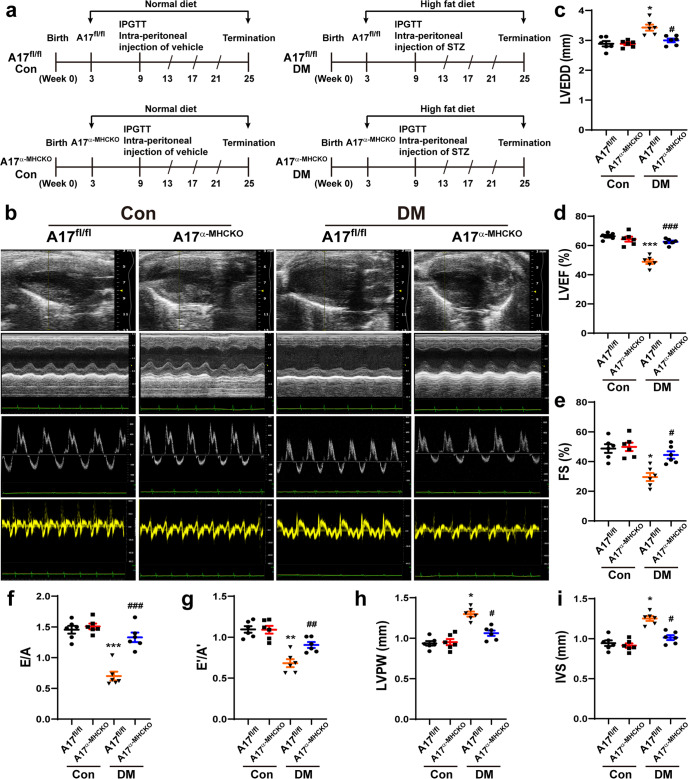
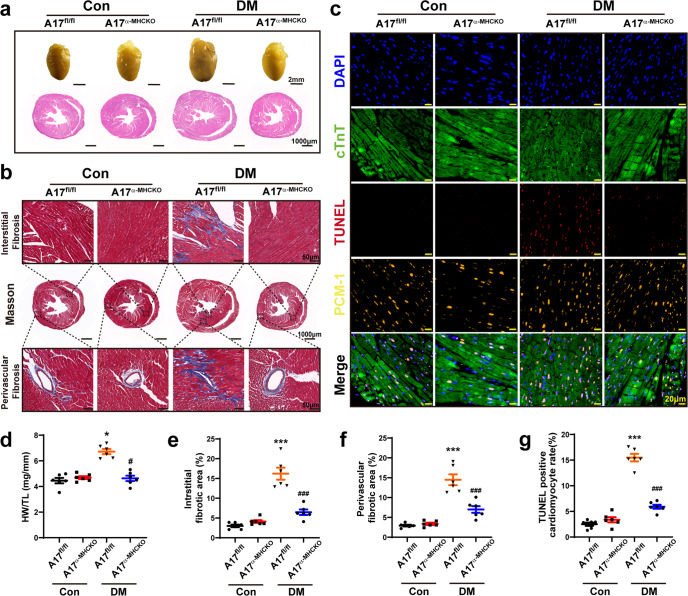
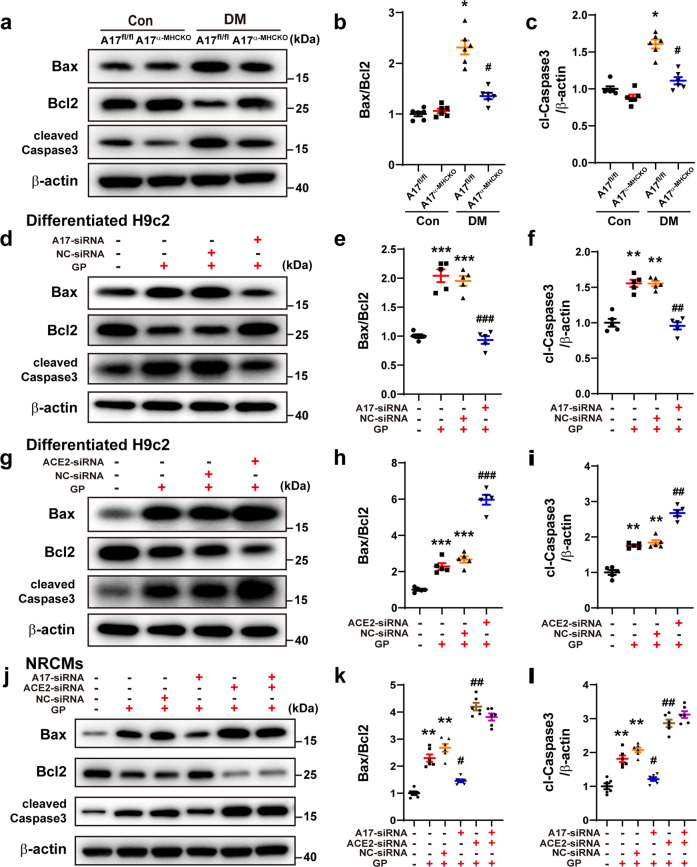
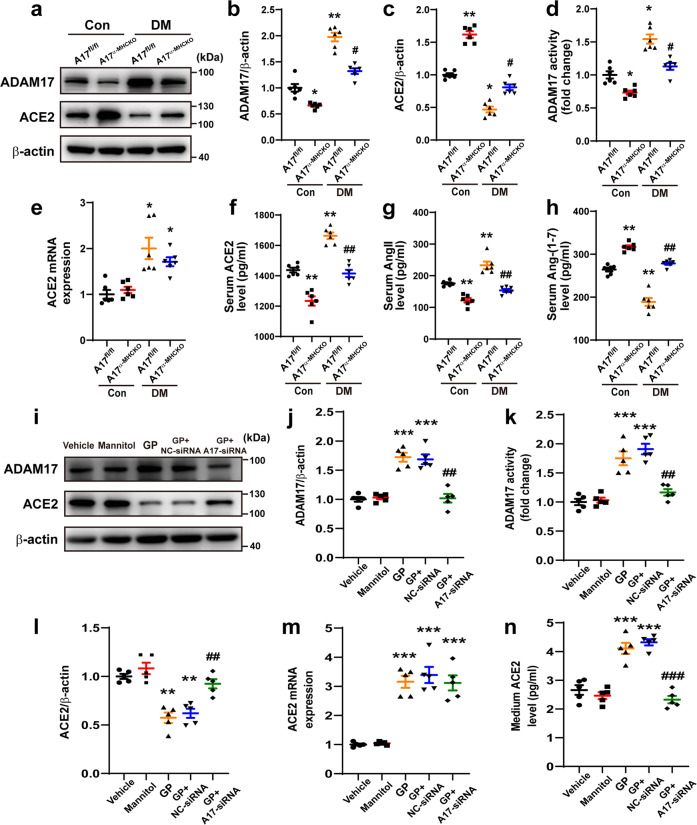
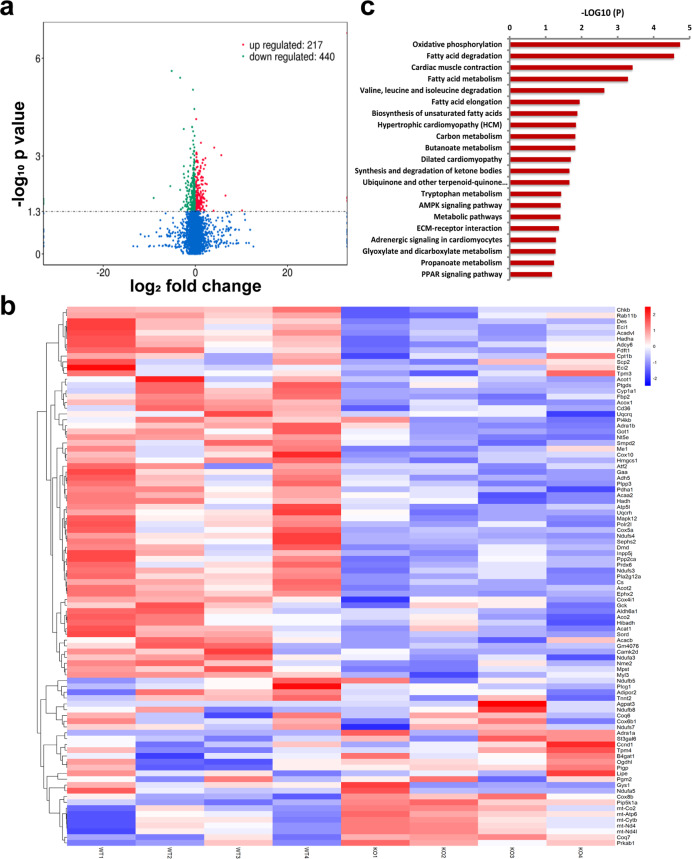
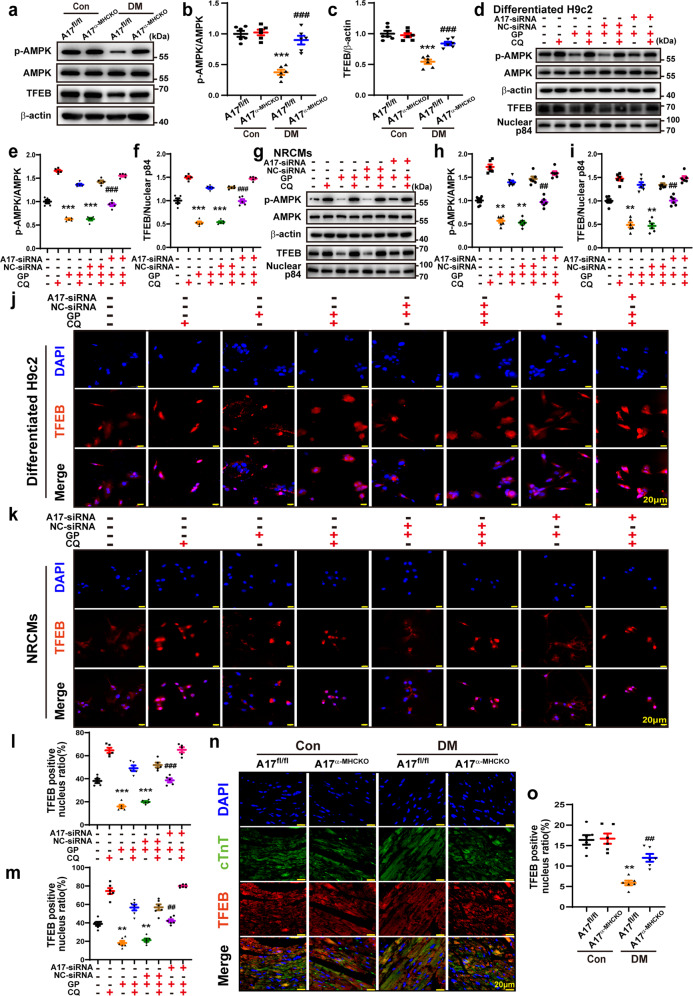
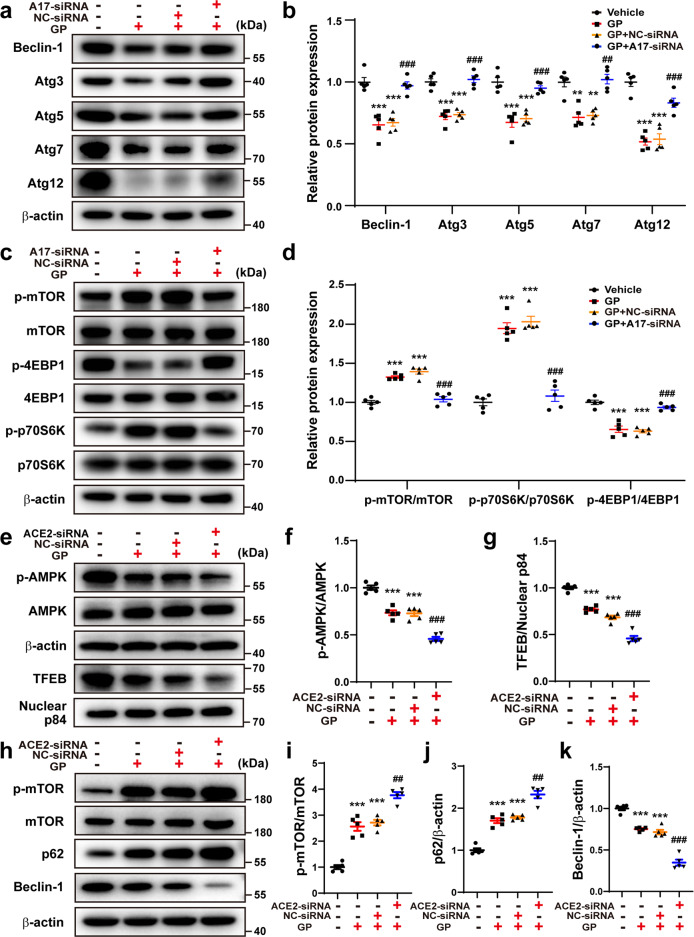
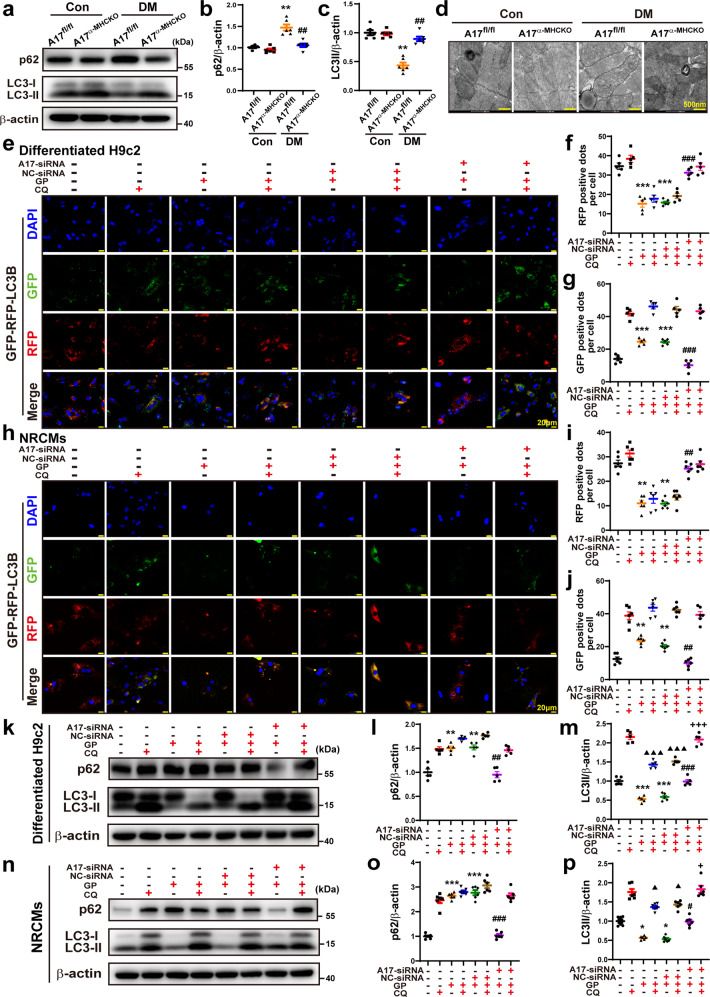
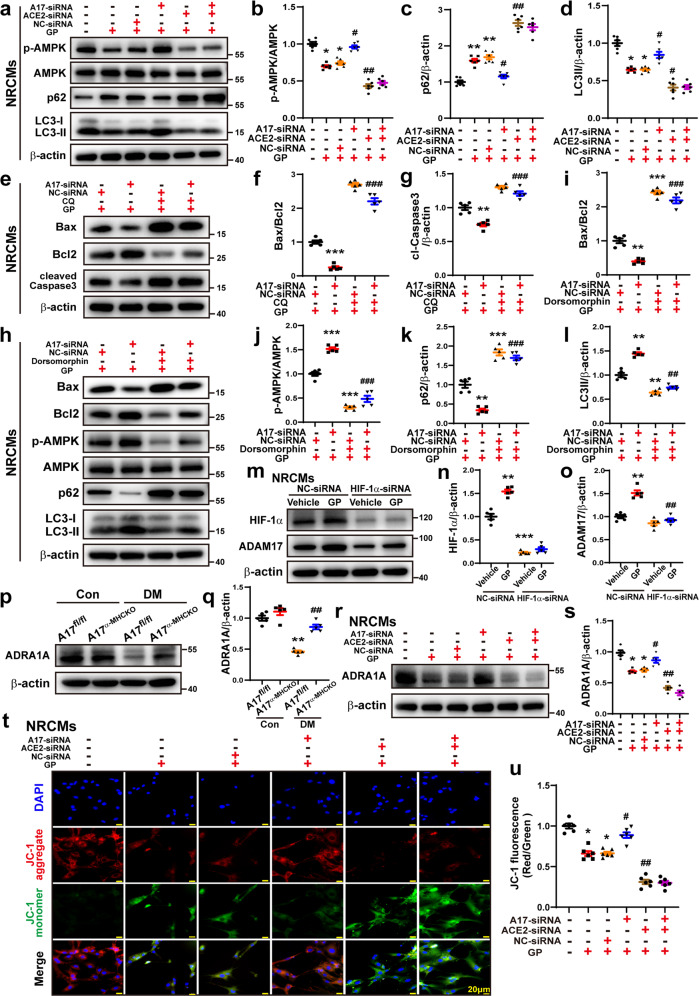
Angiotensin-converting enzyme 2 (ACE2) has proven beneficial in attenuating diabetic cardiomyopathy (DCM) but has been found to be a substrate of a disintegrin and metalloprotease protein-17 (ADAM17). However, whether ADAM17 plays a role in the pathogenesis and intervention of DCM is obscure. In this study, we created cardiomyocyte-specific knockout of ADAM17 (A17α-MHCKO) mice, and left ventricular dimension, function, pathology and molecular biology were assessed in ADAM17fl/fl control, A17α-MHCKO control, ADAM17fl/fl diabetic and A17α-MHCKO diabetic mice. Both differentiated H9c2 cells and neonatal rat cardiomyocytes (NRCMs) were used to explore the molecular mechanisms underlying the effect of ADAM17 on DCM. The results showed that protein expression and activity of ADAM17 were upregulated whereas the protein expression of ACE2 was downregulated in the myocardium of diabetic mice. Cardiomyocyte-specific knockout of ADAM17 mitigated cardiac fibrosis and cardiomyocyte apoptosis and ameliorated cardiac dysfunction in mice with DCM. Bioinformatic analyses detected a number of genes enriched in metabolic pathways, in particular the AMPK signaling pathway, expressed differentially between the hearts of A17α-MHCKO and ADAM17fl/fl diabetic mice. The mechanism may involve activated AMPK pathway, increased autophagosome formation and improved autophagic flux, which reduced the apoptotic response in cardiomyocytes. In addition, hypoxia-inducible factor-1α (HIF-1α) might act as an upstream mediator of upregulated ADAM17 and ADAM17 might affect AMPK signaling via α1 A-adrenergic receptor (ADRA1A). These results indicated that ADAM17 activity and ACE2 shedding were enhanced in DCM, which was reversed by cardiomyocyte-specific ADAM17 knockout. Thus, inhibition of ADAM17 may provide a promising approach to the treatment of DCM.


Conflict of interest statement

The authors declare no competing interests.

Figures

Fig. 1
Fig. 1
Experiment timeline and echocardiographic measurements in four groups of mice. a Experiment timeline in four groups of mice. b Representative echocardiographic images in mice: (1) Two-dimensional echocardiogram showing left ventricular long-axis view; (2) M-mode echocardiogram showing left ventricular dimensions; (3) Pulse-wave Doppler echocardiogram depicting diastolic mitral flow; (4) Tissue Doppler echocardiogram displaying mitral annular velocities. c Measurements of left ventricular end-diastolic diameter (LVEDD) in mice. d Measurements of left ventricular ejection fraction (LVEF) in mice. e Measurements of left ventricular fractional shortening (FS) in mice. f Measurements of the ratio of early to late diastolic mitral flow velocities (E/A) in mice. g Measurements of the ratio of early to late diastolic mitral annular velocities (E'/A') in mice. h Measurements of left ventricular posterior wall (LVPW) thickness in mice. i Measurements of interventricular septum (IVS) thickness in mice. Data were expressed as mean ± SEM. *P < 0.05, **P < 0.01, ***P < 0.001 vs. the A17fl/fl control group; #P < 0.05, ##P < 0.01, ###P < 0.001 vs. the A17fl/fl DM group; n = 6.
Fig. 2
Fig. 2
Histological and immunohistochemical staining in four groups of mice. a Representative images of hearts and myocardial cross-sections in four groups of mice: representative heart pictures (scale bar: 2 mm) were shown in the upper panel; Representative H&E staining of myocardial cross-sections (scale bar: 1000 μm) were shown in the lower panel. b Representative Masson’s trichrome staining of myocardial fibers. Masson’s trichrome staining of cardiac short-axis cross sectional areas (scale bar: 1000 μm) were shown in the middle panel. Dotted boxes in the middle panel indicated a local area in the low magnification field (scale bar: 1000 μm), which was enlarged in the high magnification field (scale bar: 50 μm) in the bottom panel. The interstitial fibrosis images were shown in the top panel and the perivascular fibrosis images were shown in the bottom panel. c Representative TUNEL-positive cardiomyocyte staining in mice (scale bar: 20 μm). d Quantitative analysis of heart weight/tibial length (HW/TL) ratio in mice, n = 6. e and f Quantification of the interstitial and perivascular fibrosis area in mice, n = 6. g Quantification of TUNEL-positive cardiomyocytes in mice, n = 6. Data were expressed as mean ± SEM. *P < 0.05, ***P < 0.001 vs. the A17fl/fl control group; #P < 0.05, ###P < 0.001 vs. the A17fl/fl DM group.
Fig. 3
Fig. 3
Effects of ADAM17 and ACE2 on apoptosis in mice, differentiated H9c2 cells and NRCMs. a Representative Western blot images of Bax, Bcl2, and cleaved caspase-3 expression in the myocardium of four groups of mice. b, c Quantitative analysis of Bax/Bcl2 and cleaved caspase-3 expression in four groups of mice, n = 6. Data were shown as mean ± SEM. *P < 0.05 vs. the A17fl/fl control group; #P < 0.05 vs. the A17fl/fl DM group. df Representative Western blot images of Bax, Bcl2, and cleaved caspase three expression and quantitative analysis of Bax/Bcl2 and cleaved caspase three expression in four groups of differentiated H9c2 cells treated with vehicle, GP, GP + NC-siRNA and GP + ADAM17-siRNA, respectively. Mean values were derived from five independent experiments. gi Representative Western blot images of Bax, Bcl2, and cleaved caspase-3 expression and quantitative analysis of Bax/Bcl2 and cleaved caspase-3 in four groups of differentiated H9c2 cells treated with vehicle, GP, GP + NC-siRNA and GP + ACE2-siRNA, respectively. Mean values were derived from five independent experiments. Data were expressed as mean ± SEM. **P < 0.01, ***P < 0.001 vs. the vehicle group; ##P < 0.01, ###P < 0.001 vs. the GP + NC-siRNA group. j Representative Western blot images of Bax, Bcl2, and cleaved caspase-3 expression in six groups of NRCMs treated with vehicle, GP, GP + NC-siRNA, GP + ADAM17-siRNA, GP + ACE2-siRNA and GP + ADAM17-siRNA+ACE2-siRNA, respectively. k, l Quantitative analysis of Bax/Bcl2 and cleaved caspase-3 expression in six groups of NRCMs. Mean values were derived from six independent experiments. Data were presented as mean ± SEM. **P < 0.01 vs. the vehicle group; #P < 0.05, ##P < 0.01 vs. the GP + NC-siRNA group.
Fig. 4
Fig. 4
Serum levels of ACE2, Ang II, and Ang-(1–7) in mice and expression of ADAM17 and ACE2 in the myocardium of mice and in differentiated H9c2 cells. a Representative Western blot images of ADAM17 and ACE2 protein expression in the myocardium of four groups of mice. b, c Quantitative analyses of ADAM17 and ACE2 expression in the myocardium of mice, n = 6. d Quantitative analysis of ADAM17 activity in the myocardium of mice, n = 6. e Quantitative analysis of ACE2 mRNA expression in the myocardium of mice, n = 6. fh Quantitative analysis of serum levels of ACE2, Ang II, and Ang-(1–7) in mice, n = 6. Data were shown as mean ± SEM. *P < 0.05, **P < 0.01 vs. the A17fl/fl control group; #P < 0.05, ##P < 0.01 vs. the A17fl/fl DM group. i, j and l Representative Western blot images and quantitative analysis of ADAM17 and ACE2 protein expression in five groups of differentiated H9c2 cells treated with vehicle, mannitol, GP, GP + NC-siRNA and GP + ADAM17-siRNA, respectively. Mean values were derived from five independent experiments. k Quantitative analysis of ADAM17 activity in five groups of differentiated H9c2 cells treated as above. m, n Quantitative analysis of ACE2 mRNA level and ACE2 expression in the medium in five groups of differentiated H9c2 cells treated as above. Mean values were derived from five independent experiments. Data were shown as mean ± SEM. **P < 0.01, ***P < 0.001 vs. the vehicle group; ##P < 0.01, ###P < 0.001 vs. the GP + NC-siRNA group.
Fig. 5
Fig. 5
RNA-sequencing analysis of myocardial tissues in mice. a Volcano plot showing the transcript expression profiles in the hearts of A17α-MHCKO and ADAM17fl/fl diabetic mice, respectively. The horizontal line marked the threshold (P < 0.05) for defining upregulated (red dot) or downregulated (blue dot) genes in the myocardium of A17α-MHCKO diabetic mice. The x-axis indicated log2 fold change and the y-axis indicated −log10 P-values. b Hierarchical clustering of the top 50 (ranked by P-values) genes differentially expressed in hearts from the A17α-MHCKO and ADAM17fl/fl diabetic mice. c KEGG pathway enrichment analysis of differential expression (DE) transcripts in the heart. The DE transcripts falling into the top pathways were summarized. The x-axis indicated –log10 (P-values) of the pathway and the y-axis displayed functional pathways
Fig. 6
Fig. 6
ADAM17 regulated the AMPK-TFEB pathway in vivo and in vitro. a Representative Western blot images of protein expression of phosphorylated AMPK, AMPK, and TFEB in the myocardium of four groups of mice. b, c Quantitative analysis of phosphorylated AMPK/AMPK and TFEB expression in the myocardium of four groups mice, n = 6. Data were expressed as mean ± SEM. ***P < 0.001 vs. the A17fl/fl control group; ###P < 0.001 vs. the A17fl/fl DM group. df Representative Western blot images and quantitative analysis of phosphorylated AMPK, AMPK, and TFEB protein expression in eight groups of differentiated H9c2 cells treated with vehicle, GP, GP + NC-siRNA, and GP + ADAM17-siRNA, with and without additional chloroquine (CQ) treatment, respectively. Mean values were obtained from five independent experiments. gi Representative Western blot images and quantitative analysis of phosphorylated AMPK, AMPK, and TFEB protein expression in eight groups of NRCMs treated as above. j Representative immunofluorescence staining of TFEB (red) in eight groups of differentiated H9c2 cells (scale bar: 20 μm) treated as above. k Representative immunofluorescence staining of TFEB (red) in eight groups of NRCMs treated as above (scale bar: 20 μm). l Quantification of TFEB-positive nucleus ratio in differentiated H9c2 cells. Mean values were derived from five independent experiments. m Quantification of TFEB-positive nucleus ratio in NRCMs. Six independent experiments were performed to derive the mean values. Data were expressed as mean ± SEM. **P < 0.01, ***P < 0.001 vs. the vehicle group; ##P < 0.01, ###P < 0.001 vs. the GP + NC-siRNA group. n Representative immunofluorescence staining of TFEB and cTnT in four groups of mice (scale bar: 20 μm). o Quantification of TFEB-positive nucleus ratio in cardiomyocytes of four groups of mice, n = 6. Data were presented as mean ± SEM. **P < 0.01 vs. the A17fl/fl control group; ##P < 0.01 vs. the A17fl/fl DM group
Fig. 7
Fig. 7
Effects of ADAM17 or ACE2 deficiency on autophagy-related proteins. a, b Representative Western blot images and quantitative analyses of protein expression of Beclin1, Atg3, Atg5, Atg7, and Atg12 in four groups of differentiated H9c2 cells treated with vehicle, GP, GP + NC-siRNA and GP + ADAM17-siRNA, respectively. c, d Representative Western blot images and analysis of phosphorylated mTOR, mTOR, phosphorylated p70S6K, p70S6K, phosphorylated 4EBP1 and 4EBP1 protein expression in differentiated H9c2 cells treated as above. Mean values were derived from 5 independent experiments. eg Representative Western blot images and quantitative analysis of phosphorylated AMPK, AMPK, and TFEB protein expression in differentiated H9c2 cells treated with vehicle, GP, GP + NC-siRNA and GP + ACE2-siRNA, respectively. hk Representative Western blot images and analysis of phosphorylated mTOR, mTOR, p62 and Beclin1 protein expression in differentiated H9c2 cells treated as above. Mean values were obtained from five independent experiments. Data were presented as mean ± SEM. *P < 0.05, **P < 0.01, ***P < 0.001 vs. the vehicle group; #P < 0.05, ##P < 0.01, ###P < 0.001 vs. the GP + NC-siRNA group
Fig. 8
Fig. 8
Effects of ADAM17 deficiency on cardiomyocyte autophagy in vivo and in vitro and on autophagic flux in differentiated H9c2 cells and NRCMs. a Representative Western blot images of autophagy-related protein expression, including p62 and LC3 in the myocardium of four groups of mice. b, c Quantitative analysis of protein expression of p62 and LC3II/β-actin in the myocardium of four groups of mice, n = 6. Data were shown as mean ± SEM. **P < 0.01, vs. the A17fl/fl control group; ##P < 0.01 vs. the A17fl/fl DM group. d Representative transmission electron microscopy images of the myocardium in four groups of mice (scale bar: 500 nm). e Representative fluorescence images of green fluorescent protein (GFP; green), red fluorescent protein (RFP; red), GFP-RFP-LC3 (merged: yellow) and nuclei stained with DAPI (scale bar: 20 μm) in eight groups of differentiated H9c2 cells treated with vehicle, GP, GP + NC-siRNA and GP + ADAM17-siRNA, with and without additional CQ treatment, respectively. f, g Quantitative analysis of RFP-positive and GFP-positive dots per cell in differentiated H9c2 cells. Mean values were derived from five independent experiments. h Representative fluorescence images of GFP-RFP-LC3 in eight groups of NRCMs treated as above. i, j Quantitative analysis of RFP-positive and GFP-positive dots per cell in NRCMs. Mean values were obtained from six independent experiments. k Representative Western blot images of p62 and LC3 protein expression in eight groups of differentiated H9c2 cells treated as above. l and m Quantitative analysis of protein expression of p62 and LC3II/β-actin in differentiated H9c2 cells. Five independent experiments were performed to calculate the means. n Representative Western blot images of p62 and LC3 protein expression in eight groups of NRCMs treated as above. o and p Quantitative analysis of protein expression of p62 and LC3II/β-actin in NRCMs. Mean values were derived from six independent experiments. Data were expressed as mean ± SEM. *P < 0.05, **P < 0.01, ***P < 0.001 vs. the vehicle group; #P < 0.05, ##P < 0.01, ###P < 0.001 vs. the GP + NC-siRNA group; P < 0.05, ▲▲▲P < 0.001 vs. the CQ group; +P < 0.05, +++P < 0.001 vs. the GP + CQ + NC-siRNA group
Fig. 9
Fig. 9
Effects of ADAM17 and ACE2 double knock-down and AMPK inhibitor on cardiac autophagy and apoptosis. a Representative Western blot images of protein expression of phosphorylated AMPK, AMPK, p62 and LC3 in six groups of NRCMs treated with vehicle, GP, GP + NC-siRNA, GP + ADAM17-siRNA, GP + ACE2-siRNA and GP + ADAM17-siRNA+ACE2-siRNA, respectively. bd Quantitative analysis of p-AMPK/AMPK, p62 and LC3II/β-actin expression in six groups of NRCMs. Mean values were derived from six independent experiments. Data were expressed as mean ± SEM. *P < 0.05, **P < 0.01 vs. the vehicle group; #P < 0.05, ##P < 0.01 vs. the GP + NC-siRNA group. e Representative Western blot images of Bax, Bcl2, and cleaved Caspase-3 expression in four groups of NRCMs treated with GP + NC-siRNA+vehicle, GP + ADAM17-siRNA+vehicle, GP + NC-siRNA+CQ and GP + ADAM17-siRNA+CQ, respectively. f, g Quantitative analysis of Bax/Bcl2, and cleaved Caspase-3 expression in four groups of NRCMs. Five independent experiments were conducted to derive the means. Data were expressed as mean ± SEM. **P < 0.01, ***P < 0.001 vs. the GP + NC-siRNA+vehicle group; ###P < 0.001 vs. the GP + A17-siRNA group+vehicle group. h Representative Western blot images of Bax, Bcl2, p-AMPK, AMPK, p62 and LC3 expression in four groups of NRCMs treated with GP + NC-siRNA+vehicle, GP + ADAM17-siRNA+vehicle, GP + NC-siRNA+dorsomorphin, GP + ADAM17-siRNA+dorsomorphin, respectively. il Quantitative analysis of Bax/Bcl2, p-AMPK/AMPK, p62 and LC3II/β-actin expression in four groups of NRCMs. Mean values were derived from six independent experiments. Data were shown as mean ± SEM. **P < 0.01, ***P < 0.001 vs. the GP + NC-siRNA+vehicle group; ##P < 0.01, ###P < 0.001 vs. the GP + A17-siRNA group+vehicle group. m Representative Western blot images of HIF-1α and ADAM17 expression in four groups of NRCMs treated with vehicle+NC-siRNA, GP + NC-siRNA, vehicle+ HIF-1α-siRNA and GP + HIF-1α-siRNA, respectively. n, o Quantitative analysis of HIF-1α and ADAM17 expression in four groups of NRCMs. Five independent experiments were performed to calculate the means. Data were presented as mean ± SEM. **P < 0.01, ***P < 0.001 vs. the vehicle+NC-siRNA group; ##P < 0.01 vs. the GP + NC-siRNA group. p, q Representative Western blot images and analysis of ADRA1A protein expression in the myocardium of four groups of mice, n = 5. **P < 0.01 vs. the A17fl/fl control group; ##P < 0.01 vs. the A17fl/fl DM group. r, s Representative Western blot images and quantitative analysis of ADRA1A protein expression in NRCMs treated with vehicle, GP, GP + NC-siRNA, GP + ADAM17-siRNA, GP + ACE2-siRNA and GP + ADAM17-siRNA+ACE2-siRNA, respectively. Five independent experiments were conducted to derive the means. Data were expressed as mean ± SEM. *P < 0.05 vs. the vehicle group; #P < 0.05, ##P < 0.01 vs. the GP + NC-siRNA group. t and u Representative fluorescence images of JC-1 staining in NRCMs treated as above (scale bar: 20 μm). Quantitative analysis of JC-1 (JC-1 aggregates/JC-1 monomers) in NRCMs. Six independent experiments were performed to derive the mean values. Data were expressed as mean ± SEM. *P < 0.05, **P < 0.01 vs. the vehicle group; #P < 0.05, ##P < 0.01 vs. the GP + NC-siRNA group

Similar articles

Cited by

References

    1. Bugger H, Abel ED. Molecular mechanisms of diabetic cardiomyopathy. Diabetologia. 2014;57:660–671. doi: 10.1007/s00125-014-3171-6. - DOI - PMC - PubMed
    1. Isfort M, Stevens SC, Schaffer S, Jong CJ, Wold LE. Metabolic dysfunction in diabetic cardiomyopathy. Heart Fail. Rev. 2014;19:35–48. doi: 10.1007/s10741-013-9377-8. - DOI - PMC - PubMed
    1. Heidenreich PA, et al. 2022 AHA/ACC/HFSA Guideline for the management of heart failure: executive summary: a report of the American College of Cardiology/American Heart Association Joint Committee on clinical practice guidelines. J. Am. Coll. Cardiol. 2022;79:1757–1780. doi: 10.1016/j.jacc.2021.12.011. - DOI - PubMed
    1. McDonagh TA, et al. 2021 ESC Guidelines for the diagnosis and treatment of acute and chronic heart failure. Eur. Heart J. 2021;42:3599–3726. doi: 10.1093/eurheartj/ehab368. - DOI - PubMed
    1. Wei CC, et al. Mast cell chymase limits the cardiac efficacy of Ang I-converting enzyme inhibitor therapy in rodents. J. Clin. Invest. 2010;120:1229–1239. doi: 10.1172/JCI39345. - DOI - PMC - PubMed

Publication types

MeSH terms