. 2022 Jul 22;5(7):9063-9071.
doi: 10.1021/acsanm.2c01372. Epub 2022 Jul 1.

Enhanced Optical Biosensing by Aerotaxy Ga(As)P Nanowire Platforms Suitable for Scalable Production

Affiliations

Enhanced Optical Biosensing by Aerotaxy Ga(As)P Nanowire Platforms Suitable for Scalable Production

Julia Valderas-Gutiérrez et al. ACS Appl Nano Mater. .

Abstract

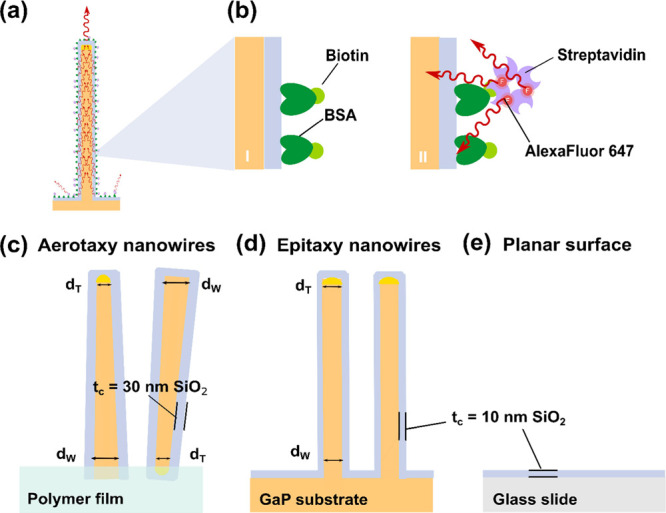
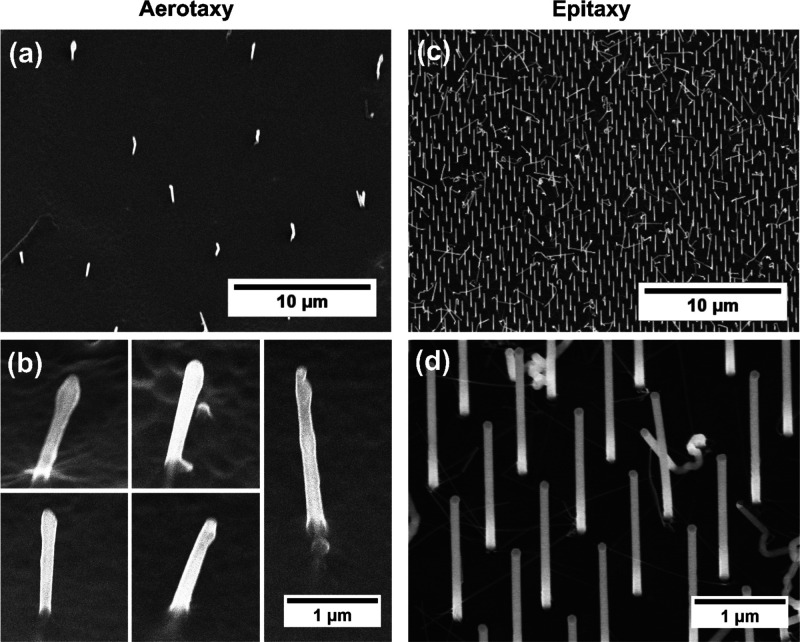
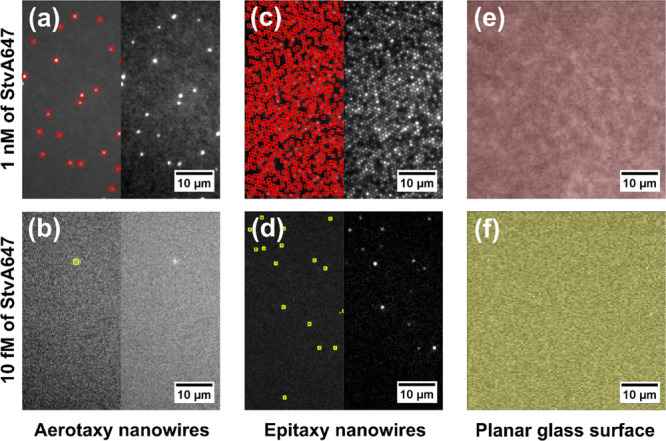
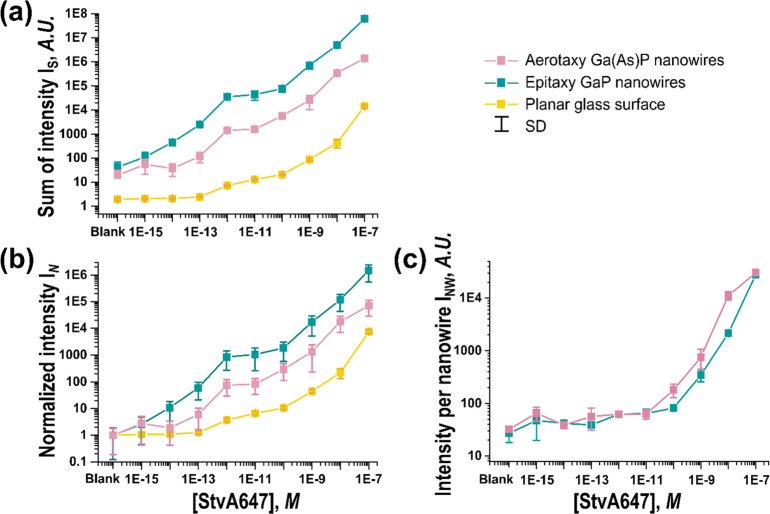
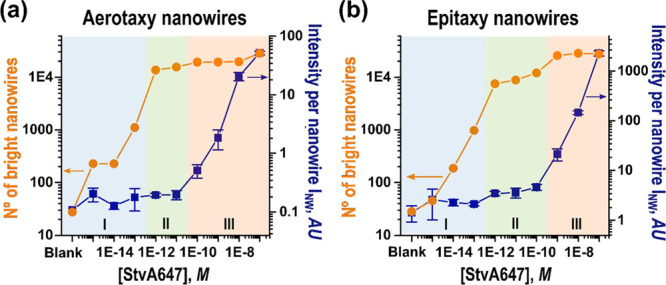
Sensitive detection of low-abundance biomolecules is central for diagnostic applications. Semiconductor nanowires can be designed to enhance the fluorescence signal from surface-bound molecules, prospectively improving the limit of optical detection. However, to achieve the desired control of physical dimensions and material properties, one currently uses relatively expensive substrates and slow epitaxy techniques. An alternative approach is aerotaxy, a high-throughput and substrate-free production technique for high-quality semiconductor nanowires. Here, we compare the optical sensing performance of custom-grown aerotaxy-produced Ga(As)P nanowires vertically aligned on a polymer substrate to GaP nanowires batch-produced by epitaxy on GaP substrates. We find that signal enhancement by individual aerotaxy nanowires is comparable to that from epitaxy nanowires and present evidence of single-molecule detection. Platforms based on both types of nanowires show substantially higher normalized-to-blank signal intensity than planar glass surfaces, with the epitaxy platforms performing somewhat better, owing to a higher density of nanowires. With further optimization, aerotaxy nanowires thus offer a pathway to scalable, low-cost production of highly sensitive nanowire-based platforms for optical biosensing applications.


Conflict of interest statement

The authors declare the following competing financial interest(s): Sudhakar Sivakumar, Yuyu Li and Patrick Flatt are employees of AlignedBio AB. Heiner Linke, Nicklas Anttu, Christelle N. Prinz, and Fredrik Hk have financial interests in AlignedBio AB.

Figures

Figure 1
Figure 1
(a) Schematic representation of a single, vertical nanowire, illustrating the lightguiding effect which occurs when light emitted by a fluorophore bound to the nanowire surface is collected and re-emitted at the tip. (b) To functionalize the samples, biotin-conjugated bovine serum albumin (bBSA) is adsorbed to the SiO2 layer covering the nanowire platforms or the glass, respectively (I). Then, Alexa Fluor 647-labeled streptavidin (StvA647) binds with high specificity to biotin (II). The three sensing surfaces present different morphological and surface properties: (c) aerotaxy Ga(As)P nanowires, with a SiO2 coating of thickness tc ≈ 30 nm, embedded in a polymer film that is not coated with SiO2. The aerotaxy nanowires are tapered, with an average diameter of dT ≈ 90 nm at their thin end and dW ≈ 137 nm at their wide end. The orientation of aerotaxy nanowires varies randomly, and the wide end of each individual nanowire can be either at the top or the bottom. (d) Epitaxy GaP nanowires have an average dT ≈ 98 nm at the tip and average dW ≈ 104 nm at the base and are grown on a GaP substrate, with a SiO2 layer (tc ≈ 10 nm) on nanowires and substrates. (e) Planar glass surface, with a SiO2 layer (tc ≈ 10 nm). (More details are shown in Table 1).
Figure 2
Figure 2
(a) Representative scanning electron microscopy (SEM) images of aerotaxy Ga(As)P nanowires (stage tilt 30°) (b) and close-up view on several individual aerotaxy nanowires from different regions, illustrating the heterogeneity in terms of morphology and orientation. (c) Epitaxy GaP nanowires (stage tilt 30°) and (d) close-up view of some epitaxy nanowires. Even though 30% of the epitaxy nanowires are kinked or defective, the remaining 70% exhibit a good homogeneity in morphology, orientation, and pitch.
Figure 3
Figure 3
Examples of image analysis for the calculations of fluorescence intensity on ROIs of the three evaluated surfaces, for high (top row) and low (bottom row) concentrations of StvA647, respectively. (a,b) For aerotaxy Ga(As)P nanowire platforms, the intensity is calculated as the sum of intensity on the localized nanowires (single-nanowire analysis, see Methods and Supporting Information Section 4.2). Left and right are the same image with and without the detections highlighted. (c,d) Epitaxy GaP nanowire platforms were evaluated in the same way as the aerotaxy nanowire platforms. (e,f) On planar glass slides, the intensity is extracted as the sum of intensity per pixel for all the ROIs (bulk analysis, see Methods and Supporting Information Section 4.2). The scale in all images is 0.27 μm/pixel as shown at the bottom right corner. The apparent difference on size between aerotaxy and epitaxy lit nanowires is considered in the analysis in the Section 4 of the Supporting Information).
Figure 4
Figure 4
(a) Sum of signal intensity IS as a function of concentration of StvA647 for aerotaxy nanowires, epitaxy nanowires, and planar controls, as indicated in the legend. (b) IN, the signal intensity of the samples normalized to the blank. (c) Average intensity per nanowire, for all detected bright nanowires INW. In (b), due to the normalization, the value for the blank is always equal to one for the three surfaces. The error bars correspond to the standard deviation as an indication of the dispersion of the measurements of 10 different analyzed ROIs at the same surface and concentration (see Supporting Information Section 4 for details on how error bars are calculated). Note that both the vertical and horizontal axes are displayed on a logarithmic scale.
Figure 5
Figure 5
Comparison of the intensity per bright nanowire (blue squares), and the number of observed bright nanowires (orange dots), as a function of StvA647 concentration for (a) aerotaxy and (b) epitaxy. Three different concentration regimes (I–III) can be distinguished (see main text for discussion). Note that vertical and horizontal axes are displayed on a logarithmic scale.

Similar articles

Cited by

References

    1. Wegner K. D.; Hildebrandt N. Quantum Dots: Bright and Versatile in Vitro and in Vivo Fluorescence Imaging Biosensors. Chem. Soc. Rev. 2015, 44, 4792–4834. 10.1039/C4CS00532E. - DOI - PubMed
    1. Wang R. E.; Zhang Y.; Cai J.; Cai W.; Gao T. Aptamer-Based Fluorescent Biosensors. Curr. Med. Chem. 2011, 18, 4175–4184. 10.2174/092986711797189637. - DOI - PMC - PubMed
    1. Ahmed M. U.; Saaem I.; Wu P. C.; Brown A. S. Personalized Diagnostics and Biosensors: A Review of the Biology and Technology Needed for Personalized Medicine. Crit. Rev. Biotechnol. 2014, 34, 180–196. 10.3109/07388551.2013.778228. - DOI - PubMed
    1. Andersson-Engels S.; Klinteberg C. A.; Svanberg K.; Svanberg S. In Vivo Fluorescence Imaging for Tissue Diagnostics. Phys. Med. Biol. 1997, 42, 815–824. 10.1088/0031-9155/42/5/006. - DOI - PubMed
    1. Borrebaeck C. A. K.; Wingren C. Design of High-Density Antibody Microarrays for Disease Proteomics: Key Technological Issues. J. Proteomics 2009, 72, 928–935. 10.1016/j.jprot.2009.01.027. - DOI - PubMed