

Human Immunocompetent Model of Neuroendocrine Liver Metastases Recapitulates Patient-Specific Tumour Microenvironment
- PMID: 35909511
- PMCID: PMC9326114
- DOI: 10.3389/fendo.2022.909180
Human Immunocompetent Model of Neuroendocrine Liver Metastases Recapitulates Patient-Specific Tumour Microenvironment
Abstract
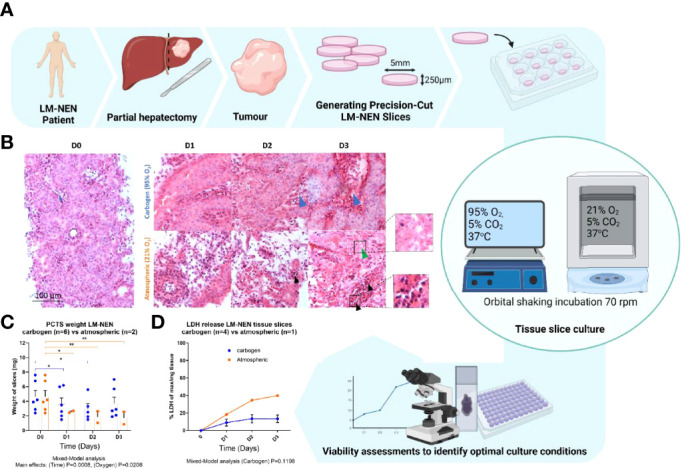
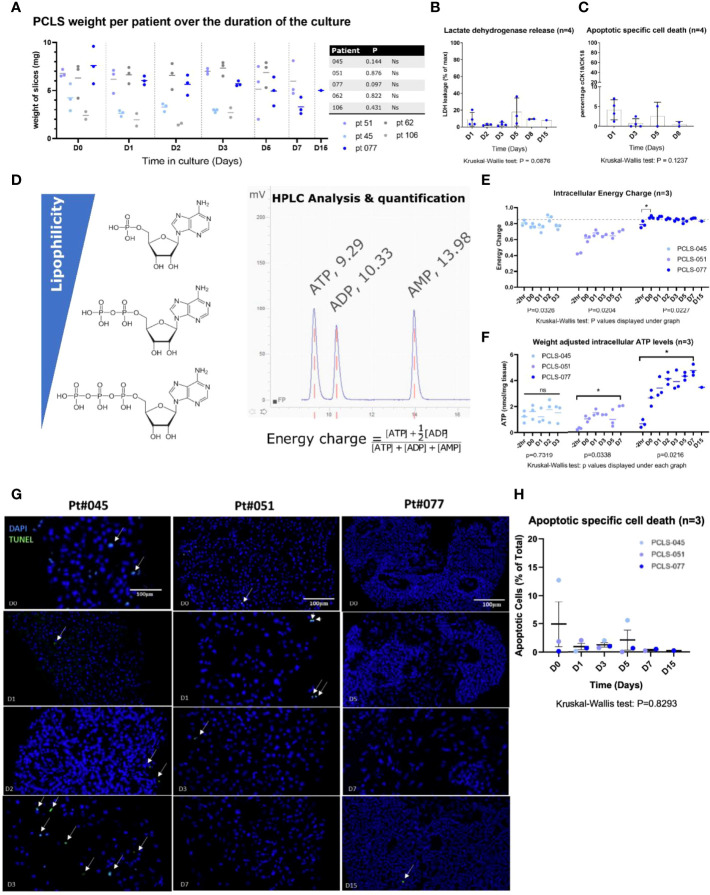
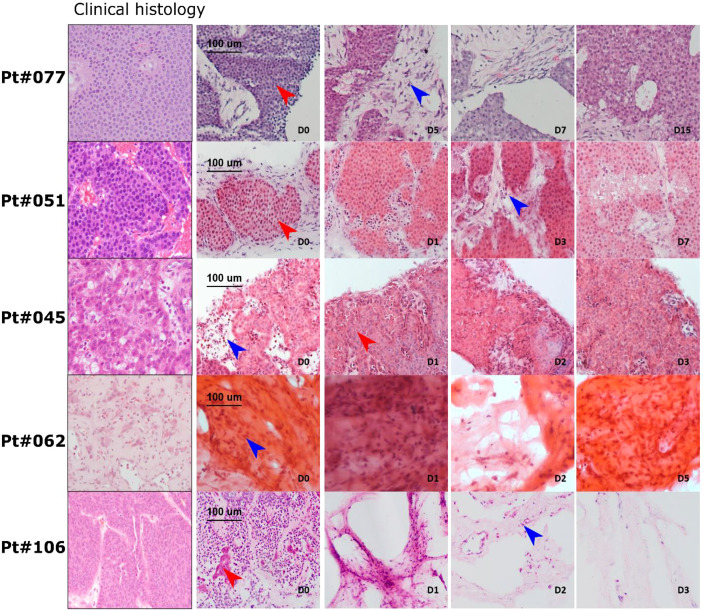
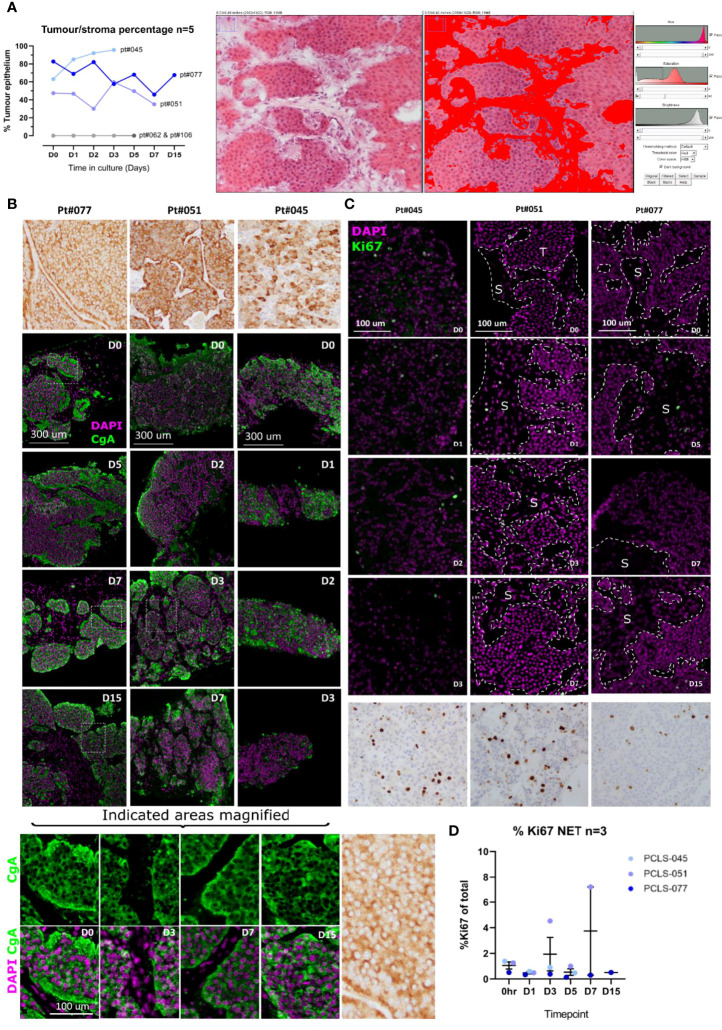
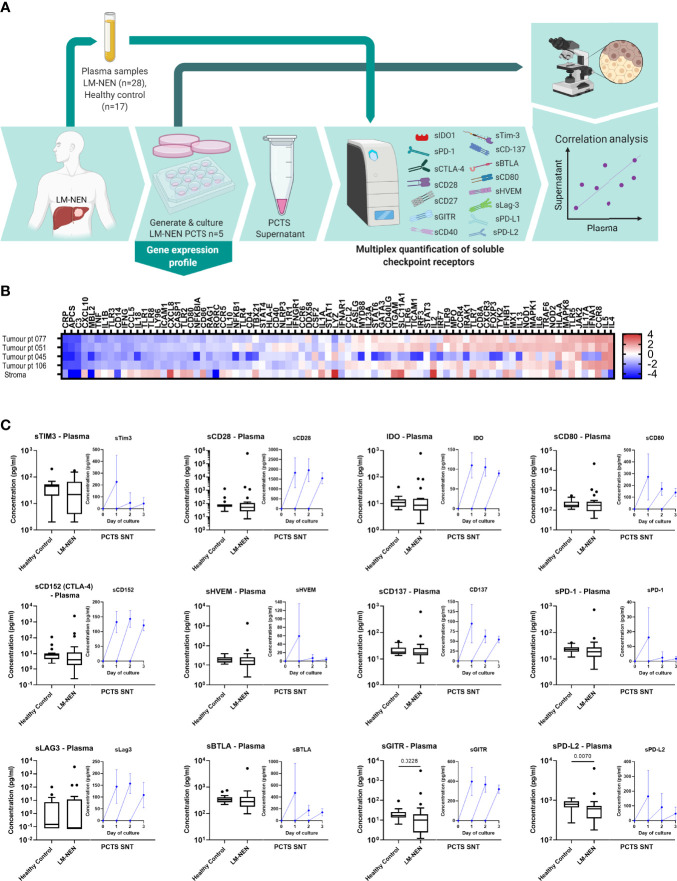
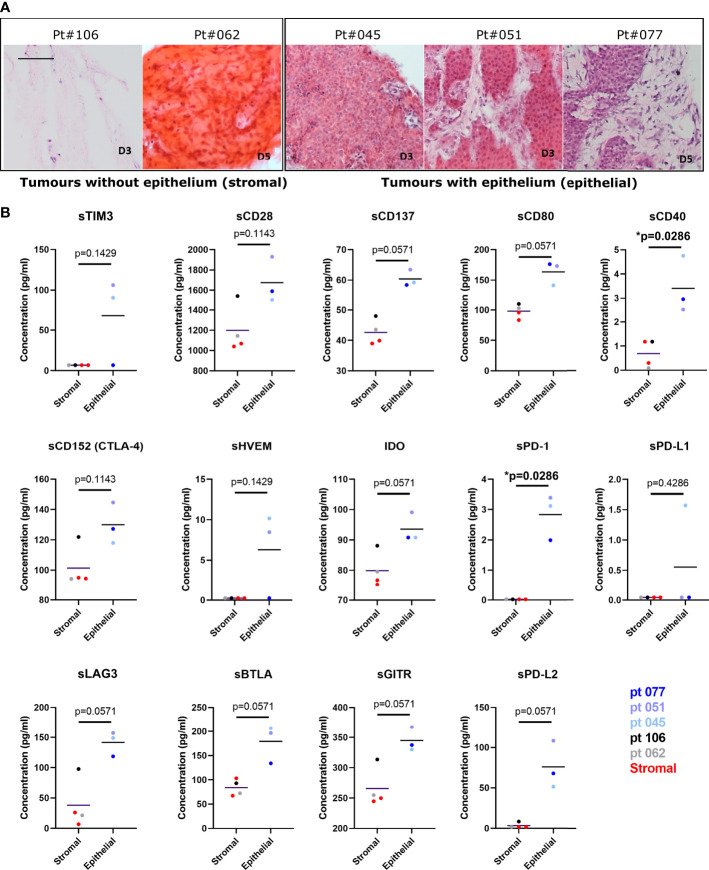
Neuroendocrine liver metastases (LM-NEN) develop in a considerable proportion of patients with gastroenteropancreatic neuroendocrine neoplasms. There is a paucity of experimental models that accurately recapitulate this complex metastatic human liver microenvironment precluding scientific and clinical advancements. Here, we describe the development of a novel personalised immunocompetent precision cut tumour slice (PCTS) model for LM-NEN using resected human liver tissue. The histological assessment throughout the culture demonstrated that slices maintain viability for at least 7 days and retain the cellular heterogeneity of the original tumour. Essential clinical features, such as patient-specific histoarchitecture, tumour grade, neuroendocrine differentiation and metabolic capacity, are preserved in the slices. The PCTS also replicate the tumor-specific immunological profile as shown by the innate and adaptive immunity markers analysis. Furthermore, the study of soluble immune checkpoint receptors in the culture supernatants proves that these immunomodulators are actively produced by LM-NEN and suggests that this process is epithelium-dependent. This model can be employed to investigate these pathways and provides a powerful platform for mechanistic, immunological and pre-clinical studies.
Keywords: ex vivo model; immune checkpoint receptor; neuroendocrine liver metastases; soluble immunomodulators; tissue slices; tumour modeling.
Copyright © 2022 Doornebal, Harris, Riva, Jagatia, Pizanias, Prachalias, Menon, Preziosi, Zamalloa, Miquel, Zen, Orford, Eaton, Heaton, Ramage, Palma, Srirajaskanthan and Chokshi.
Conflict of interest statement
The authors declare that the research was conducted in the absence of any commercial or financial relationships that could be construed as a potential conflict of interest.
Figures
Similar articles
-
Patient-derived precision cut tissue slices from primary liver cancer as a potential platform for preclinical drug testing.EBioMedicine. 2023 Nov;97:104826. doi: 10.1016/j.ebiom.2023.104826. Epub 2023 Oct 10. EBioMedicine. 2023. PMID: 37806285 Free PMC article.
-
Comprehensive single-cell atlas of colorectal neuroendocrine tumors with liver metastases: unraveling tumor microenvironment heterogeneity between primary lesions and metastases.Mol Cancer. 2025 Jan 21;24(1):28. doi: 10.1186/s12943-025-02231-y. Mol Cancer. 2025. PMID: 39838423 Free PMC article.
-
Lung Metastases in Patients with Well-Differentiated Gastroenteropancreatic Neuroendocrine Neoplasms: An Appraisal of the Validity of Thoracic Imaging Surveillance.Neuroendocrinology. 2019;108(4):308-316. doi: 10.1159/000497183. Epub 2019 Jan 23. Neuroendocrinology. 2019. PMID: 30673674
-
Where Are We Now with Liver Transplantation in Neuroendocrine Neoplasms? The Place of Liver Transplantation for Grades 1 and 2 Well-Differentiated Unresectable Liver Metastatic Neuroendocrine Tumours.Curr Oncol Rep. 2023 Feb;25(2):135-144. doi: 10.1007/s11912-022-01343-8. Epub 2023 Jan 17. Curr Oncol Rep. 2023. PMID: 36648705 Review.
-
[Liver metastases from neuroendocrine tumours of the gastroenteropancreatic system--therapeutic strategies].Zentralbl Chir. 2009 Sep;134(5):410-7. doi: 10.1055/s-0029-1224607. Epub 2009 Sep 15. Zentralbl Chir. 2009. PMID: 19757340 Review. German.
Cited by
-
Human Precision-Cut Liver Slices: A Potential Platform to Study Alcohol-Related Liver Disease.Int J Mol Sci. 2023 Dec 21;25(1):150. doi: 10.3390/ijms25010150. Int J Mol Sci. 2023. PMID: 38203321 Free PMC article.
-
Preclinical Models of Hepatocellular Carcinoma: Current Utility, Limitations, and Challenges.Biomedicines. 2024 Jul 22;12(7):1624. doi: 10.3390/biomedicines12071624. Biomedicines. 2024. PMID: 39062197 Free PMC article. Review.
-
Breast Cancer Tissue Explants: An Approach to Develop Personalized Therapy in Public Health Services.J Pers Med. 2023 Oct 23;13(10):1521. doi: 10.3390/jpm13101521. J Pers Med. 2023. PMID: 37888132 Free PMC article.
-
Patient-derived precision cut tissue slices from primary liver cancer as a potential platform for preclinical drug testing.EBioMedicine. 2023 Nov;97:104826. doi: 10.1016/j.ebiom.2023.104826. Epub 2023 Oct 10. EBioMedicine. 2023. PMID: 37806285 Free PMC article.
-
Alcohol-Associated Liver Disease Outcomes: Critical Mechanisms of Liver Injury Progression.Biomolecules. 2024 Mar 27;14(4):404. doi: 10.3390/biom14040404. Biomolecules. 2024. PMID: 38672422 Free PMC article. Review.
References
-
- Hentic O, Couvelard A, Rebours V, Zappa M, Dokmak S, Hammel P, et al. . Ki-67 Index, Tumor Differentiation, and Extent of Liver Involvement are Independent Prognostic Factors in Patients With Liver Metastases of Digestive Endocrine Carcinomas. Endocr-Relate Canc (2011) 18(1):51–9. doi: 10.1677/ERC-09-0319 - DOI - PubMed
Publication types
MeSH terms
LinkOut - more resources
Full Text Sources
Medical
Molecular Biology Databases