Network Pharmacology Integrated Molecular Docking to Explore the Mechanism of Blister Beetle Therapy for Lung Adenocarcinoma
- PMID: 35909589
- PMCID: PMC9303499
- DOI: 10.1155/2022/1892384
Network Pharmacology Integrated Molecular Docking to Explore the Mechanism of Blister Beetle Therapy for Lung Adenocarcinoma
Abstract
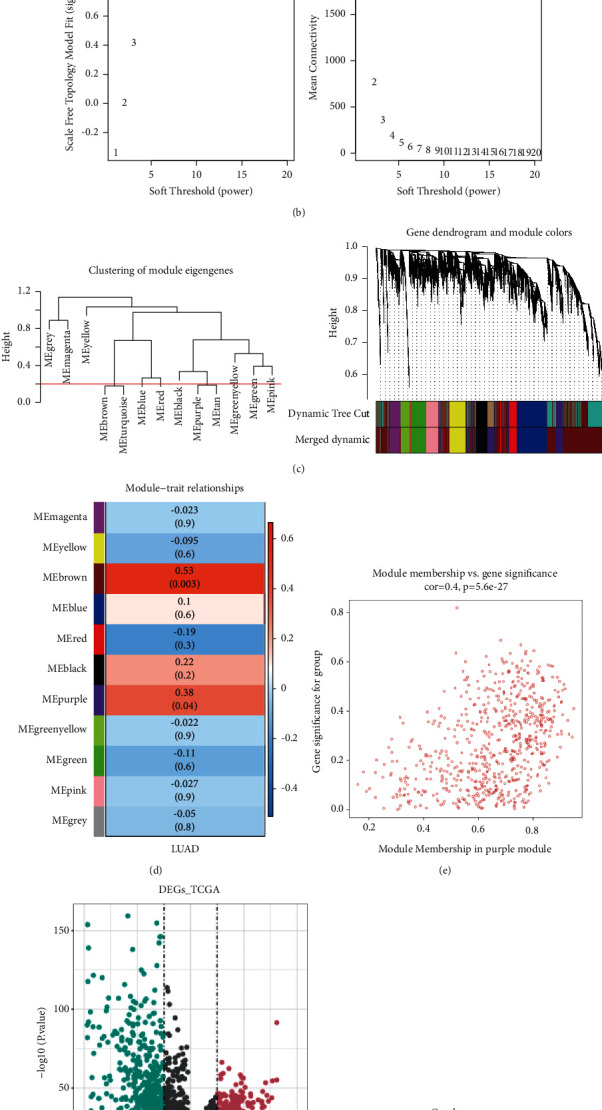
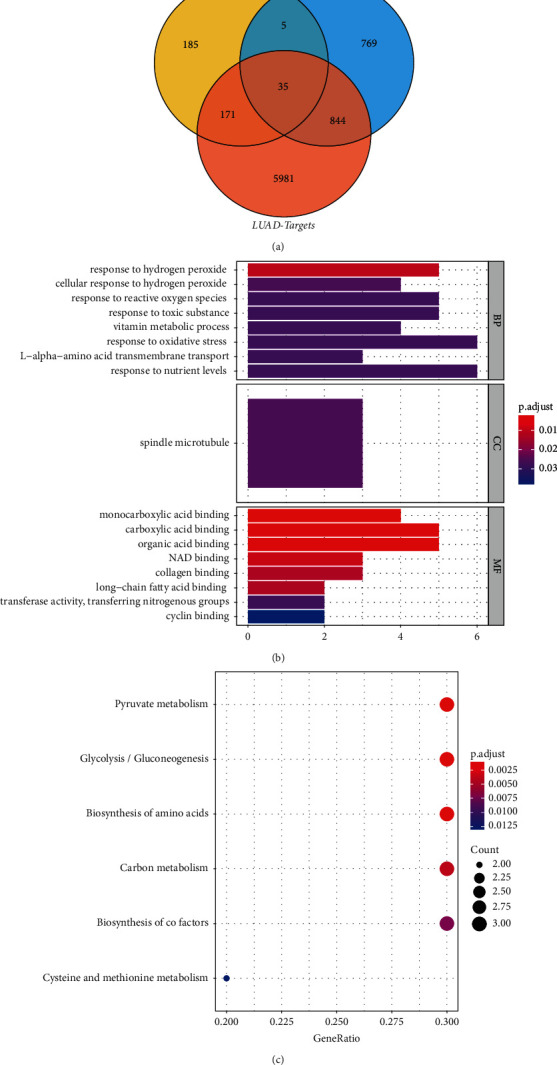
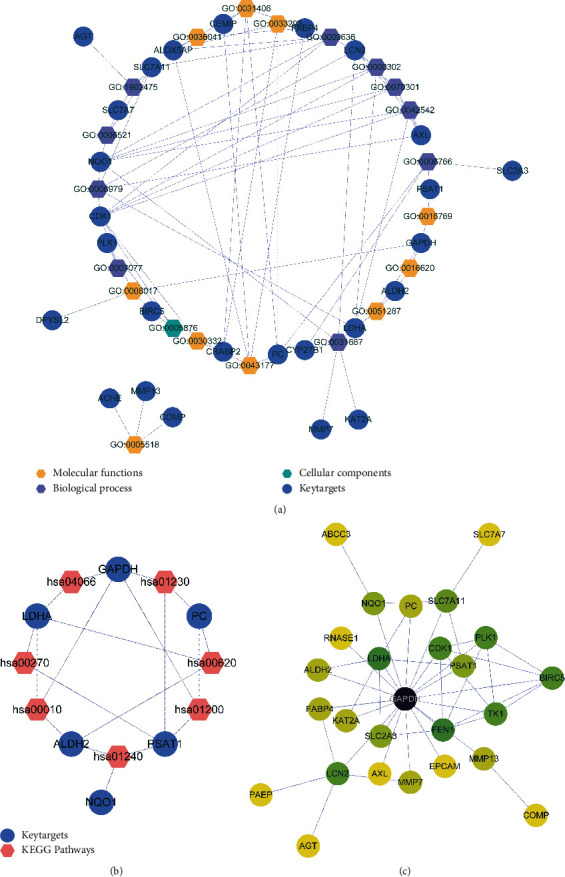
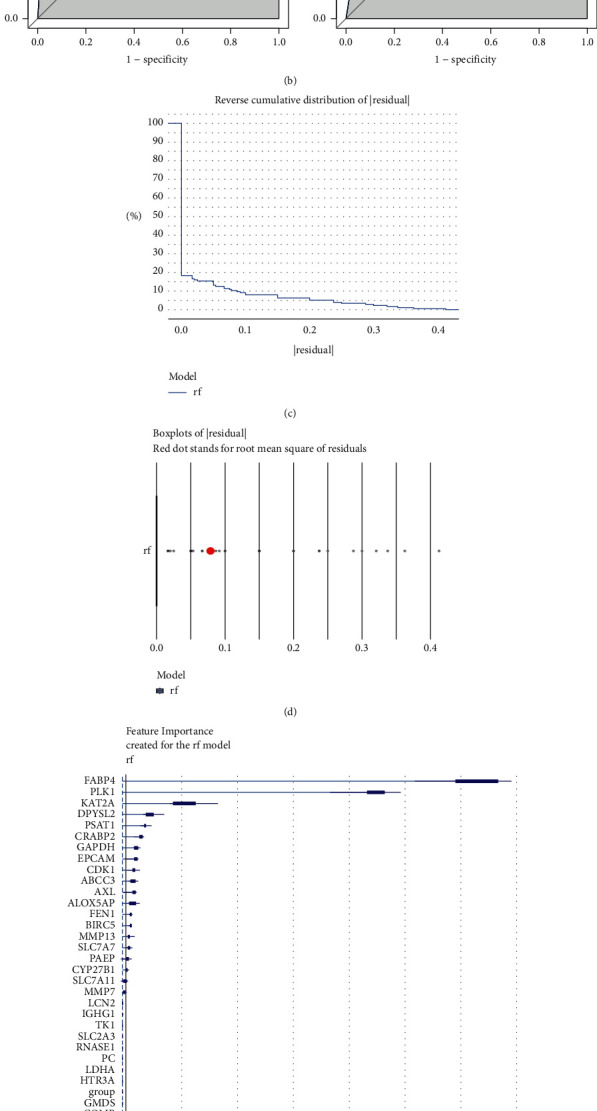
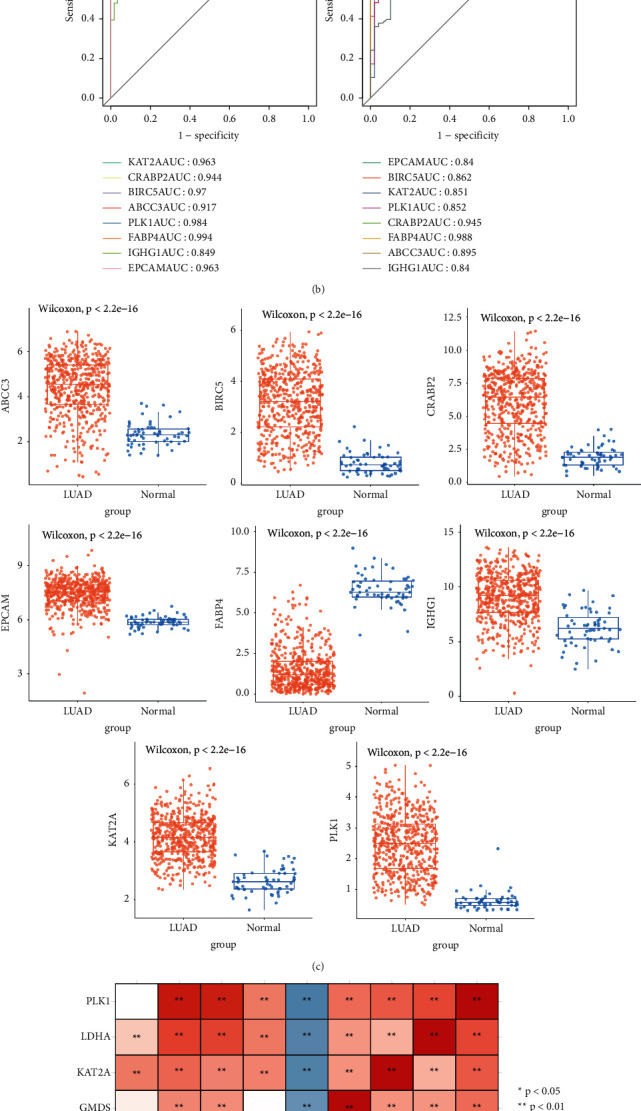
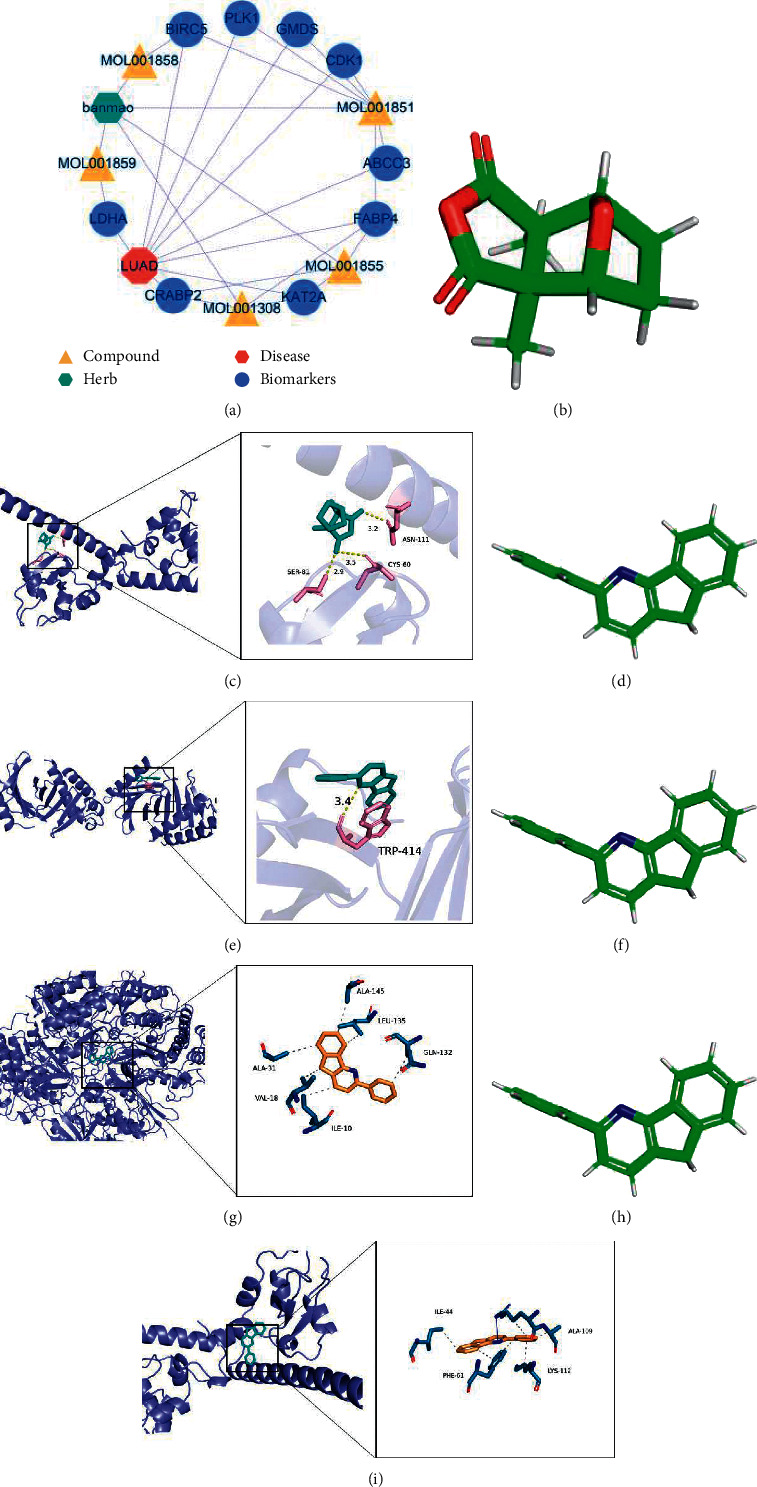
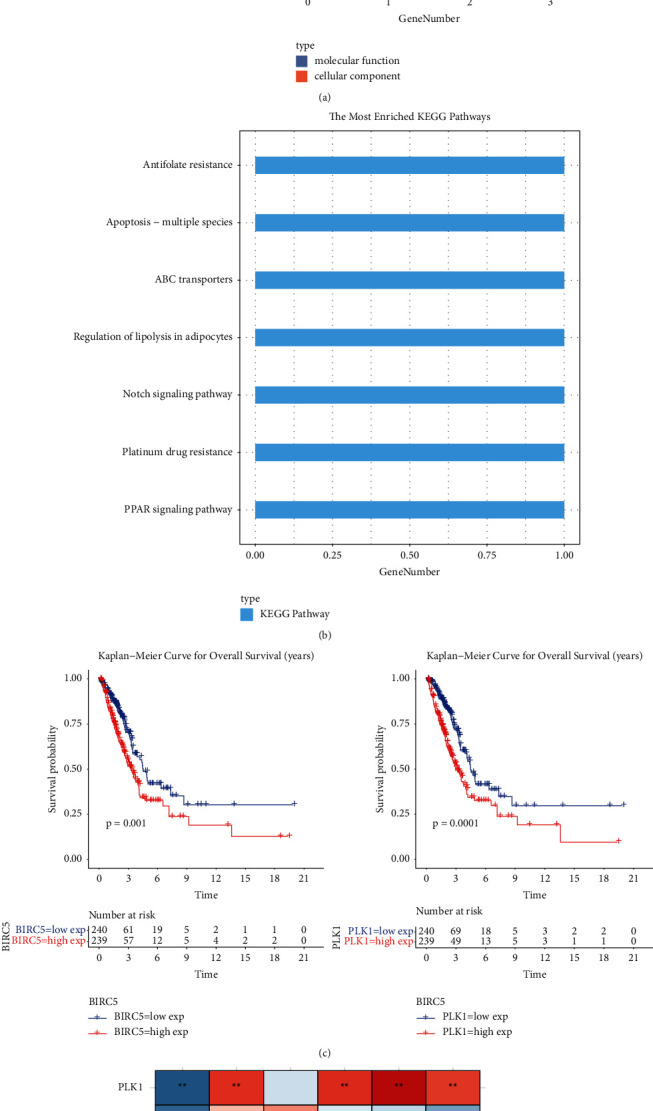
Lung adenocarcinoma (LUAD) is one of the major causes of cancer death in the world. Studies show that the effective anticancer component in blister beetles is cantharidin, which can improve chemotherapy efficacy, median survival, and prognosis of LUAD. However, the antitumor mechanism of blister beetles has not been fully clarified. This study aimed to identify the key targets of the treatment of LUAD by blister beetles based on the principle of network pharmacology. An integrated approach including network pharmacology and a molecular docking technique was conducted, which mainly comprises target prediction, weighted gene correlation network analysis (WGCNA) analysis, network construction, gene ontology, and pathway enrichment analysis. 35 key targets were obtained and significantly associated with response to external stimuli, collagen binding, cyclin binding, organic acid binding, pyruvate metabolism, glycolysis, and amino acid biosynthesis pathways. Both LASSO regression and the RF model had a high predictive ability, and 9 candidate genes were screened, among which BIRC5 and PLK1 were the key targets for the treatment of LUAD by using blister beetles and showed significant survival significance. Cantharidin exerts its antitumor effects through 8 targets in 32 pathways, while BIRC5 and PLK1 have obvious survival significance.
Copyright © 2022 Shoujun Deng et al.
Conflict of interest statement
The authors declare that they have no conflicts of interest.
Figures
Similar articles
-
Exploring the mechanism of 6-Methoxydihydrosanguinarine in the treatment of lung adenocarcinoma based on network pharmacology, molecular docking and experimental investigation.BMC Complement Med Ther. 2024 May 23;24(1):202. doi: 10.1186/s12906-024-04497-z. BMC Complement Med Ther. 2024. PMID: 38783288 Free PMC article.
-
Molecular and metabolic mechanisms of bufalin against lung adenocarcinoma: New and comprehensive evidences from network pharmacology, metabolomics and molecular biology experiment.Comput Biol Med. 2023 May;157:106777. doi: 10.1016/j.compbiomed.2023.106777. Epub 2023 Mar 11. Comput Biol Med. 2023. PMID: 36924737
-
[Effect of "Hedyotis Diffusae Herba-Smilacis Glabrae Rhizoma" in treatment of lung adenocarcinoma based on network pharmacology].Zhongguo Zhong Yao Za Zhi. 2021 Dec;46(23):6261-6270. doi: 10.19540/j.cnki.cjcmm.20210913.401. Zhongguo Zhong Yao Za Zhi. 2021. PMID: 34951253 Chinese.
-
Oedemerid blister beetle dermatosis: a review.J Am Acad Dermatol. 1990 May;22(5 Pt 1):815-9. doi: 10.1016/0190-9622(90)70114-w. J Am Acad Dermatol. 1990. PMID: 2189910 Review.
-
Cantharidin.Vet Clin North Am Equine Pract. 2024 Apr;40(1):113-119. doi: 10.1016/j.cveq.2023.08.002. Epub 2023 Sep 15. Vet Clin North Am Equine Pract. 2024. PMID: 37716858 Review.
References
-
- Wang J., Li G., Yu L., Mo T., Wu Q., Zhou Z. Aidi injection plus platinum-based chemotherapy for stage IIIB/IV non-small cell lung cancer: a meta-analysis of 42 RCTs following the PRISMA guidelines. Journal of Ethnopharmacology . 2018;221:137–150. - PubMed
-
- Hong Q. Y., Wu G. M., Qian G. S. Prevention and management of lung cancer in China. Cancer . 2015;121:3080–3088. - PubMed
-
- Zheng R. S., Sun K. X., Zhang S. W. Report of cancer epidemiology in China. Zhonghua Zhongliu Zazhi . 2019;41(1):19–28. - PubMed
-
- Zheng M. Classification and pathology of lung cancer. Surgical Oncology Clinics of North America . 2016;25(3):447–468. - PubMed
Publication types
MeSH terms
Substances
LinkOut - more resources
Full Text Sources
Medical
Miscellaneous