

Antimicrobial susceptibility testing for Gram positive cocci towards vancomycin using scanning electron microscopy
- PMID: 35909629
- PMCID: PMC9325908
- DOI: 10.1016/j.crmicr.2022.100154
Antimicrobial susceptibility testing for Gram positive cocci towards vancomycin using scanning electron microscopy
Abstract
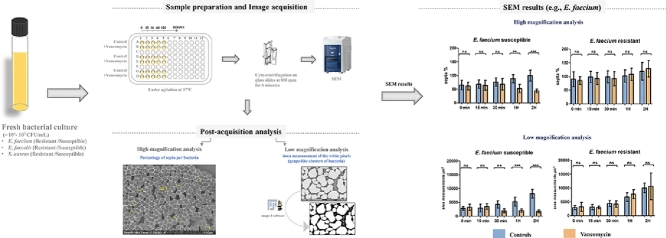
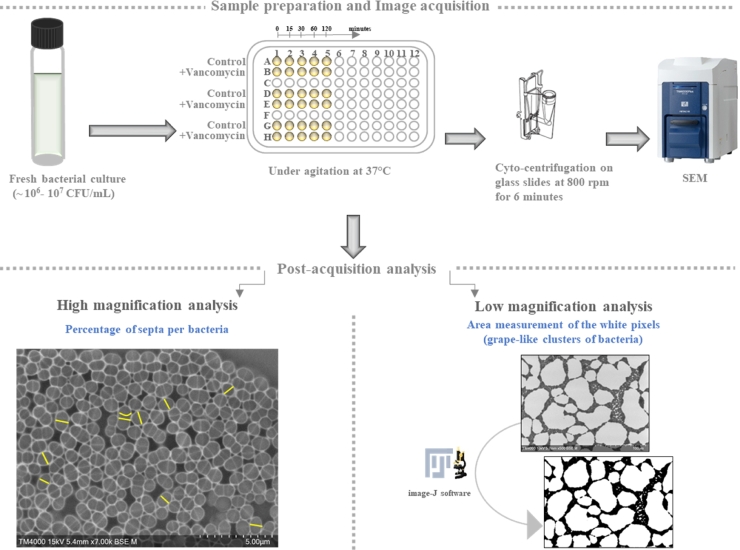
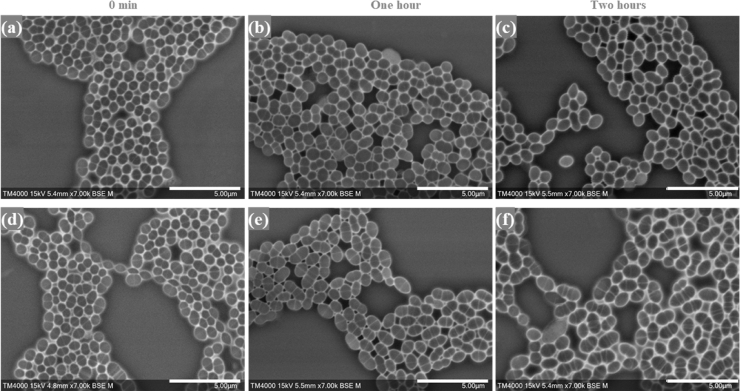
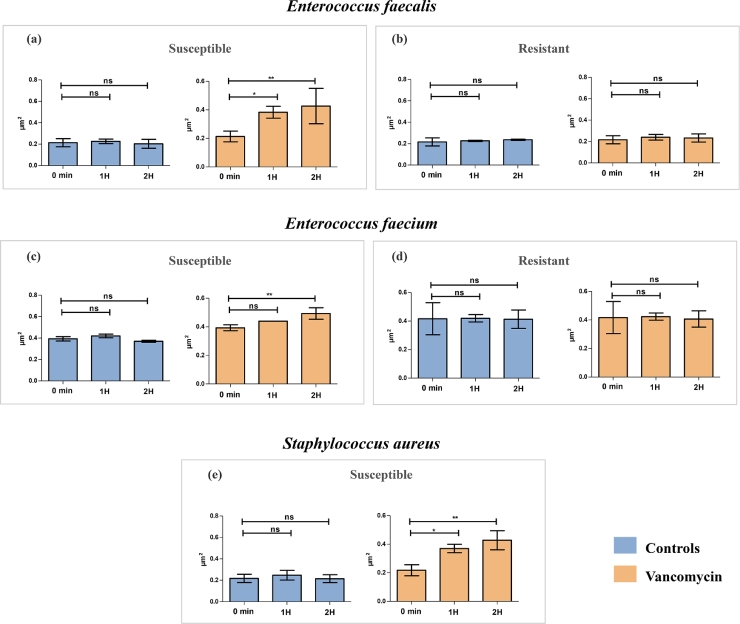
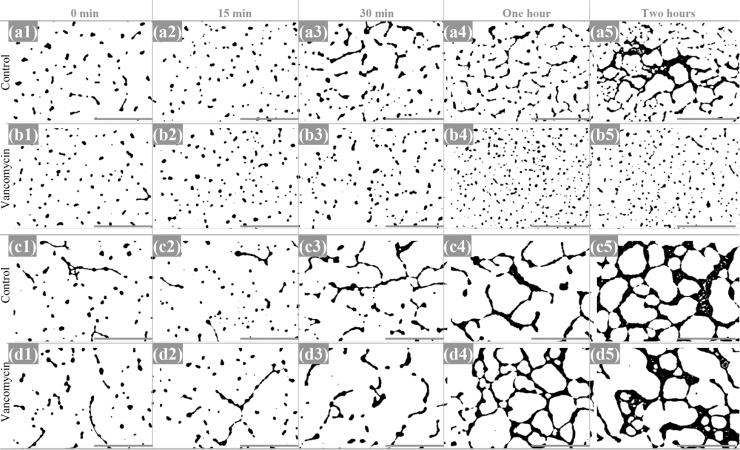
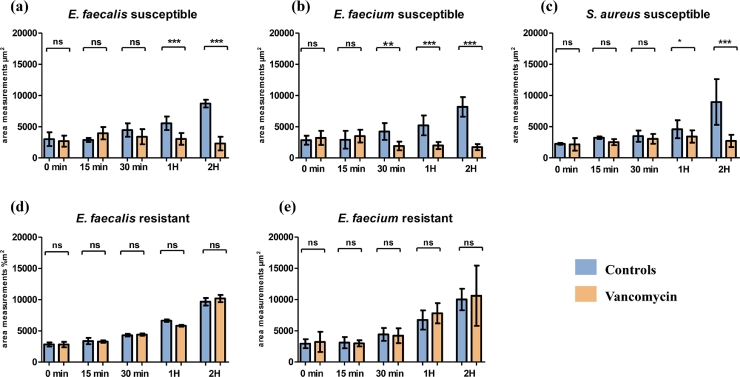
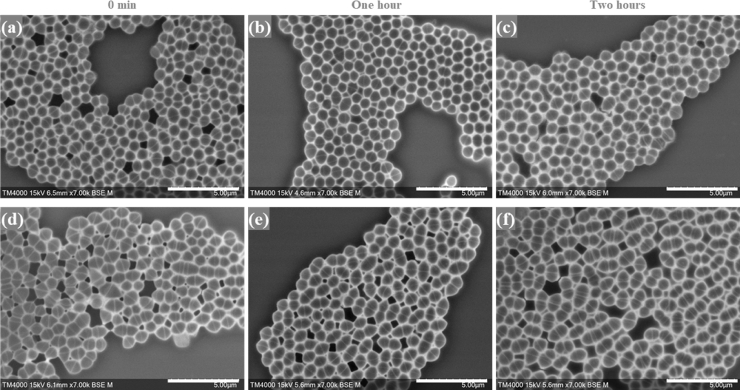
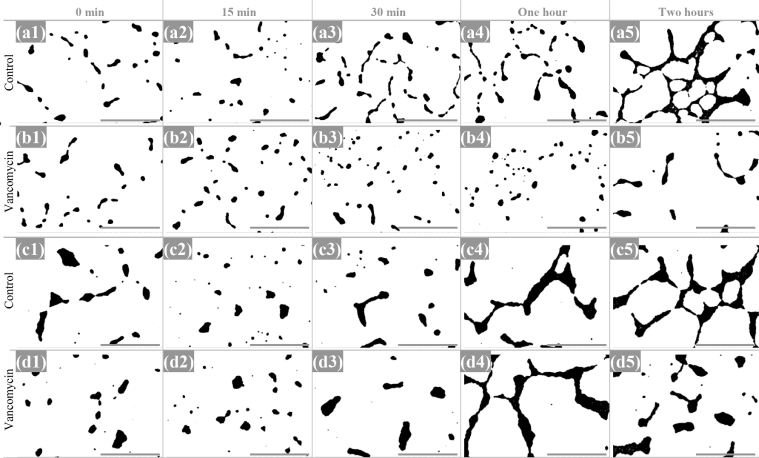
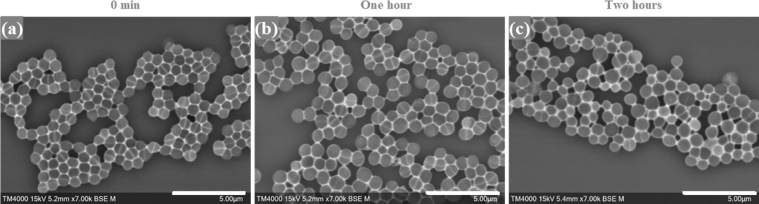
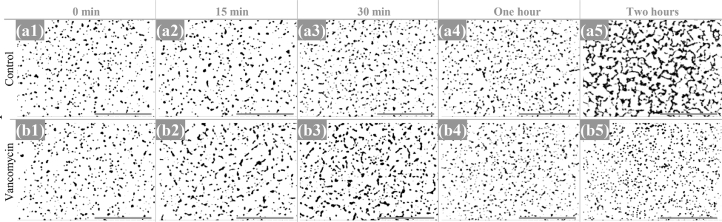
The rapid detection of resistant bacteria has become a challenge for microbiologists worldwide. Numerous pathogens that cause nosocomial infections are still being treated empirically and have developed resistance mechanisms against key antibiotics. Thus, one of the challenges for researchers has been to develop rapid antimicrobial susceptibility testing (AST) to detect resistant isolates, ensuring better antibiotic stewardship. In this study, we established a proof-of-concept for a new strategy of phenotypic AST on Gram-positive cocci towards vancomycin using scanning electron microscopy (SEM). Our study evaluated the profiling of Enterococcus faecalis, Enterococcus faecium and Staphylococcus aureus after brief incubation with vancomycin. Sixteen isolates were analysed aiming to detect ultrastructural modifications at set timepoints, comparing bacteria with and without vancomycin. After optimising slides preparation and micrographs acquisition, two analytical strategies were used. The high magnification micrographs served to analyse the division of cocci based on the ratio of septa, along with the bacterial size. Susceptible strains with vancomycin showed a reduced septa percentage and the average surface area was consequently double that of the controls. The resistant bacteria revealed multiple septa occurring at advanced timepoints. Low magnification micrographs made it possible to quantify the pixels at different timepoints, confirming the profiling of cocci towards vancomycin. This new phenotypic AST strategy proved to be a promising tool to discriminate between resistant and susceptible cocci within an hour of contact with vancomycin. The analysis strategies applied here would potentially allow the creation of artificial intelligence algorithms for septa detection and bacterial quantification, subsequently creating a rapid automated SEM-AST assay.
Keywords: Enterococcus; Gram-positive cocci; Microbiology; Rapid AST; Scanning electron microscopy; Staphylococcus; Vancomycin.
© 2022 The Author(s). Published by Elsevier B.V.
Conflict of interest statement
Authors would like to declare that D.R. was a consultant in microbiology for the Hitachi High-Tech Corporation from March 2018 until March 2021. Y.O. is employed by the company Hitachi High-Tech Corporation. AH is employed by the company Hitachi, Ltd. Personal fees of G.H., S.B., A.F. and J.B. are paid through a collaborative contract from the company Hitachi High-Tech Corporation. The remaining authors declare that the research was conducted in the absence of any commercial or financial relationships that could be construed as a potential conflict of interest.
Figures

Similar articles
-
[Distribution and antibiotic resistance analysis of Gram positive cocci in bloodstream infections in a hospital in Inner Mongolia].Zhonghua Yu Fang Yi Xue Za Zhi. 2024 Aug 6;58(8):1242-1246. doi: 10.3760/cma.j.cn112150-20231120-00354. Zhonghua Yu Fang Yi Xue Za Zhi. 2024. PMID: 39142895 Chinese.
-
[Microbiological profiles of pathogens causing nosocomial bacteremia in 2011, 2013 and 2016].Sheng Wu Gong Cheng Xue Bao. 2018 Aug 25;34(8):1205-1217. doi: 10.13345/j.cjb.180192. Sheng Wu Gong Cheng Xue Bao. 2018. PMID: 30152206 Chinese.
-
[Distribution and Antibiotic Resistance Analysis of Ocular Bacterial Pathogens at a Tertiary Hospital From 2012 to 2021].Sichuan Da Xue Xue Bao Yi Xue Ban. 2024 Jan 20;55(1):204-209. doi: 10.12182/20240160103. Sichuan Da Xue Xue Bao Yi Xue Ban. 2024. PMID: 38322538 Free PMC article. Chinese.
-
New antimicrobial agents as therapy for resistant gram-positive cocci.Eur J Clin Microbiol Infect Dis. 2008 Jan;27(1):3-15. doi: 10.1007/s10096-007-0389-y. Eur J Clin Microbiol Infect Dis. 2008. PMID: 17899228 Review.
-
Emerging issues in the diagnosis and management of infections caused by multi-drug-resistant, gram-positive cocci.Surg Infect (Larchmt). 2005;6 Suppl 2:S-5-22. Surg Infect (Larchmt). 2005. PMID: 23577494 Review.
Cited by
-
Antimicrobial Susceptibility Testing for Colistin: Extended Application of Novel Quantitative and Morphologic Assay Using Scanning Electron Microscopy.Int J Microbiol. 2024 May 25;2024:8917136. doi: 10.1155/2024/8917136. eCollection 2024. Int J Microbiol. 2024. PMID: 38827502 Free PMC article.
-
Next-generation rapid phenotypic antimicrobial susceptibility testing.Nat Commun. 2024 Nov 9;15(1):9719. doi: 10.1038/s41467-024-53930-x. Nat Commun. 2024. PMID: 39521792 Free PMC article. Review.
References
-
- Baker C.N., Stocker S.A., Culver D.H., Thornsberry C. Comparison of the E Test to agar dilution, broth microdilution, and agar diffusion susceptibility testing techniques by using a special challenge set of bacteria. J. Clin. Microbiol. 1991;29:533–538. doi: 10.1128/jcm.29.3.533-538.1991. - DOI - PMC - PubMed
LinkOut - more resources
Full Text Sources
