Genetic and Biochemical Investigation of Seed Fatty Acid Accumulation in Arabidopsis
- PMID: 35909728
- PMCID: PMC9328158
- DOI: 10.3389/fpls.2022.942054
Genetic and Biochemical Investigation of Seed Fatty Acid Accumulation in Arabidopsis
Abstract
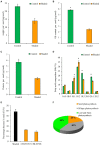
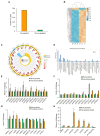
As a vegetable oil, consisting principally of triacylglycerols, is the major storage form of photosynthetically-fixed carbon in oilseeds which are of significant agricultural and industrial value. Photosynthesis in chlorophyll-containing green seeds, along with photosynthesis in leaves and other green organs, generates ATP and reductant (NADPH and NADH) needed for seed fatty acid production. However, contribution of seed photosynthesis to fatty acid accumulation in seeds have not been well-defined. Here, we report the contribution of seed-photosynthesis to fatty acid production by probing segregating green (photosynthetically-competent) and non-green or yellow (photosynthetically-non-competent) seeds in siliques of an Arabidopsis chlorophyll synthase mutant. Using this mutant, we found that yellow seeds lacking photosynthetic capacity reached 80% of amounts of oil in green seeds at maturity. Combining this with studies using shaded siliques, we determined that seed-photosynthesis accounts for 20% and silique and leaf/stem photosynthesis each account for ~40% of the ATP and reductant for seed oil production. Transmission electron microscopy (TEM) and pyridine nucleotides and ATP analyses revealed that seed photosynthesis provides ATP and reductant for oil production mostly during early development, as evidenced by delayed oil accumulation in non-green seeds. Transcriptomic analyses suggests that the oxidative pentose phosphate pathway could be the source of carbon, energy and reductants required for fatty acid synthesis beyond the early stages of seed development.
Keywords: Arabidopsis; NADPH; chlorophyll synthase; fatty acid biosynthesis; oil bodies; oxidative pentose phosphate pathway; photosynthesis; seed development.
Copyright © 2022 Nwafor, Li, Qin, Li, Zhang, Zhou, Xu, Yin, Cao, He, Xiang, Liu, Guo, Zhou, Cahoon and Zhang.
Conflict of interest statement
The authors declare that the research was conducted in the absence of any commercial or financial relationships that could be construed as a potential conflict of interest.
Figures


Similar articles
-
Important photosynthetic contribution of silique wall to seed yield-related traits in Arabidopsis thaliana.Photosynth Res. 2018 Sep;137(3):493-501. doi: 10.1007/s11120-018-0532-x. Epub 2018 Jun 29. Photosynth Res. 2018. PMID: 29959749
-
The capacity of green oilseeds to utilize photosynthesis to drive biosynthetic processes.Plant Physiol. 2004 Sep;136(1):2700-9. doi: 10.1104/pp.104.047977. Epub 2004 Sep 3. Plant Physiol. 2004. PMID: 15347783 Free PMC article.
-
Transcriptomic comparison of seeds and silique walls from two rapeseed genotypes with contrasting seed oil content.Front Plant Sci. 2023 Jan 13;13:1082466. doi: 10.3389/fpls.2022.1082466. eCollection 2022. Front Plant Sci. 2023. PMID: 36714692 Free PMC article.
-
Seeds as oil factories.Plant Reprod. 2018 Sep;31(3):213-235. doi: 10.1007/s00497-018-0325-6. Epub 2018 Feb 10. Plant Reprod. 2018. PMID: 29429143 Review.
-
Current progress towards the metabolic engineering of plant seed oil for hydroxy fatty acids production.Plant Cell Rep. 2015 Apr;34(4):603-15. doi: 10.1007/s00299-015-1736-6. Epub 2015 Jan 11. Plant Cell Rep. 2015. PMID: 25577331 Review.
Cited by
-
Identifying Candidate Genes Related to the Nutritional Components of Soybean (Glycine max) Sprouts Based on the Transcriptome and Co-Expression Network.Genes (Basel). 2025 Jun 6;16(6):692. doi: 10.3390/genes16060692. Genes (Basel). 2025. PMID: 40565584 Free PMC article.
-
Insights from multi-omics integration into seed germination of Taxus chinensis var mairei.Commun Biol. 2023 Sep 11;6(1):931. doi: 10.1038/s42003-023-05307-x. Commun Biol. 2023. PMID: 37697020 Free PMC article.
-
The critical role of Toxoplasma gondii GRA1 in nutrient salvage.mBio. 2025 Aug 13;16(8):e0124225. doi: 10.1128/mbio.01242-25. Epub 2025 Jun 27. mBio. 2025. PMID: 40576341 Free PMC article.
-
Contribution of the leaf and silique photosynthesis to the seeds yield and quality of oilseed rape (Brassica napus L.) in reproductive stage.Sci Rep. 2023 Mar 23;13(1):4721. doi: 10.1038/s41598-023-31872-6. Sci Rep. 2023. PMID: 36959272 Free PMC article.
-
Regulation of the developmental programs in Toxoplasma by a novel SNF2L-containing chromatin remodeling complex.Nat Commun. 2025 Jul 1;16(1):5757. doi: 10.1038/s41467-025-60795-1. Nat Commun. 2025. PMID: 40593611 Free PMC article.
References
-
- Alberts B., Johnson A., Lewis J., Raff M., Roberts K., Walter P. (2002). Chloroplasts and Photosynthesis. Molecular Biology of the Cell. 4th Edn. New York: Garland Science.
LinkOut - more resources
Full Text Sources
Research Materials

