. 2022 Jul 22:2022:3850674.
doi: 10.1155/2022/3850674. eCollection 2022.

Identification of Six Genes as Diagnostic Markers for Colorectal Cancer Detection by Integrating Multiple Expression Profiles

Affiliations

Identification of Six Genes as Diagnostic Markers for Colorectal Cancer Detection by Integrating Multiple Expression Profiles

Peijie Wu et al. J Oncol. .

Abstract

Background: Many studies have demonstrated the promising utility of DNA methylation and miRNA as biomarkers for colorectal cancer (CRC) early detection. However, mRNA is rarely reported. This study aimed to identify novel fecal-based mRNA signatures.

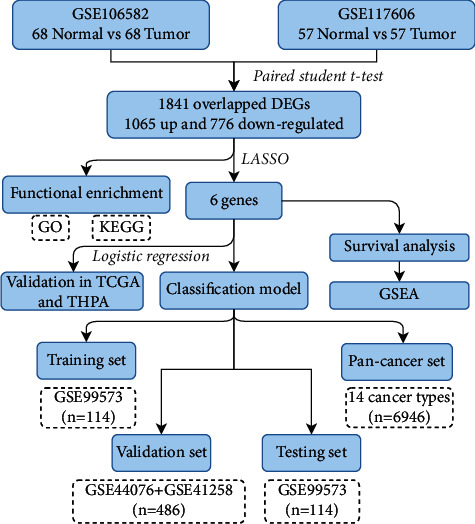
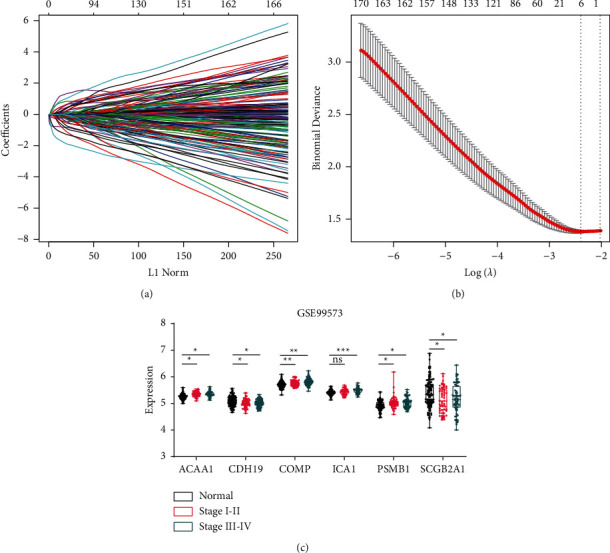
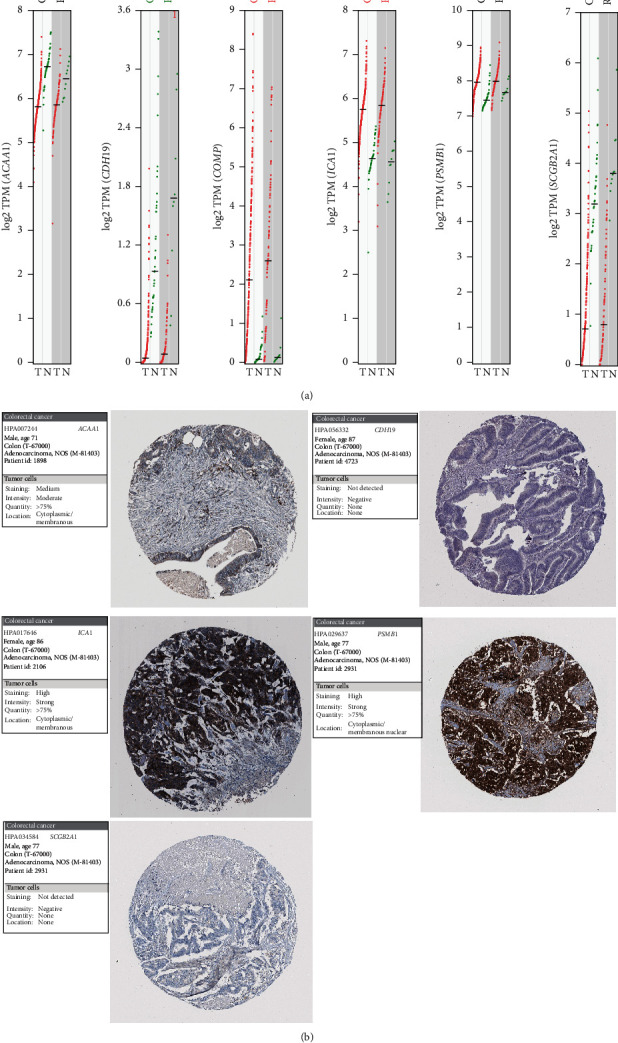
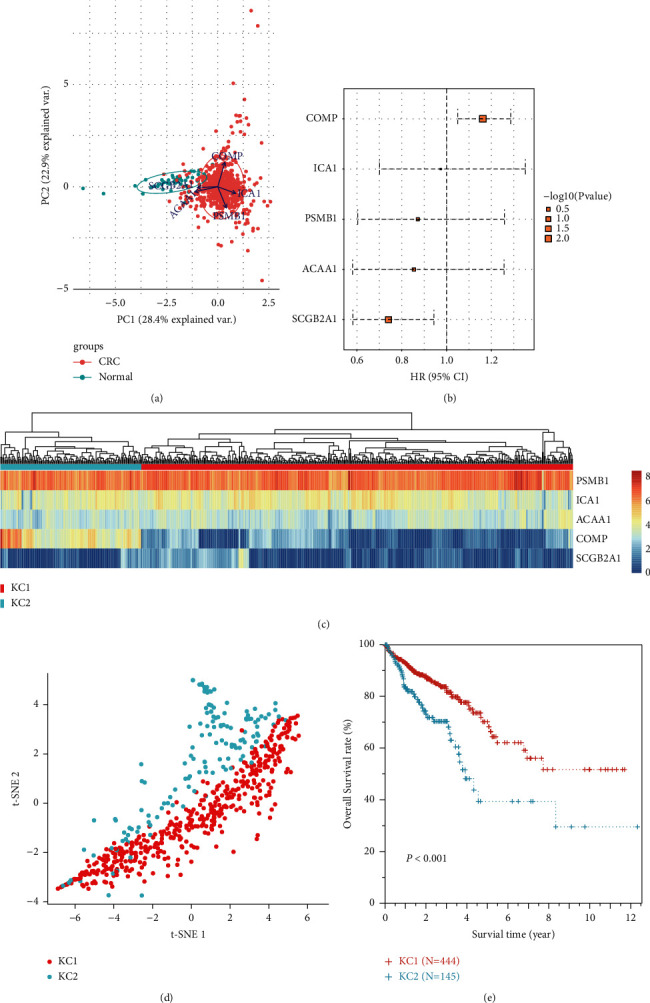
Methods: The differentially expressed genes (DEGs) were first determined between CRCs and matched normal samples by integrating multiple datasets. Then, Least Absolute Shrinkage and Selection Operator (LASSO) regression was used to reduce the number of candidates of aberrantly expressed genes. Next, the potential functions were investigated for the candidate signatures and their ability to detect CRC and pan-cancers was comprehensively evaluated.

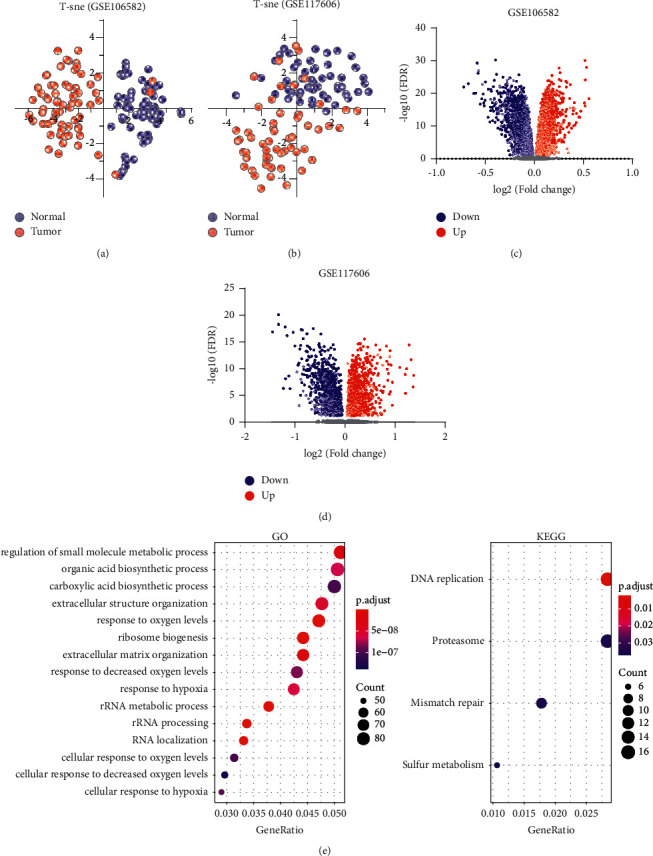
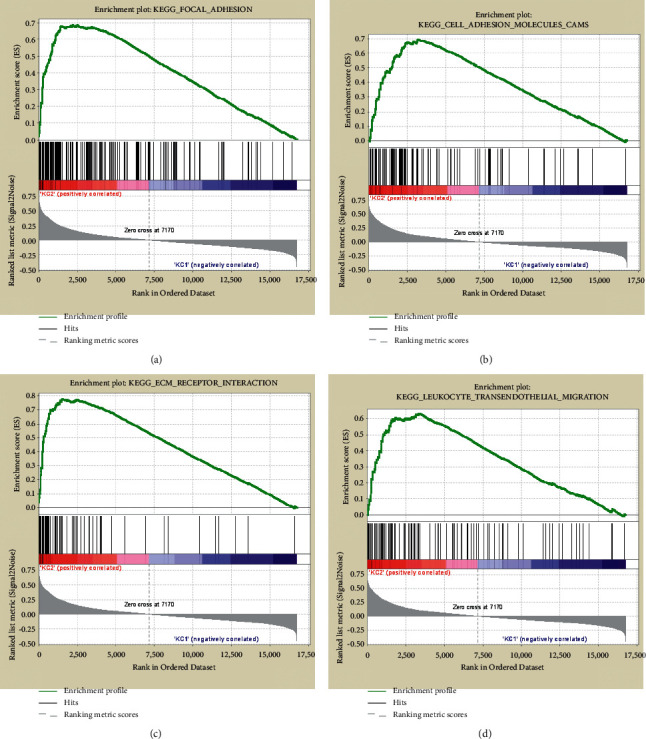
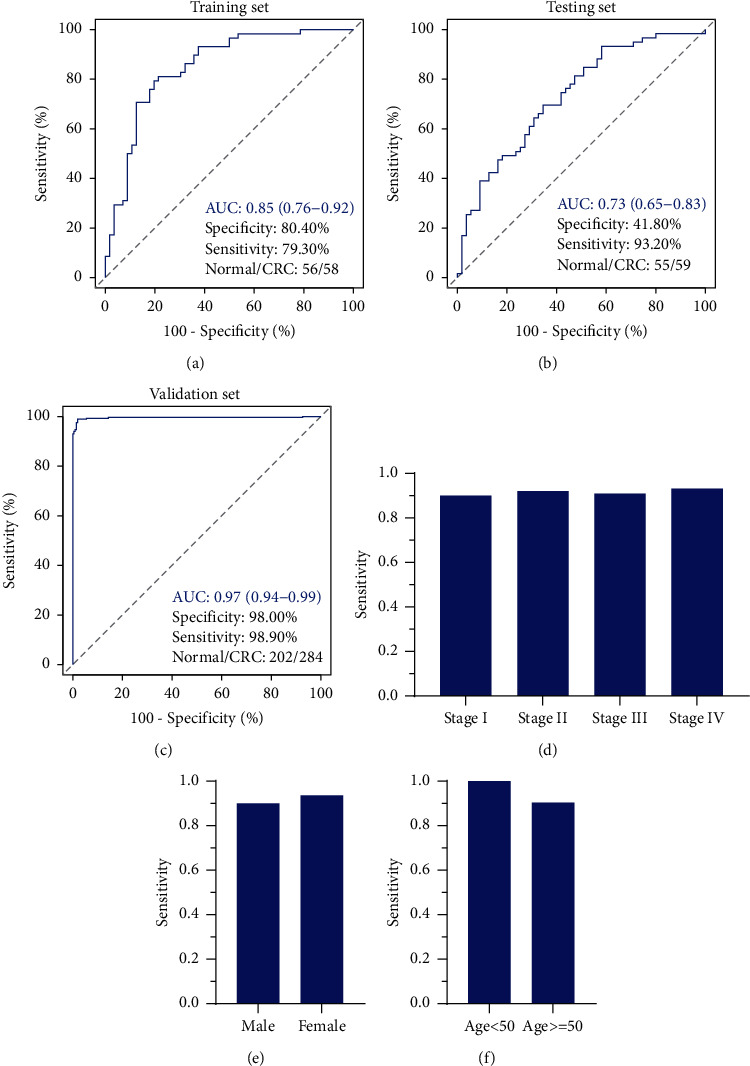
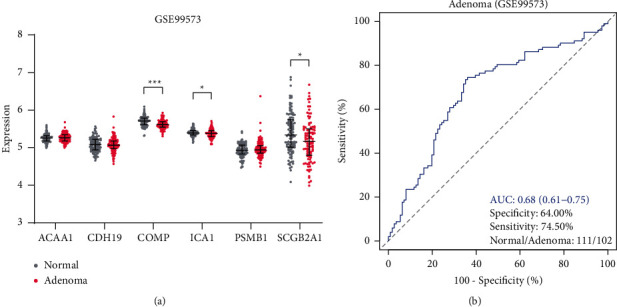
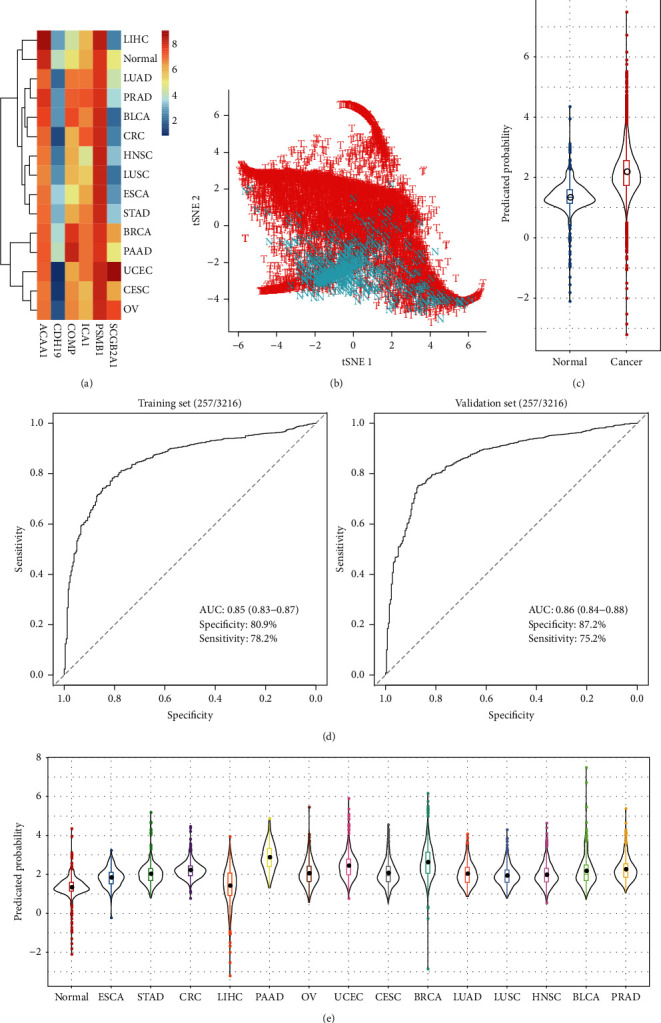
Results: We identified 1841 common DEGs in two independent datasets. Functional enrichment analysis revealed they were mainly related to extracellular structure, biosynthesis, and cell adhesion. The CRC classifier was established based on six genes screened by LASSO regression. Sensitivity, specificity, and area under the ROC curve (AUC) for CRC detection were 79.30%, 80.40%, and 0.85 (0.76-0.92) in the training set, and these indexes achieved 93.20%, 41.80%, and 0.73 (0.65-0.83) in the testing set. For validation set, the sensitivity, specificity, and AUC were 98.90%, 98.00%, and 0.97 (0.94-0.99). The average sensitivities exceeded 90.00% for CRCs with different clinical features. For adenomas detection, the sensitivity and specificity were 74.50% and 64.00%. Besides, the six genes obtained an average AUC of 0.855 for pan-cancer detection.

Conclusion: The six-gene signatures showed ability to detect CRC and pan-cancer samples, which could be served as potential diagnostic markers.


Conflict of interest statement

The authors declare no conflicts of interest.

Figures

Figure 1
Figure 1
Flowchart of this study. DEGs: different expression genes. GO: Gene Ontology. KEGG: Kyoto Encyclopedia of Genes and Genomes. LASSO: Least Absolute Shrinkage and Selection Operator. TCGA: The Cancer Genome Atlas. THPA: The Human Protein Atlas. GSEA: gene set enrichment analysis.
Figure 2
Figure 2
Identification of differentially expressed genes. (a)-(b): t-SNE plots of the tumor and normal samples on GSE106582 (a) and GSE117606 (b) datasets, respectively. The blue dots and red dots represent normal and tumor samples. (c)-(d): Volcano plots show the fold change and FDR of differentially expressed genes identified by GSE106582 (c) and GSE117606 (d) datasets. (e) GO and KEGG enrichment of the overlapped DEGs. Top 15 enriched GO terms are presented.
Figure 3
Figure 3
Six genes identified by LASSO regression. (a) The path of the coefficients against the ℓ1-norm of the whole coefficient vector as λ varies. Each curve represents the track of a variable. The axis above indicates the number of nonzero coefficients at the current λ. (b) The deviances against different λ. Error bars show the 95% confidence intervals of each deviance. The left and right dashed lines indicate the minimized λ (lambda.min) and the 1se lambda, respectively. (c) The expression profiles of the six genes between normal and CRCs which were collected from stool samples. All CRC samples were divided to early stage (I-II) and late stage (III-IV) according to the patient stage.
Figure 4
Figure 4
Validation of the six genes in TCGA CRC dataset and THPA database. (a) Expression profiles of the six genes in TCGA CRCs. COAD: colon adenocarcinoma. READ: rectum adenocarcinoma. The red and green dots indicate the expression values of tumor and normal samples, respectively. Significantly upregulated genes in tumor or normal samples are displayed by the red or green text in the top. (b) Images of immunohistochemistry stained CRC tissues. The examples of five genes were obtained from The Human Protein Atlas.
Figure 5
Figure 5
Survival analysis for the five genes in TCGA dataset. (a) Principal component analysis showing the normal and cancer samples. Arrows originating from the center point represent axes of the five genes. (b) Forest plot showing the hazard ratio (HR) of the five genes. The upper and lower error bars indicate the 95% confidence intervals. Log rank P values are represented by the rectangle size. (c) K-means clustering for CRC samples. The heatmap shows the gene expressions and the upper side bar indicates subgroups (KC1 and KC2). (d) t-SNE analysis showing the two subgroups of CRC samples. The points represent the samples. (e) Survival curves of KC1 and KC2 subgroups.
Figure 6
Figure 6
Gene set expression enrichment in KC1 and KC2 subgroups. GSEA plots showing the four significantly enriched pathways that related to cell adhesion, including FOCAL ADHESION (a), CELL ADHESION MOLECULES CAMS (b), ECM RECEPTOR INTERACTION (c), and LEUKOCYTE TRANSENDOTHELIAL MIGRATION (d).
Figure 7
Figure 7
The performance of the model on training set (a), testing set (b), and validation set (c). (d)–(f): sensitivities of the model in detecting different clinical features CRCs. The sensitivity and specificity were estimated when the AUC values of the model achieved maximum.
Figure 8
Figure 8
Performance of the six-gene classification model for adenomas detection. (a) Expression profiles of the six genes between normal and adenoma samples. (b) ROC curve of the six-gene classification model for the detection of adenomas.
Figure 9
Figure 9
Performance of the six genes for pan-cancer classification. (a) The average expression levels of the six genes in 14 cancer types and normal samples. (b) t-SNE plot showing the normal and cancer samples. (c) Predicated probability of normal and cancer samples. (d) ROC curves for training and validation sets. (e) Predicated probability of normal and cancer samples across the 14 cancer types.

Similar articles

Cited by

References

    1. Bray F., Ferlay J., Soerjomataram I., Siegel R. L., Torre L. A., Jemal A. Global cancer statistics 2018: GLOBOCAN estimates of incidence and mortality worldwide for 36 cancers in 185 countries. CA: A Cancer Journal for Clinicians . 2018;68(6):394–424. doi: 10.3322/caac.21492. - DOI - PubMed
    1. Feng R. M., Zong Y. N., Cao S. M., Xu R. H. Current cancer situation in China: good or bad news from the 2018 Global Cancer Statistics. Cancer Communications . 2019;39(1):p. 22. doi: 10.1186/s40880-019-0368-6. - DOI - PMC - PubMed
    1. Punt C. J. A., Koopman M., Vermeulen L. From tumour heterogeneity to advances in precision treatment of colorectal cancer. Nature Reviews Clinical Oncology . 2017;14(4):235–246. doi: 10.1038/nrclinonc.2016.171. - DOI - PubMed
    1. Wang W., Kandimalla R., Huang H., et al. Molecular subtyping of colorectal cancer: recent progress, new challenges and emerging opportunities. Seminars in Cancer Biology . 2019;55:37–52. doi: 10.1016/j.semcancer.2018.05.002. - DOI - PMC - PubMed
    1. Dai W., Zhou F., Tang D., et al. Single-cell transcriptional profiling reveals the heterogenicity in colorectal cancer. Medicine (Baltimore) . 2019;98(34) doi: 10.1097/md.0000000000016916.e16916 - DOI - PMC - PubMed

LinkOut - more resources