. 2022 Jul 5:2022:9854904.
doi: 10.34133/2022/9854904. eCollection 2022.

lncRNA HITT Inhibits Lactate Production by Repressing PKM2 Oligomerization to Reduce Tumor Growth and Macrophage Polarization

Affiliations

lncRNA HITT Inhibits Lactate Production by Repressing PKM2 Oligomerization to Reduce Tumor Growth and Macrophage Polarization

Kunming Zhao et al. Research (Wash D C). .

Abstract

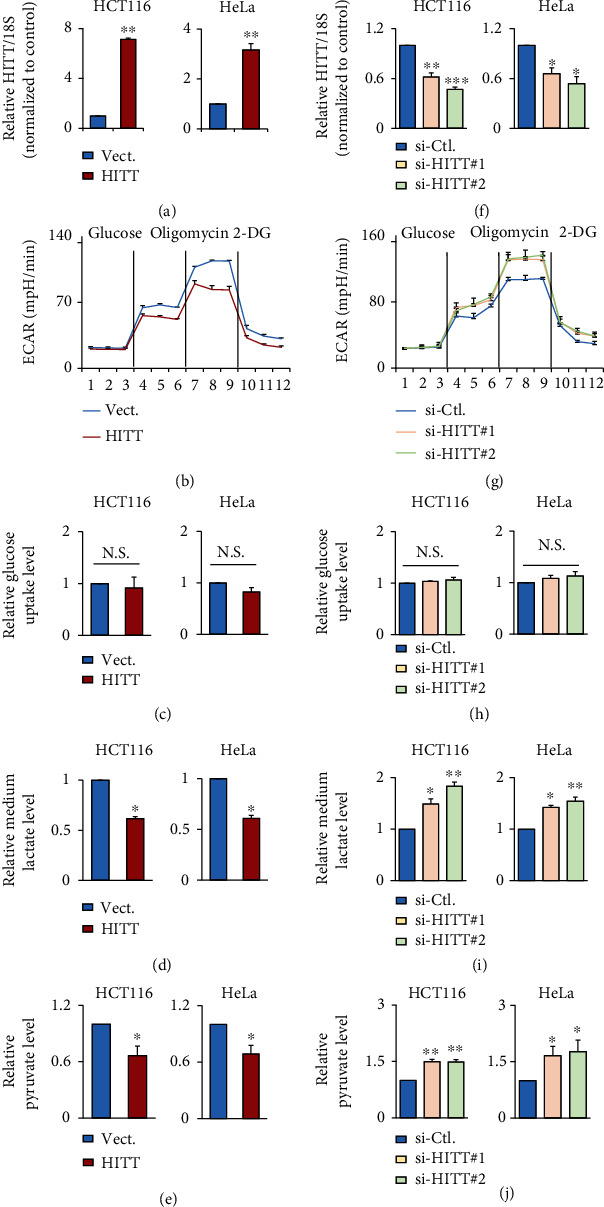
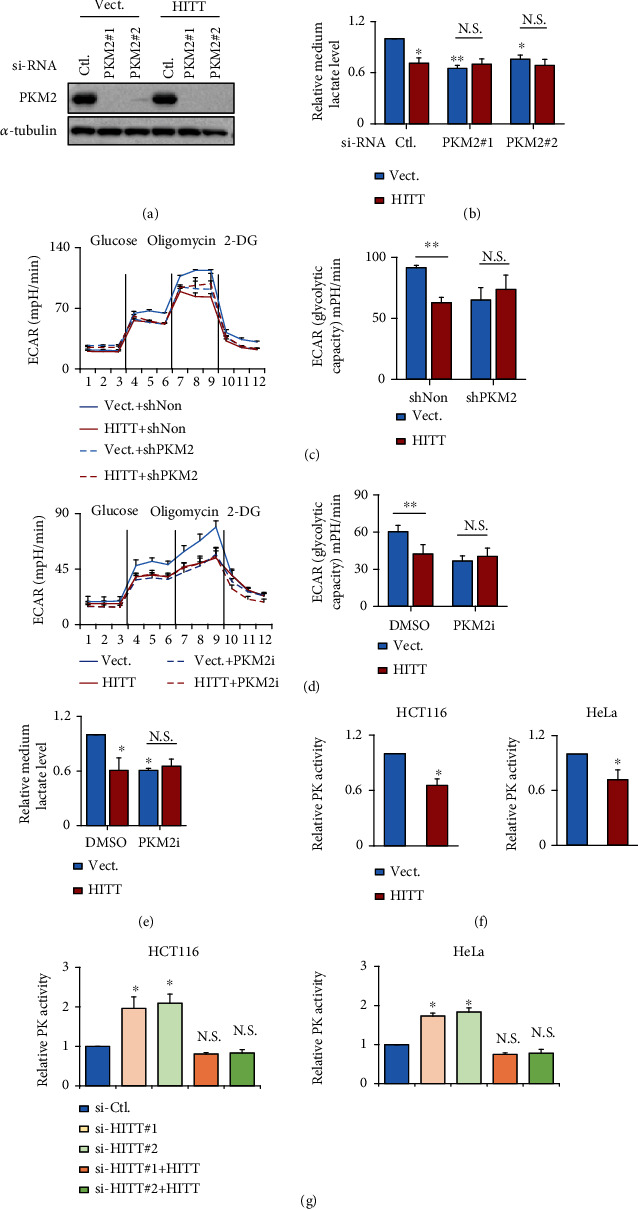
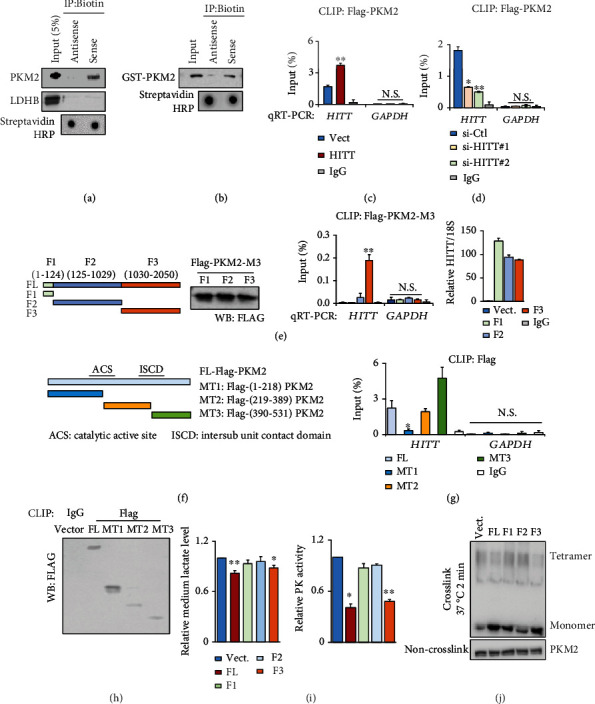
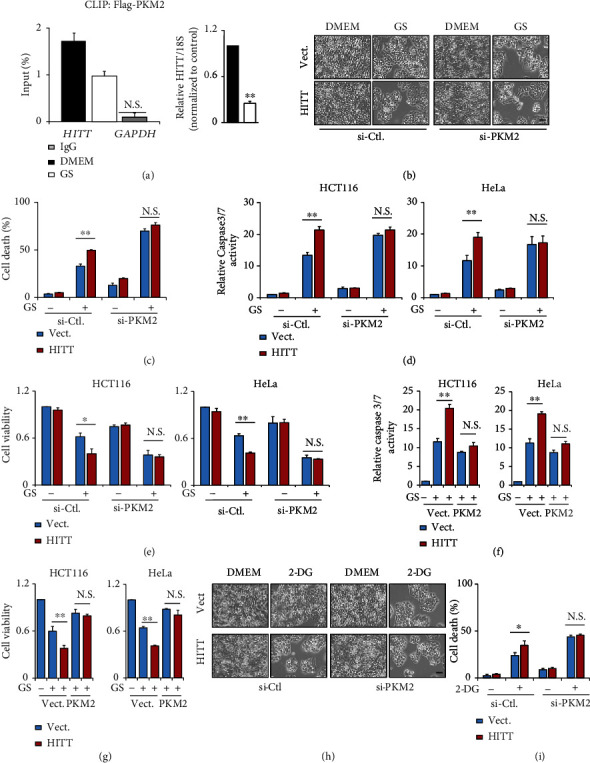
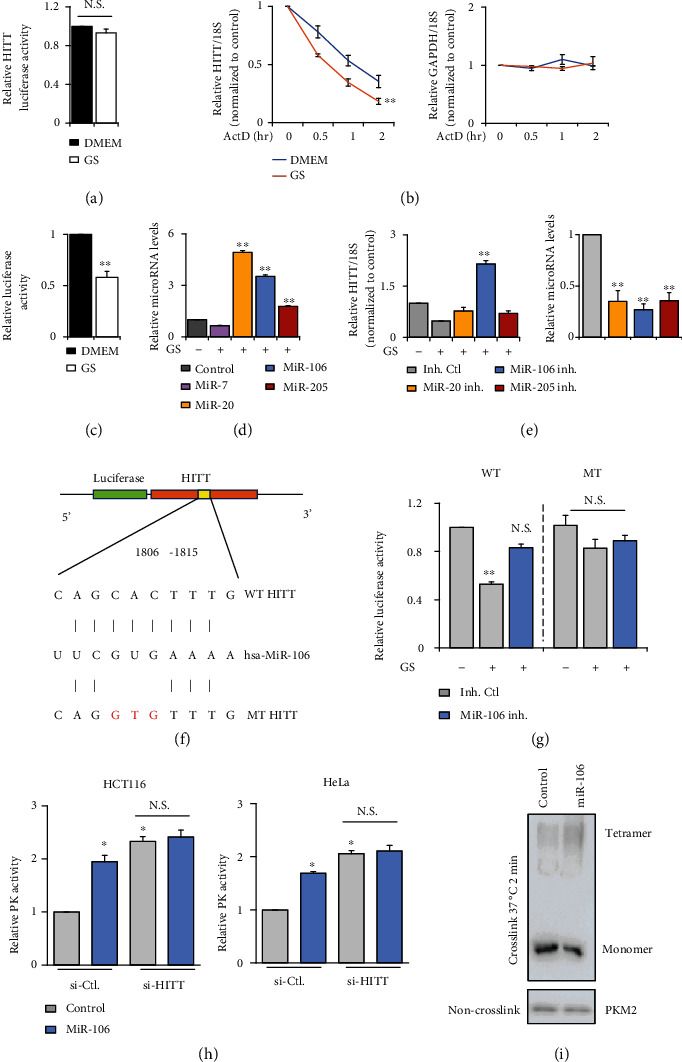
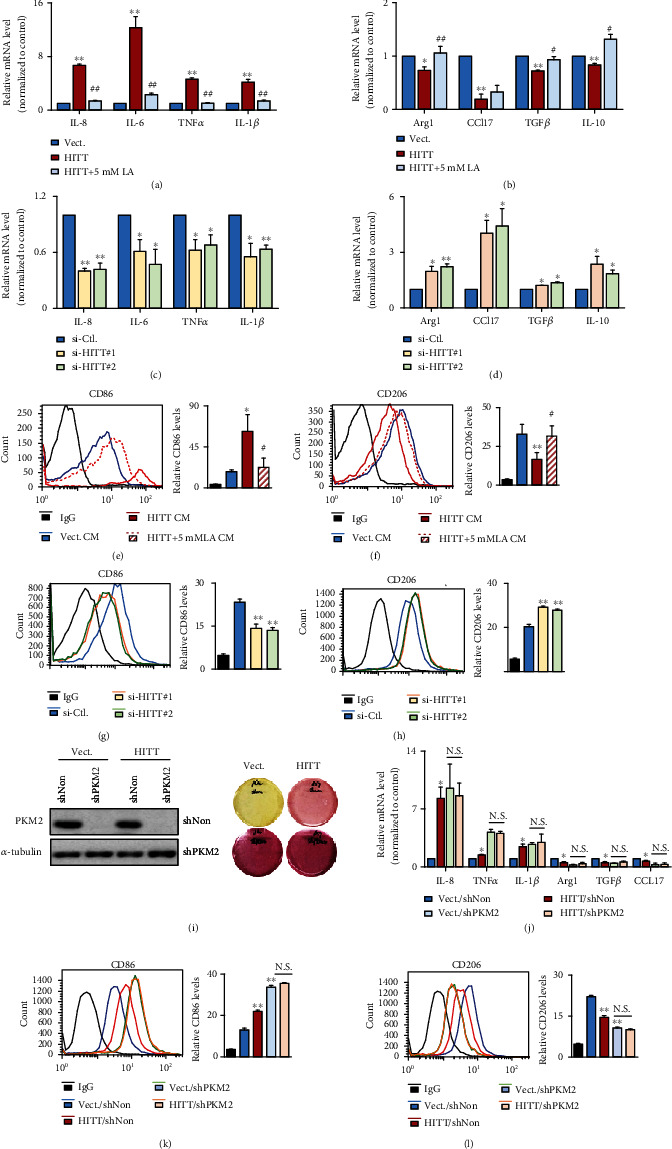
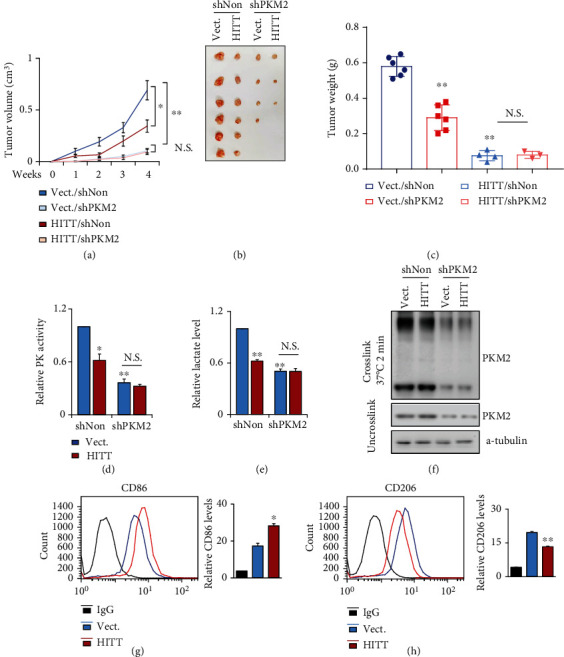
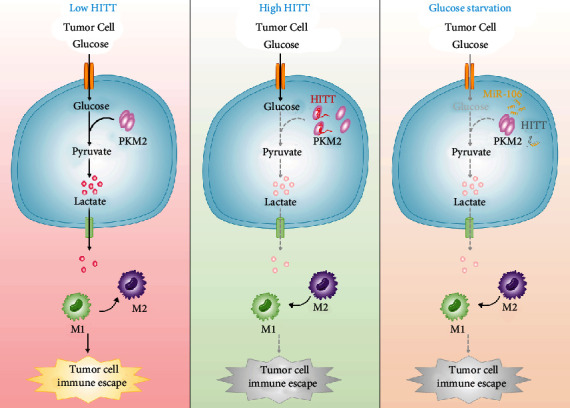
Lactic acid acidifies the tumor microenvironment and promotes multiple critical oncogenic processes, including immune evasion. Pyruvate kinase M2 (PKM2) is a dominant form of pyruvate kinase (PK) expressed in cancers that plays essential roles in metabolic reprograming and lactate production, rendering it as an attractive therapeutic target of cancer. However, the mechanism underlying PKM2 regulation remains unclear. Here, we show that long noncoding RNA (lncRNA) HIF-1α inhibitor at transcription level (HITT) inhibits lactate production in a PKM2-dependent manner. Mechanistically, it physically interacts with PKM2 mapped to a region that has been involved in both dimer (less-active) and tetramer (more-active) formation, inhibiting PKM2 oligomerization and leading to dramatic reduction of PK activity. Under glucose starvation, HITT was reduced as a result of miR-106 induction, which subsequently facilitates PKM2 oligomerization and increases vulnerability to apoptosis under glucose starvation stress. In addition, the interaction also reduces lactate secretion from cancer cells, which subsequently polarizes macrophages toward an M2-like anti-inflammatory phenotype and thus possibly contributes to immune escape in vivo. This study highlights an important role of an lncRNA in regulating PKM2 activity and also reveals a metabolic regulatory effect of PKM2 on macrophage polarization.


Conflict of interest statement

The authors declare that they have no conflict of interest.

Figures

Figure 1
Figure 1
lncRNA HITT inhibits aerobic glycolysis. (a) Overexpression efficiencies of HITT in HCT116 (left) and HeLa (right) stable lines were determined by real-time qRT-PCR. (b–e) ECAR (b), glucose uptake (c), lactate production (d), and pyruvate levels (e) were compared in HITT overexpression and control HCT116 (left) or HeLa (right) cells. (f) The KD efficiency of two independent siRNAs of HITT was confirmed by qRT-PCR, in HCT116 (left) and HeLa (right) cells. HITT expression level was relative to 18S. (g–j) ECAR (g), glucose uptake (h), lactate production (i), and pyruvate levels (j) were compared in HITT KD and control HCT116 (left) or HeLa (right) cells. Data are derived from three independent experiments and presented as mean ± SEM in the bar graphs. Values of controls were normalized to 1. P < 0.05, ∗∗P < 0.01, and ∗∗∗P < 0.001. N.S.: not significant (a, c–f, h–j); Vect.: vector; Ctl.: control.
Figure 2
Figure 2
HITT inhibits glycolysis by repressing PK activity. (a) The KD efficiency of PKM2 in the control and HITT-overexpressing stable HeLa cells was confirmed by WB. (b–e) Medium lactate (b, e) and ECAR (c, d) were detected after PKM2 KD or PKM2 inhibitor (PKM2-IN-1, 20 μM for 24 h) treatment. Quantification of the maximal glycolytic capability is shown in the bar graph (right). (f, g) PK activities were determined in HITT-overexpressing (f)/KD with or without HITT recovery (g) HCT116 (left) and HeLa (right) cells. Data are derived from three independent experiments and presented as mean ± SEM in the bar graphs. Values of controls were normalized to 1. P < 0.05; ∗∗P < 0.01. N.S.: not significant (b–g); Vect.: vector; Ctl.: control.
Figure 3
Figure 3
HITT inhibits PKM2 oligomerization. (a, b) The relative expression levels of PKM2 oligomers and monomers were analyzed by WB following glutaraldehyde crosslinking in cell lysates generated from HITT-overexpressing (a) or KD (b) cells. (c) The same amount of purified recombinant GST-PKM2 protein was incubated with 1 μg sense HITT and antisense HITT. After glutaraldehyde crosslinking, the expression levels of PKM2 oligomers and monomers were determined by WB. (d) The same amount of purified recombinant GST-PKM2 protein was incubated with 0, 2, and 3 μg sense HITT. After glutaraldehyde crosslinking, the expression levels of PKM2 oligomers and monomers were determined by WB. (e) The oligomer and monomer distribution of PKM2 was detected after incubation with FBP followed by glutaraldehyde crosslinking. (f) The PK activities of vector and HITT stable cells were detected with or without the addition of FBP (0.2 mM). Data are derived from three independent experiments and presented as mean ± SEM in the bar graphs. Values of controls were normalized to 1. P < 0.05, ∗∗P < 0.01 (a–f), and ##P < 0.01, compared with vector FBP-treated group (e, f). Vect.: vector; Ctl.: control.
Figure 4
Figure 4
HITT directly binds with PKM2. (a) PKM2 and LDHB levels in protein complexes pulled down by biotin-HITT and biotin-antisense HITT from HeLa cell extracts were detected by WB. (b) Direct interaction between PKM2 and HITT was determined by an in vitro RNA pull-down assay using purified GST-PKM2, in vitro-synthesized biotin-HITT, and biotin-antisense HITT. (c, d) HITT levels of HCT116 cells were determined by real-time RT-PCR following PKM2 CLIP in the control and stable HITT-overexpressing (c) or HITT KD cells (d). IgG and GAPDH RNA were used as controls. (e) A CLIP assay was used to detect the binding of PKM2 with ectopically expressed full-length or HITT fragments as indicated in 4T1 cells (a cell line without endogenous HITT expression). (f–h) HITT levels were determined by real-time RT-PCR following Flag CLIP in HeLa cells after transfection of Flag-tagged full-length (FL) and mutant (MT1–MT3) PKM2, as indicated in the diagram (f). IgG and GAPDH RNA were used as controls (g). The protein pull-down was validated by western blot (h). (i, j) Lactate concentrations and PK activity (i) and oligomers and monomers of PKM2 (j) were analyzed after overexpression of FL or fragmented HITT in HeLa cells. Data are derived from three independent experiments and presented as mean ± SEM in the bar graphs. Values of controls were normalized to 1. P < 0.05, ∗∗P < 0.01. N.S.: not significant (c–e, g, i); Vect.: vector; Ctl.: control.
Figure 5
Figure 5
HITT represses adaptive survival under nutrient stress. (a) HITT levels of HeLa cells were determined by real-time RT-PCR following PKM2 CLIP with or without glucose starvation (GS). IgG and GAPDH RNA were used as controls. HITT overexpression efficiency was validated by real-time RT-PCR (right). (b, h) Representative phase contrast images of HeLa cells after PKM2 KD and/or glucose starvation (b) or 2-DG (h) treatment are presented. Scale bar, 100 μm. (c, i) The cell death rates were determined by the trypan blue exclusion assay after PKM2 KD and/or glucose starvation (c) or 2-DG (i) treatment, in HeLa cells. (d, f) The caspase-3/7 activities in HITT overexpression HCT116 and HeLa cells were detected after PKM2 KD (d) or PKM2 overexpression (f) treated with glucose starvation. (e, g) The cell viability of HITT-overexpressing HCT116 and HeLa cells was analyzed after PKM2 KD (e) or PKM2 overexpression (g) treated with glucose starvation. Data are derived from three independent experiments and presented as mean ± SEM in the bar graphs. Values of controls were normalized to 1. P < 0.05, ∗∗P < 0.01. N.S.: not significant (a, c–g, i); Vect.: vector; Ctl.: control.
Figure 6
Figure 6
HITT was reduced upon glucose starvation through miR-106. (a) HITT promoter-driven luciferase activity was detected by the luciferase reporter assay under GS in HeLa cells. (b) The half-lives of HITT and GAPDH mRNA were measured by qRT-PCR in the presence of ActD in HeLa cells with or without GS. (c) The luciferase activities of the pMIR-HITT reporter were detected in HeLa cells with or without GS. (d) Expression levels of microRNA normalized to U6 were measured by qRT-PCR under GS in HeLa cells. (e) Relative expression levels of HITT were determined by qRT-PCR after transfection with microRNA inhibitors (inh.) in HeLa cells. MicroRNA levels normalized to U6 were measured by qRT-PCR. (f) Schematic description of the hypothetical duplexes formed by interactions between the binding site in HITT (top), miR-106 (middle), and the mutated HITT (bottom). (g) The luciferase activities of wild-type (WT) or miR-106 binding defective mutant (MT) HITT luciferase reporter were detected in HeLa cells after transfection with the miR-106 inhibitor with or without GS, as indicated in the figures. (h) PK activities of HCT116 and HeLa were detected after transfection of miR-106 with or without HITT KD. (i) The expression levels of PKM2 monomers and oligomers were determined after miR-106 transfection. Data are derived from three independent experiments and presented as mean ± SEM in the bar graphs. Values of controls were normalized to 1. P < 0.05, ∗∗P < 0.01 (c–e, g, h). N.S.: not significant (a–e, g, h); Ctl.: control.
Figure 7
Figure 7
HITT-regulated PKM2-lactate repression alleviates M1–M2 macrophage polarization. (a–d) The mRNA expression levels of IL-8, IL-6, TNFα, IL-1β, and INOS (a, c) or Arg1, CCL17, TGFβ, and IL-10 (b, d) were analyzed by real-time RT-PCR in THP-1 cells cultured with conditioned medium (CM) from HeLa cells after the indicated treatments. (e–h) The CD86 (e, g) or CD206 (f, h) expression levels of THP-1 cells cultured with CM from HeLa cells after the indicated treatments were determined by flow cytometry. (i) PKM2 KD efficiencies of the indicated stable cells were determined by WB (left). Right photos show the representative media colors of these stable cells. (j) The mRNA expression levels of IL-8, TNFα, IL-1β, Arg1, TGFβ, and CCL17 were analyzed by real-time RT-PCR in THP-1 cells cultured with conditioned medium (CM) from HeLa cells after the indicated treatments. (k, l) The CD86 (k) or CD206 (l) expression levels of THP-1 with conditioned medium (CM) from HeLa cells after the indicated treatments were determined by flow cytometry. Data are derived from three independent experiments and presented as mean ± SEM in the bar graphs. P < 0.05, ∗∗P < 0.01. N.S.: not significant (a–h, j–l). #P < 0.05, ##P < 0.01, compared with HITT CM-treated group (a, b, e, f). Vect.: vector; Ctl.: control; LA: lactic acid.
Figure 8
Figure 8
HITT-regulated PKM2-lactate repression inhibits tumor growth in vivo. (a–c) Tumor volumes at the indicated dates (a), as well as images (b) and tumor weights (c) at 4 weeks, for HCT116/vector (Vect.+shNon), HCT116/HITT (HITT+shNon), HCT116/(Vect.+shPKM2), and HCT116/(HITT+shPKM2) xenografts. The average values are presented as bar graphs (means ± SD) (n = 6 for each group). (d–f) PK activities (d), lactate levels (e), and PKM2 tetramers (f) were detected in the tumor tissues of xenografts. (g, h) The CD86 (g) or CD206 (h) expression levels of macrophages from tumor tissues of xenografts were determined by flow cytometry. Data are derived from three independent experiments and presented as mean ± SD in the bar graphs. P < 0.05, ∗∗P < 0.01. N.S.: not significant (a, c-e, g, h); Vect.: vector.
Figure 9
Figure 9
HITT-regulated PKM2-lactate repression inhibits tumor growth in vivo. Pyruvate kinase M2 (PKM2) plays essential roles in metabolic reprograming and lactate production. The tetramer formation of PKM2 has more active PK activity and regulates M2 polarization of macrophages via lactate derived from tumor cells. Under glucose starvation, miR-106 is increased, which inhibits lncRNA HITT levels and facilitates PKM activation and adaptive survival. This is because HITT inhibits PKM2 dimer and tetramer formation and subsequent lactate production into the environment via direct interaction. So HITT inhibits tumor growth by inhibiting PKM2 activity and promoting macrophage polarization to M1.

References

    1. Koppenol W. H., Bounds P. L., Dang C. V. Otto Warburg's contributions to current concepts of cancer metabolism. Nature Reviews Cancer . 2011;11(5):325–337. doi: 10.1038/nrc3038. - DOI - PubMed
    1. Gatenby R. A., Gillies R. J. Why do cancers have high aerobic glycolysis? Nature Reviews Cancer . 2004;4(11):891–899. doi: 10.1038/nrc1478. - DOI - PubMed
    1. Ward P. S., Thompson C. B. Metabolic reprogramming: a cancer hallmark even Warburg did not anticipate. Cancer Cell . 2012;21(3):297–308. doi: 10.1016/j.ccr.2012.02.014. - DOI - PMC - PubMed
    1. Suzuki T., Otsuka M., Seimiya T., Iwata T., Kishikawa T., Koike K. The biological role of metabolic reprogramming in pancreatic cancer. MedComm . 2020;1(3):302–310. doi: 10.1002/mco2.37. - DOI - PMC - PubMed
    1. Kroemer G., Pouyssegur J. Tumor cell metabolism: cancer's Achilles' heel. Cancer Cell . 2008;13(6):472–482. doi: 10.1016/j.ccr.2008.05.005. - DOI - PubMed

LinkOut - more resources