DSIF modulates RNA polymerase II occupancy according to template G + C content
- PMID: 35910045
- PMCID: PMC9326580
- DOI: 10.1093/nargab/lqac054
DSIF modulates RNA polymerase II occupancy according to template G + C content
Abstract
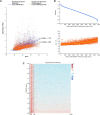
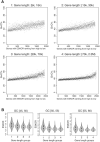
The DSIF complex comprising the Supt4h and Supt5h transcription elongation proteins clamps RNA polymerase II (RNAPII) onto DNA templates, facilitating polymerase processivity. Lowering DSIF components can differentially decrease expression of alleles containing nucleotide repeat expansions, suggesting that RNAPII transit through repeat expansions is dependent on DSIF functions. To globally identify sequence features that affect dependence of the polymerase on DSIF in human cells, we used ultra-deep ChIP-seq analysis and RNA-seq to investigate and quantify the genome-wide effects of Supt4h loss on template occupancy and transcript production. Our results indicate that RNAPII dependence on Supt4h varies according to G + C content. Effects of DSIF knockdown were prominent during transcription of sequences high in G + C but minimal for sequences low in G + C and were particularly evident for G + C-rich segments of long genes. Reanalysis of previously published ChIP-seq data obtained from mouse cells showed similar effects of template G + C composition on Supt5h actions. Our evidence that DSIF dependency varies globally in different template regions according to template sequence composition suggests that G + C content may have a role in the selectivity of Supt4h knockdown and Supt5h knockdown during transcription of gene alleles containing expansions of G + C-rich repeats.
© The Author(s) 2022. Published by Oxford University Press on behalf of NAR Genomics and Bioinformatics.
Figures


Similar articles
-
Chemical interference with DSIF complex formation lowers synthesis of mutant huntingtin gene products and curtails mutant phenotypes.Proc Natl Acad Sci U S A. 2022 Aug 9;119(32):e2204779119. doi: 10.1073/pnas.2204779119. Epub 2022 Aug 1. Proc Natl Acad Sci U S A. 2022. PMID: 35914128 Free PMC article.
-
DSIF contributes to transcriptional activation by DNA-binding activators by preventing pausing during transcription elongation.Nucleic Acids Res. 2007;35(12):4064-75. doi: 10.1093/nar/gkm430. Epub 2007 Jun 12. Nucleic Acids Res. 2007. PMID: 17567605 Free PMC article.
-
DSIF and NELF interact with RNA polymerase II elongation complex and HIV-1 Tat stimulates P-TEFb-mediated phosphorylation of RNA polymerase II and DSIF during transcription elongation.J Biol Chem. 2001 Apr 20;276(16):12951-8. doi: 10.1074/jbc.M006130200. Epub 2000 Dec 8. J Biol Chem. 2001. PMID: 11112772
-
New Roles for Canonical Transcription Factors in Repeat Expansion Diseases.Trends Genet. 2020 Feb;36(2):81-92. doi: 10.1016/j.tig.2019.11.003. Epub 2019 Dec 11. Trends Genet. 2020. PMID: 31837826 Free PMC article. Review.
-
Mechanisms of Transcription Elongation Factor DSIF (Spt4-Spt5).J Mol Biol. 2021 Jul 9;433(14):166657. doi: 10.1016/j.jmb.2020.09.016. Epub 2020 Sep 25. J Mol Biol. 2021. PMID: 32987031 Review.
References
-
- Nudler E., Avetissova E., Markovtsov V., Goldfarb A.. Transcription processivity: protein-DNA interactions holding together the elongation complex. Science. 1996; 273:211–217. - PubMed
-
- Wada T., Takagi T., Yamaguchi Y., Ferdous A., Imai T., Hirose S., Sugimoto S., Yano K., Hartzog G.A., Winston F.et al. .. DSIF, a novel transcription elongation factor that regulates RNA polymerase II processivity, is composed of human spt4 and spt5 homologs. Genes. Dev. 1998; 12:343–356. - PMC - PubMed
-
- Yamaguchi Y., Wada T., Watanabe D., Takagi T., Hasegawa J., Handa H.. Structure and function of the human transcription elongation factor DSIF. J. Biol. Chem. 1999; 274:8085–8092. - PubMed
-
- Ehara H., Yokoyama T., Shigematsu H., Yokoyama S., Shirouzu M., Sekine S.I.. Structure of the complete elongation complex of RNA polymerase II with basal factors. Science. 2017; 357:921–924. - PubMed
LinkOut - more resources
Full Text Sources
Other Literature Sources
Molecular Biology Databases
Research Materials

