

Cuproptosis-Associated lncRNA Establishes New Prognostic Profile and Predicts Immunotherapy Response in Clear Cell Renal Cell Carcinoma
- PMID: 35910212
- PMCID: PMC9334800
- DOI: 10.3389/fgene.2022.938259
Cuproptosis-Associated lncRNA Establishes New Prognostic Profile and Predicts Immunotherapy Response in Clear Cell Renal Cell Carcinoma
Abstract
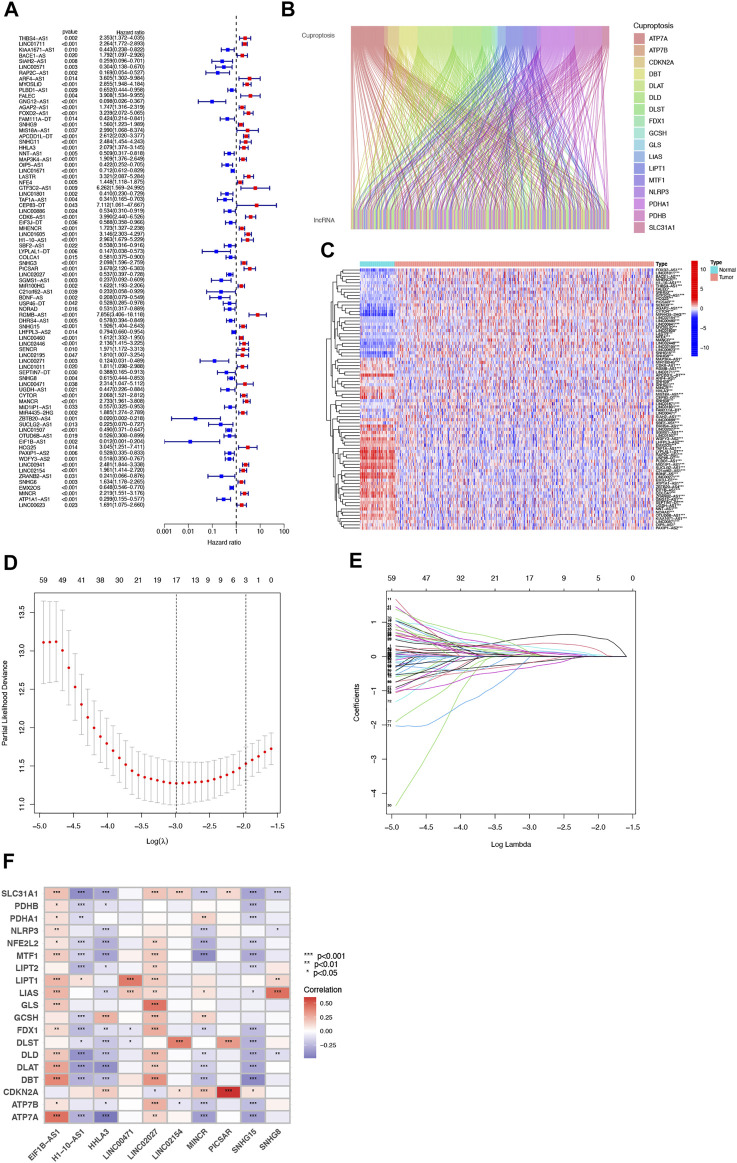
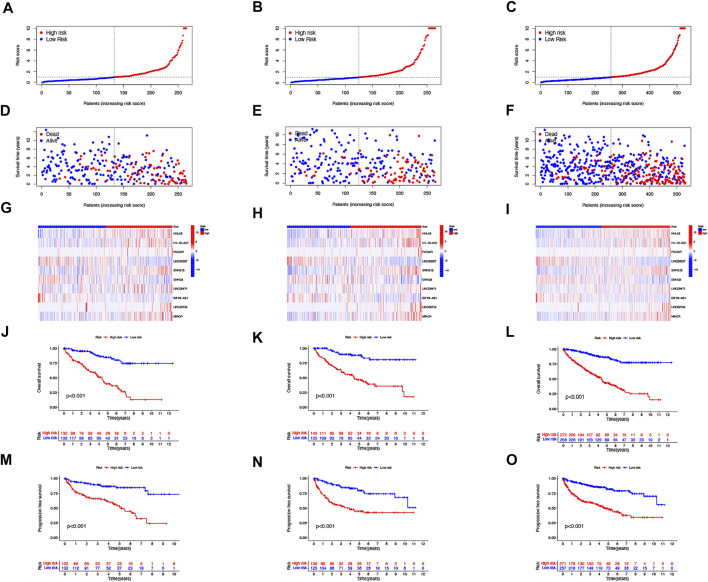
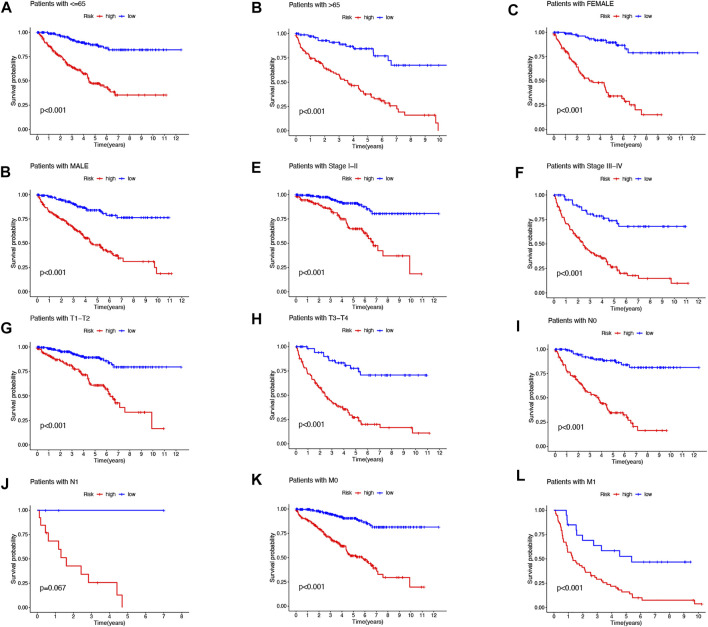
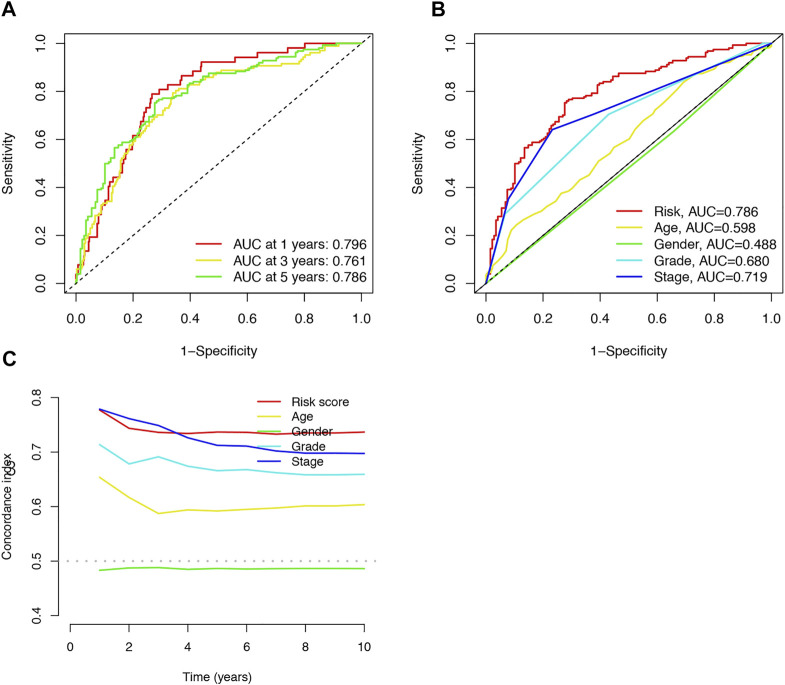
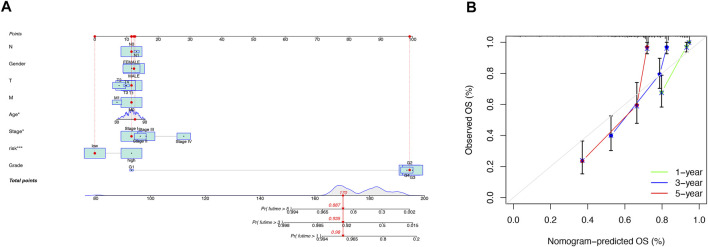
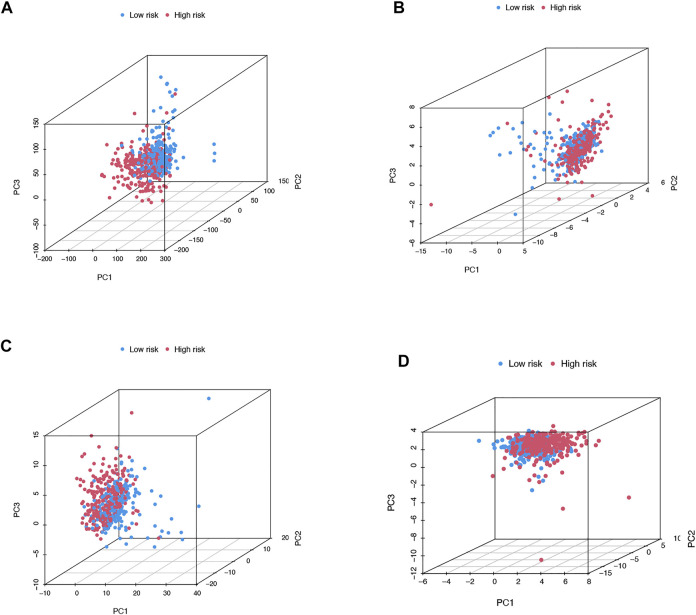
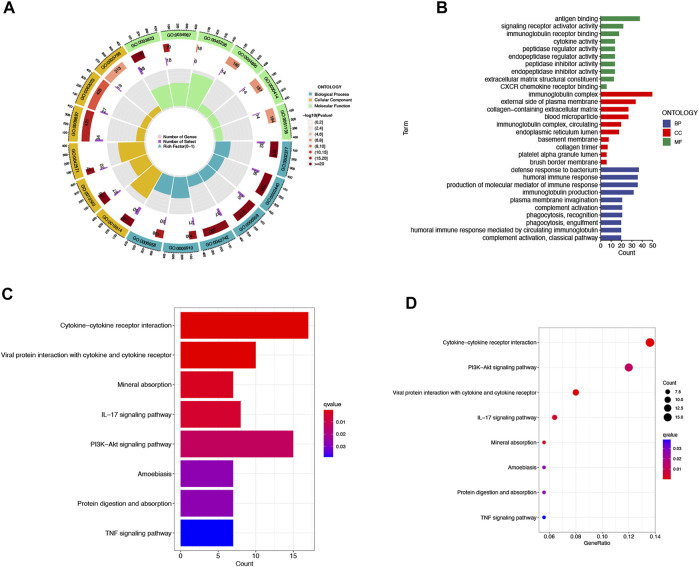
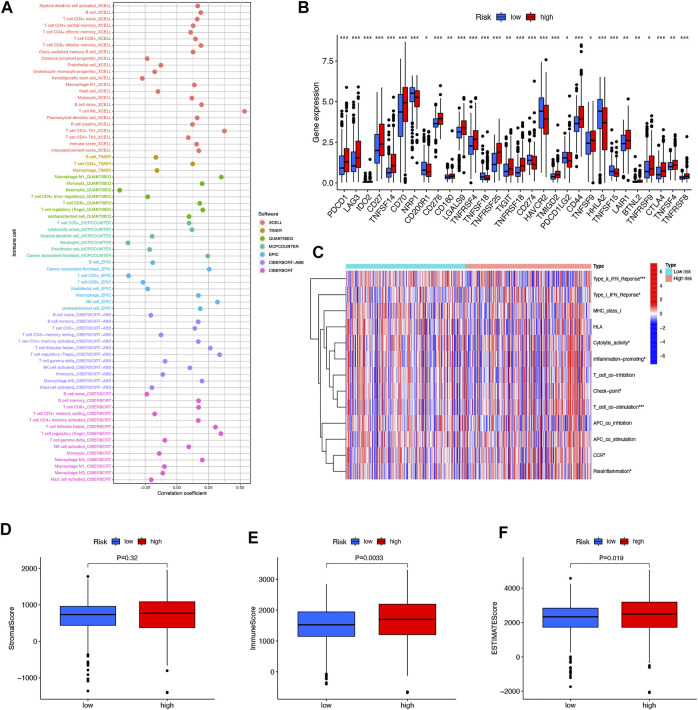
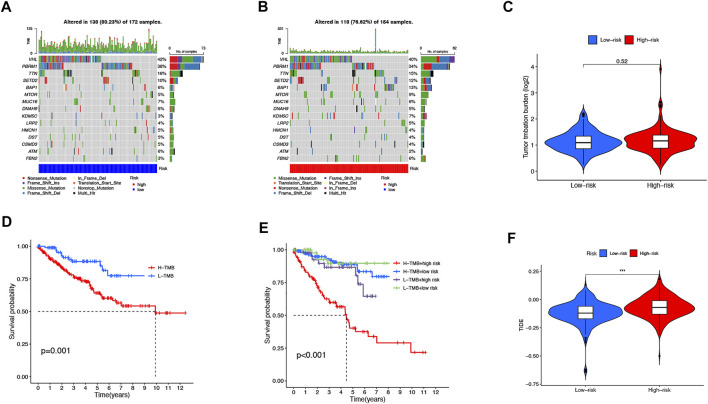
Background: Clear cell renal cell carcinoma (ccRCC) accounts for 80% of all kidney cancers and has a poor prognosis. Recent studies have shown that copper-dependent, regulated cell death differs from previously known death mechanisms (apoptosis, ferroptosis, and necroptosis) and is dependent on mitochondrial respiration (Tsvetkov et al., Science, 2022, 375 (6586), 1254-1261). Studies also suggested that targeting cuproptosis may be a novel therapeutic strategy for cancer therapy. In ccRCC, both cuproptosis and lncRNA were critical, but the mechanisms were not fully understood. The aim of our study was to construct a prognostic profile based on cuproptosis-associated lncRNAs to predict the prognosis of ccRCC and to study the immune profile of clear cell renal cell carcinoma (ccRCC). Methods: We downloaded the transcriptional profile and clinical information of ccRCC from The Cancer Genome Atlas (TCGA). Co-expression network analysis, Cox regression method, and least absolute shrinkage and selection operator (LASSO) method were used to identify cuproptosis-associated lncRNAs and to construct a risk prognostic model. In addition, the predictive performance of the model was validated and recognized by an integrated approach. We then also constructed a nomogram to predict the prognosis of ccRCC patients. Differences in biological function were investigated by GO, KEGG, and immunoassay. Immunotherapy response was measured using tumor mutational burden (TMB) and tumor immune dysfunction and rejection (TIDE) scores. Results: We constructed a panel of 10 cuproptosis-associated lncRNAs (HHLA3, H1-10-AS1, PICSAR, LINC02027, SNHG15, SNHG8, LINC00471, EIF1B-AS1, LINC02154, and MINCR) to construct a prognostic prediction model. The Kaplan-Meier and ROC curves showed that the feature had acceptable predictive validity in the TCGA training, test, and complete groups. The cuproptosis-associated lncRNA model had higher diagnostic efficiency compared to other clinical features. The analysis of Immune cell infiltration and ssGSEA further confirmed that predictive features were significantly associated with the immune status of ccRCC patients. Notably, the superimposed effect of patients in the high-risk group and high TMB resulted in shorter survival. In addition, the higher TIDE scores in the high-risk group suggested a poorer outcome for immune checkpoint blockade response in these patients. Conclusion: The ten cuproptosis-related risk profiles for lncRNA may help assess the prognosis and molecular profile of ccRCC patients and improve treatment options, which can be further applied in the clinic.
Keywords: bioinformatics; ccRCC; cuproptosis; lncRNA; prognostic model.
Copyright © 2022 Xu, Liu, Chang, Wen, Ma, Sun, Wang, Chen, Xu and Zhang.
Conflict of interest statement
The authors declare that the research was conducted in the absence of any commercial or financial relationships that could be construed as a potential conflict of interest.
Figures
Similar articles
-
The LncRNA signature associated with cuproptosis as a novel biomarker of prognosis in immunotherapy and drug screening for clear cell renal cell carcinoma.Front Genet. 2023 Jan 23;14:1039813. doi: 10.3389/fgene.2023.1039813. eCollection 2023. Front Genet. 2023. PMID: 36755568 Free PMC article.
-
A Cuproptosis-Related LncRNA Risk Model for Predicting Prognosis and Immunotherapeutic Efficacy in Patients with Hepatocellular Carcinoma.Biochem Genet. 2024 Jun;62(3):2332-2351. doi: 10.1007/s10528-023-10539-x. Epub 2023 Oct 29. Biochem Genet. 2024. PMID: 37898914
-
Prognostic and immune microenvironment analysis of cuproptosis-related LncRNAs in breast cancer.Funct Integr Genomics. 2023 Jan 14;23(1):38. doi: 10.1007/s10142-023-00963-y. Funct Integr Genomics. 2023. PMID: 36640225 Clinical Trial.
-
A new CCCH-type zinc finger-related lncRNA signature predicts the prognosis of clear cell renal cell carcinoma patients.Front Genet. 2022 Sep 30;13:1034567. doi: 10.3389/fgene.2022.1034567. eCollection 2022. Front Genet. 2022. PMID: 36246657 Free PMC article.
-
A novel prognostic signature for lung adenocarcinoma based on cuproptosis-related lncRNAs: A Review.Medicine (Baltimore). 2022 Dec 9;101(49):e31924. doi: 10.1097/MD.0000000000031924. Medicine (Baltimore). 2022. PMID: 36626411 Free PMC article. Review.
Cited by
-
Construction of a novel immune response prediction signature to predict the efficacy of immune checkpoint inhibitors in clear cell renal cell carcinoma patients.Heliyon. 2023 May 25;9(6):e15925. doi: 10.1016/j.heliyon.2023.e15925. eCollection 2023 Jun. Heliyon. 2023. PMID: 37484396 Free PMC article.
-
Potential of Copper and Copper Compounds for Anticancer Applications.Pharmaceuticals (Basel). 2023 Feb 3;16(2):234. doi: 10.3390/ph16020234. Pharmaceuticals (Basel). 2023. PMID: 37259382 Free PMC article. Review.
-
SSH3 promotes pancreatic cancer proliferation and migration by activating the notch signaling pathway.Am J Cancer Res. 2024 Apr 15;14(4):1815-1830. doi: 10.62347/DAZV7194. eCollection 2024. Am J Cancer Res. 2024. PMID: 38726290 Free PMC article.
-
Alternative splicing variants involved in pyroptosis and cuproptosis contribute to phenotypic remodeling of the tumor microenvironment in cervical cancer.Reprod Sci. 2023 Dec;30(12):3648-3660. doi: 10.1007/s43032-023-01284-y. Epub 2023 Jul 11. Reprod Sci. 2023. PMID: 37434062
-
A cuproptosis-related lncRNA signature identified prognosis and tumour immune microenvironment in kidney renal clear cell carcinoma.Front Mol Biosci. 2022 Sep 14;9:974722. doi: 10.3389/fmolb.2022.974722. eCollection 2022. Front Mol Biosci. 2022. PMID: 36188220 Free PMC article.
References
-
- Barik G. K., Sahay O., Behera A., Naik D., Kalita B. (2021). Keep Your Eyes Peeled for Long Noncoding RNAs: Explaining Their Boundless Role in Cancer Metastasis, Drug Resistance, and Clinical Application. Biochimica Biophysica Acta (BBA) - Rev. Cancer 1876 (2), 188612. 10.1016/j.bbcan.2021.188612 - DOI - PubMed
LinkOut - more resources
Full Text Sources