

Identification of the KCNQ1OT1/ miR-378a-3p/ RBMS1 Axis as a Novel Prognostic Biomarker Associated With Immune Cell Infiltration in Gastric Cancer
- PMID: 35910231
- PMCID: PMC9330051
- DOI: 10.3389/fgene.2022.928754
Identification of the KCNQ1OT1/ miR-378a-3p/ RBMS1 Axis as a Novel Prognostic Biomarker Associated With Immune Cell Infiltration in Gastric Cancer
Abstract
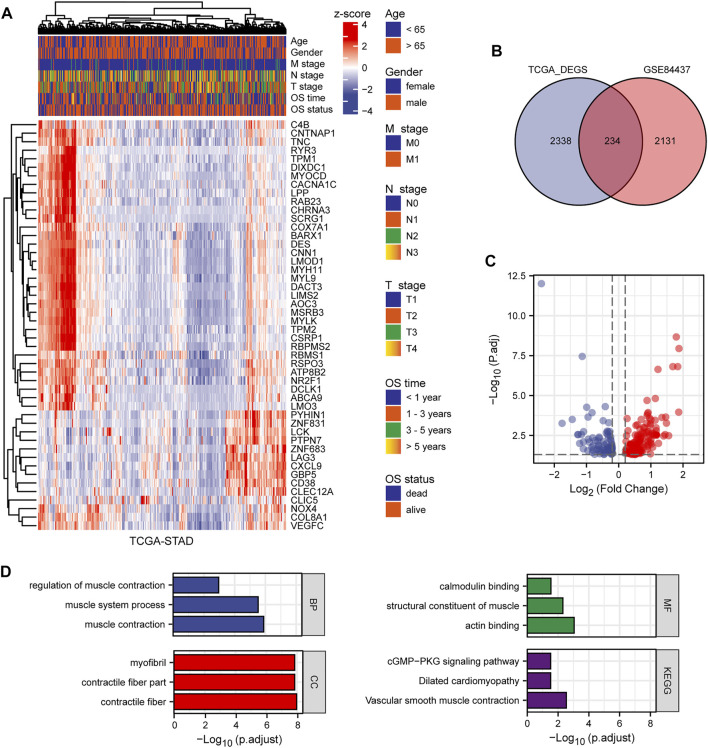
Background: Gastric cancer (GC) is the second leading cause of cancer-related mortality and the fifth most common cancer worldwide. However, the underlying mechanisms of competitive endogenous RNAs (ceRNAs) in GC are unclear. This study aimed to construct a ceRNA regulation network in correlation with prognosis and explore a prognostic model associated with GC. Methods: In this study, 1,040 cases of GC were obtained from TCGA and GEO datasets. To identify potential prognostic signature associated with GC, Cox regression analysis and the least absolute shrinkage and selection operator (LASSO) regression were employed. The prognostic value of the signature was validated in the GEO84437 training set, GEO84437 test set, GEO15459 set, and TCGA-STAD. Based on the public databases, TargetScan and starBase, an mRNA-miRNA-lncRNA regulatory network was constructed, and hub genes were identified using the CytoHubba plugin. Furthermore, the clinical outcomes, immune cell infiltration, genetic variants, methylation, and somatic copy number alteration (sCNA) associated with the ceRNA network were derived using bioinformatics methods. Results: A total of 234 prognostic genes were identified. GO and GSEA revealed that the biological pathways and modules related to immune response and fibroblasts were considerably enriched in GC. A nomogram was generated to provide accurate prognostic outcomes and individualized risk estimates, which were validated in the training, test dataset, and two independent validation datasets. Thereafter, an mRNA-miRNA-lncRNA regulatory network containing 4 mRNAs, 22 miRNAs, 201 lncRNAs was constructed. The KCNQ1OT1/hsa-miR-378a-3p/RBMS1 ceRNA network associated with the prognosis was obtained by hub gene analysis and correlation analysis. Importantly, we found that the KCNQ1OT1/miR-378a-3p/RBMS1 axis may play a vital role in the diagnosis and prognosis of GC patients based on Cox regression analyses. Furthermore, our findings demonstrated that mutations and sCNA of the KCNQ1OT1/miR-378a-3p/RBMS1 axis were associated with increased immune infiltration, while the abnormal upregulation of the axis was primarily a result of hypomethylation. Conclusion: Our findings suggest that the KCNQ1OT1/miR-378a-3p/RBMS1 axis may be a potential prognostic biomarker and therapeutic target for GC. Moreover, such findings provide insights into the molecular mechanisms of GC pathogenesis.
Keywords: SCNA; ceRNA; genetic variants; immune microenvironment; methylation.
Copyright © 2022 Yue, Li, Liang, Yang, Ou, Wang, Ma and Fan.
Conflict of interest statement
The authors declare that the research was conducted in the absence of any commercial or financial relationships that could be construed as a potential conflict of interest.
Figures


Similar articles
-
Identification of lncRNA/circRNA-miRNA-mRNA ceRNA Network as Biomarkers for Hepatocellular Carcinoma.Front Genet. 2022 Mar 21;13:838869. doi: 10.3389/fgene.2022.838869. eCollection 2022. Front Genet. 2022. PMID: 35386284 Free PMC article.
-
Comprehensive analysis of a cuproptosis-related ceRNA network implicates a potential endocrine therapy resistance mechanism in ER-positive breast cancer.BMC Med Genomics. 2023 May 5;16(1):96. doi: 10.1186/s12920-023-01511-0. BMC Med Genomics. 2023. PMID: 37143115 Free PMC article.
-
Comprehensive analysis to identify pseudogenes/lncRNAs-hsa-miR-200b-3p-COL5A2 network as a prognostic biomarker in gastric cancer.Hereditas. 2022 Nov 29;159(1):43. doi: 10.1186/s41065-022-00257-6. Hereditas. 2022. PMID: 36447214 Free PMC article.
-
Comprehensive analysis to construct a novel immune-related prognostic panel in aging-related gastric cancer based on the lncRNA‒miRNA-mRNA ceRNA network.Front Mol Biosci. 2023 May 15;10:1163977. doi: 10.3389/fmolb.2023.1163977. eCollection 2023. Front Mol Biosci. 2023. PMID: 37255541 Free PMC article.
-
Integrative analysis of immune microenvironment-related CeRNA regulatory axis in gastric cancer.Math Biosci Eng. 2020 Jun 1;17(4):3953-3971. doi: 10.3934/mbe.2020219. Math Biosci Eng. 2020. PMID: 32987562
Cited by
-
Bioinformatics analysis identifies coagulation factor II receptor as a potential biomarker in stomach adenocarcinoma.Sci Rep. 2024 Jan 30;14(1):2468. doi: 10.1038/s41598-024-52397-6. Sci Rep. 2024. PMID: 38291086 Free PMC article.
-
Glycyrrhizic acid protects against temporal lobe epilepsy in young rats by regulating neuronal ferroptosis through the miR-194-5p/PTGS2 axis.Kaohsiung J Med Sci. 2023 Feb;39(2):154-165. doi: 10.1002/kjm2.12642. Epub 2023 Jan 17. Kaohsiung J Med Sci. 2023. PMID: 36647717 Free PMC article.
-
Identification and validation of a novel angiogenesis-related gene signature for predicting prognosis in gastric adenocarcinoma.Front Oncol. 2023 Jan 16;12:965102. doi: 10.3389/fonc.2022.965102. eCollection 2022. Front Oncol. 2023. PMID: 36727080 Free PMC article.
-
A Five-gene Signature based on MicroRNA for Predicting Prognosis and Immunotherapy in Stomach Adenocarcinoma.Curr Med Chem. 2024;31(17):2378-2399. doi: 10.2174/0109298673281631231127051017. Curr Med Chem. 2024. PMID: 38310388
References
-
- Azimi F., Scolyer R. A., Rumcheva P., Moncrieff M., Murali R., McCarthy S. W., et al. (2012). Tumor-Infiltrating Lymphocyte Grade is an Independent Predictor of Sentinel Lymph Node Status and Survival in Patients with Cutaneous Melanoma. J. Clin. Oncol. 30 (21), 2678–2683. 10.1200/JCO.2011.37.8539 - DOI - PubMed
LinkOut - more resources
Full Text Sources
Miscellaneous