

Increased Serum NSE and S100B Indicate Neuronal and Glial Alterations in Subjects Under 71 Years With Mild Neurocognitive Disorder/Mild Cognitive Impairment
- PMID: 35910248
- PMCID: PMC9329528
- DOI: 10.3389/fncel.2022.788150
Increased Serum NSE and S100B Indicate Neuronal and Glial Alterations in Subjects Under 71 Years With Mild Neurocognitive Disorder/Mild Cognitive Impairment
Abstract
Background: Mild cognitive impairment (MCI) is considered a pre-stage of different dementia syndromes. Despite diagnostic criteria refined by DSM-5 and a new term for MCI - "mild neurocognitive disorder" (mild NCD) - this diagnosis is still based on clinical criteria.
Methods: To link mild NCD to the underlying pathophysiology we assessed the degree of white matter hyperintensities (WMH) in the brain and peripheral biomarkers for neuronal integrity (neuron-specific enolase, NSE), plasticity (brain-derived neurotrophic factor, BDNF), and glial function (S100B) in 158 community-dwelling subjects with mild NCD and 82 healthy controls. All participants (63-79 years old) were selected from the Leipzig-population-based study of adults (LIFE).
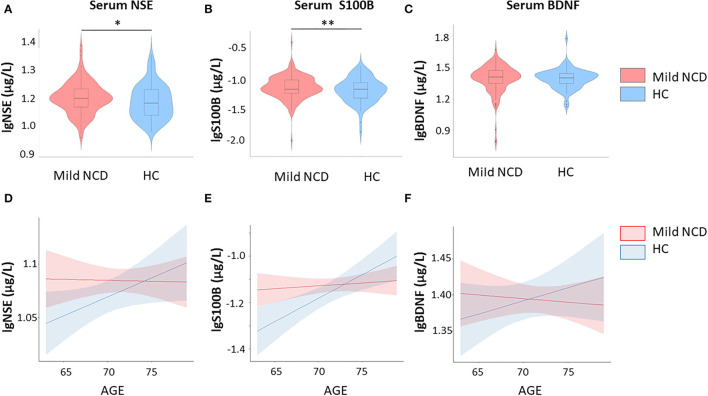
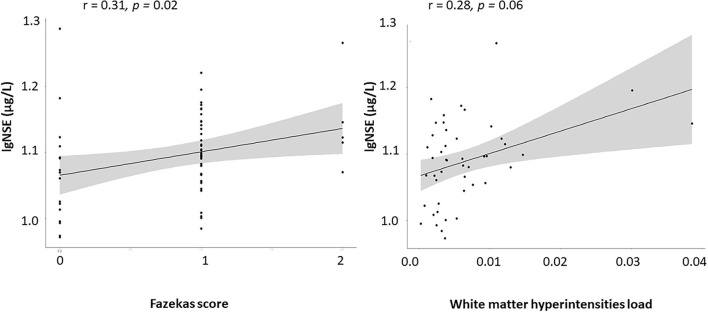
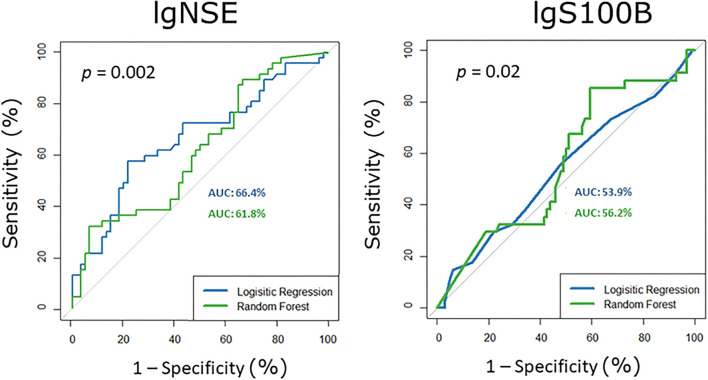
Results: Serum S100B levels were increased in mild NCD in comparison to controls (p = 0.007). Serum NSE levels were also increased but remained non-significant after Bonferroni-Holm correction (p = 0.04). Furthermore, age by group interaction was significant for S100B. In an age-stratified sub-analysis, NSE and S100B were higher in younger subjects with mild NCD below 71 years of age. Some effects were inconsistent after controlling for potentially confounding factors. The discriminatory power of the two biomarkers NSE and S100B was insufficient to establish a pathologic threshold for mild NCD. In subjects with mild NCD, WMH load correlated with serum NSE levels (r = 0.20, p = 0.01), independently of age.
Conclusion: Our findings might indicate the presence of neuronal (NSE) and glial (S100B) injury in mild NCD. Future studies need to investigate whether younger subjects with mild NCD with increased biomarker levels are at risk of developing major NCD.
Keywords: BDNF; Brain-Derived Neurotrophic Factor; NSE; S100B; mild cognitive impairment; neuron-specific enolase; white matter hyperintensities.
Copyright © 2022 Polyakova, Mueller, Arelin, Lampe, Rodriguez, Luck, Kratzsch, Hoffmann, Riedel-Heller, Villringer, Schoenknecht and Schroeter.
Conflict of interest statement
The authors declare that the research was conducted in the absence of any commercial or financial relationships that could be construed as a potential conflict of interest.
Figures
Similar articles
-
First evidence for glial pathology in late life minor depression: S100B is increased in males with minor depression.Front Cell Neurosci. 2015 Oct 9;9:406. doi: 10.3389/fncel.2015.00406. eCollection 2015. Front Cell Neurosci. 2015. PMID: 26500502 Free PMC article.
-
A Pilot Study of the Use of Dexmedetomidine for the Control of Delirium by Reducing the Serum Concentrations of Brain-Derived Neurotrophic Factor, Neuron-Specific Enolase, and S100B in Polytrauma Patients.J Intensive Care Med. 2019 Aug;34(8):674-681. doi: 10.1177/0885066617710643. Epub 2017 Jun 1. J Intensive Care Med. 2019. PMID: 28569132 Clinical Trial.
-
Glial and neuronal proteins in serum predict outcome after severe traumatic brain injury.Neurology. 2004 Apr 27;62(8):1303-10. doi: 10.1212/01.wnl.0000120550.00643.dc. Neurology. 2004. PMID: 15111666
-
Glial and neuronal markers in bipolar disorder: A meta-analysis testing S100B and NSE peripheral blood levels.Prog Neuropsychopharmacol Biol Psychiatry. 2020 Jul 13;101:109922. doi: 10.1016/j.pnpbp.2020.109922. Epub 2020 Mar 17. Prog Neuropsychopharmacol Biol Psychiatry. 2020. PMID: 32171903
-
Mild Neurocognitive Disorder: An Old Wine in a New Bottle.Harv Rev Psychiatry. 2015 Sep-Oct;23(5):368-76. doi: 10.1097/HRP.0000000000000084. Harv Rev Psychiatry. 2015. PMID: 26332219 Free PMC article. Review.
Cited by
-
Fluid biomarkers of the neurovascular unit in cerebrovascular disease and vascular cognitive disorders: A systematic review and meta-analysis.Cereb Circ Cogn Behav. 2024 Feb 23;6:100216. doi: 10.1016/j.cccb.2024.100216. eCollection 2024. Cereb Circ Cogn Behav. 2024. PMID: 38510579 Free PMC article.
-
Electrical Activity Changes and Neurovascular Unit Markers in the Brains of Patients after Cardiac Surgery: Effects of Multi-Task Cognitive Training.Biomedicines. 2024 Mar 28;12(4):756. doi: 10.3390/biomedicines12040756. Biomedicines. 2024. PMID: 38672112 Free PMC article.
-
Changes in S100 calcium-binding protein β (S100β) and cognitive function from pre- to post-chemotherapy among women with breast cancer.Brain Behav Immun Health. 2024 Sep 8;41:100860. doi: 10.1016/j.bbih.2024.100860. eCollection 2024 Nov. Brain Behav Immun Health. 2024. PMID: 39391795 Free PMC article.
-
Cognitive Dysfunction and Affective Mood Disorder Screening in Patients With Chronic Inflammatory Bowel Disease: Protocol for a Prospective Case-Control Study.JMIR Res Protoc. 2023 Oct 12;12:e50546. doi: 10.2196/50546. JMIR Res Protoc. 2023. PMID: 37824197 Free PMC article.
-
Research progress of neuron-specific enolase in cognitive disorder: a mini review.Front Hum Neurosci. 2024 Jul 8;18:1392519. doi: 10.3389/fnhum.2024.1392519. eCollection 2024. Front Hum Neurosci. 2024. PMID: 39040086 Free PMC article. Review.
References
-
- APA (2013). Diagnostic and Statistical Manual of Mental Disorders. Washington, DC: American Psychiatric Association.
-
- Beer C., Blacker D., Bynevelt M., Hankey G. J., Puddey B. I. (2010). Systemic markers of inflammation are independently associated with S100B concentration: results of an observational study in subjects with acute ischaemic stroke. J. Neuroinflammation 7, 5. 10.1186/1742-2094-7-71 - DOI - PMC - PubMed
LinkOut - more resources
Full Text Sources
Miscellaneous