. 2022 Jul 14:16:898346.
doi: 10.3389/fncel.2022.898346. eCollection 2022.

Microglial Engulfment of Spines in the Ventral Zona Incerta Regulates Anxiety-Like Behaviors in a Mouse Model of Acute Pain

Affiliations

Microglial Engulfment of Spines in the Ventral Zona Incerta Regulates Anxiety-Like Behaviors in a Mouse Model of Acute Pain

Zahra Farzinpour et al. Front Cell Neurosci. .

Abstract

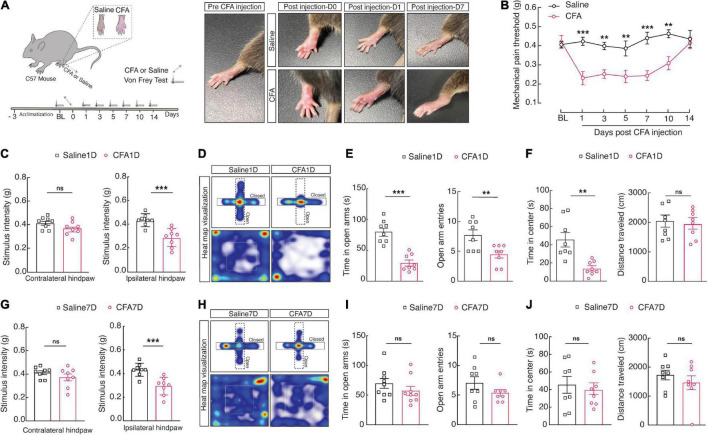
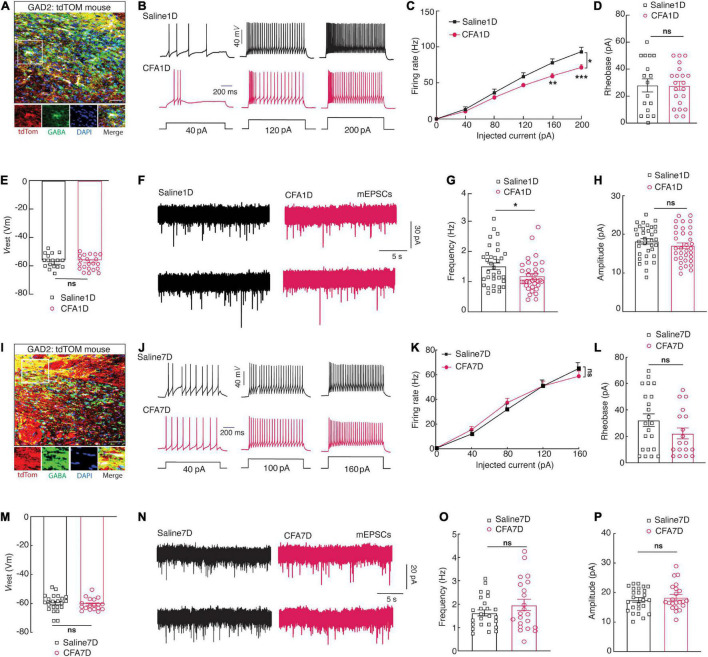
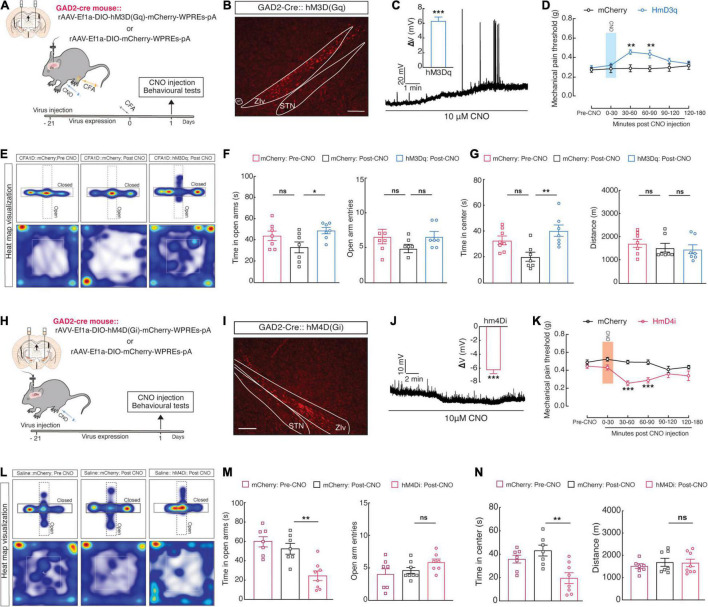
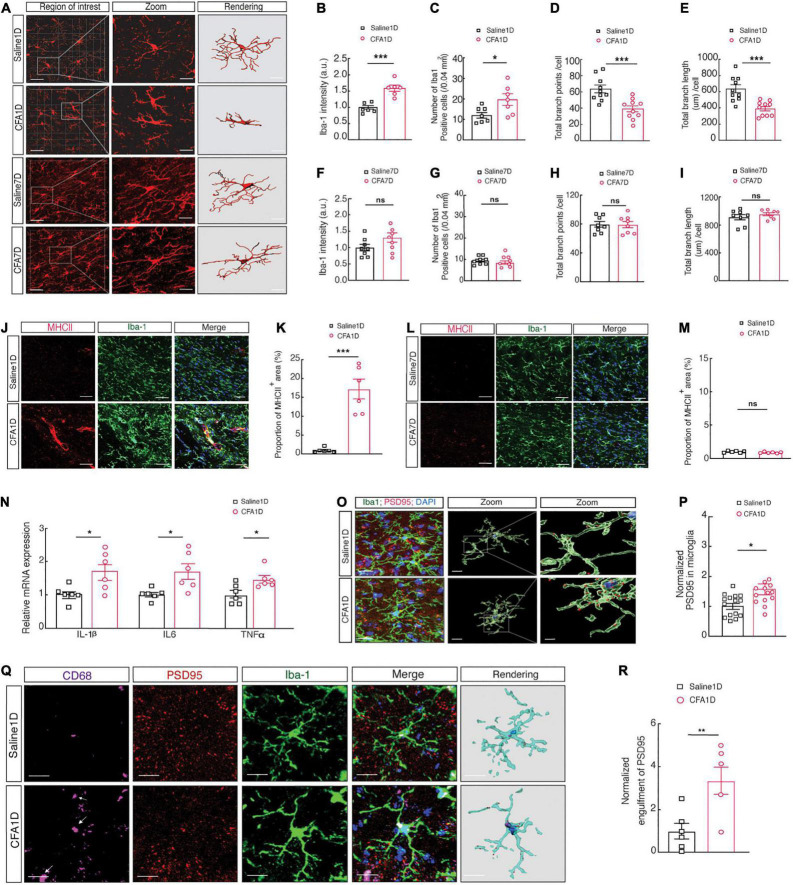
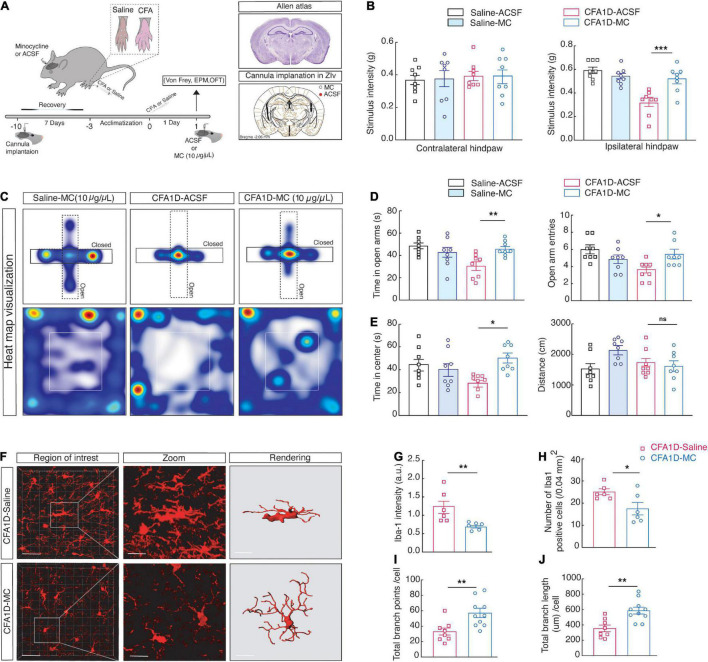
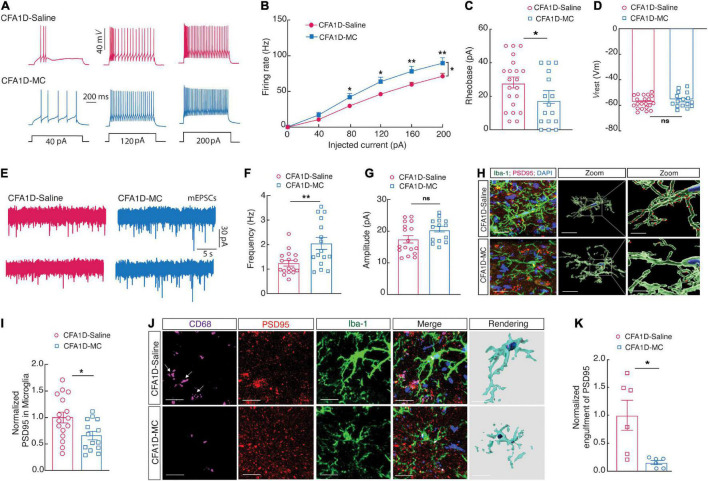
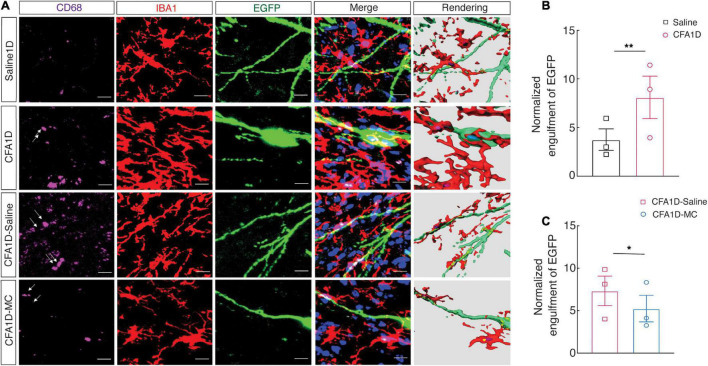
Although activation of microglial cells is critical in developing brain disorders, their role in anxiety-like behaviors in pain is still vague. This study indicates that alteration of microglia's neuronal spine engulfment capacity in ventral zona incerta (ZI V ) leads to significant pain and anxiety-like behaviors in mice 1-day post-injection of Complete Freud's Adjuvant (CFA1D). Performing whole-cell patch-clamp recordings in GABAergic neurons in the ZI V (ZI V GABA ) in brain slices, we observed decreased activity in ZIv GABA and reduced frequency of the miniature excitatory postsynaptic currents (mEPSCs) in ZI V GABA of CFA1D mice compared with the saline1D mice. Besides, chemogenetic activation of ZI V GABA significantly relieved pain and anxiety-like behaviors in CFA1D mice. Conversely, in naïve mice, chemogenetic inhibition of ZI V GABA induced pain and anxiety-like behaviors. Interestingly, we found changes in the density and morphology of ZI V Microglia and increased microglial engulfment of spines in ZI V of CFA1D mice. Furthermore, pain sensitization and anxiety-like behaviors were reversed when the ZI V Microglia of CFA1D-treated mice were chemically inhibited by intra-ZI V minocycline injection, accompanied by the recovery of decreased ZI V GABA excitability. Conclusively, our results provide novel insights that dysregulation of microglial engulfment capacity encodes maladaptation of ZI V GABA , thus promoting the development of anxiety-like behaviors in acute pain.

Keywords: GABAergic neurons; anxiety-like behaviors in pain; chemogenetic manipulation; dendritic spines; inflammatory pain model; microglial engulfment; zona incerta.


Conflict of interest statement

The authors declare that the research was conducted in the absence of any commercial or financial relationships that could be construed as a potential conflict of interest.

Figures

FIGURE 1
FIGURE 1
CFA1D mice demonstrate anxiety-like behaviors in acute pain. (A) Schematic diagram of the experiment paradigms for the CFA injection. (B) Time course of CFA-induced mechanical sensitivity on days 1, 3, 7, 10, and 14 post injection. Mechanical pain threshold; two-way ANOVA with Bonferroni post hoc analysis [Time × group interaction, F(5,854) = 3.930 and P = 0.0016]. (C) Performance of stimulus intensity of the contralateral and ipsilateral hind paw in saline1D- and -CFA1D mice (t14 = 1.741 and P = 0.1037 in contralateral hind paw, t14 = 4.393 and P = 0.006 in ipsilateral hind paw). Two-tailed unpaired t-test. (D) Representative animal heat tracks from saline1D- and CFA1D mice in EPM and OFT. (E,F) Performance of EPM and OFT on saline1D- and CFA1D mice (time in open arm; t14 = 6.200 and P < 0.001, open arm entries; t14 = 3.005 and P = 0.095, time in center; t14 = 3.76 and P = 0.0021, distance traveled; t14 = 0.56 and P = 0.58). (G) Performance of stimulus intensity of the contralateral and ipsilateral hind paw in saline7D- and CFA7D- mice (t14 = 1.185 and P = 0.2556 in contralateral hind paw, t14 = 4.193 and P = 0.0009 in ipsilateral hind paw). Two-tailed unpaired t-test. (H) Representative animal heat tracks from saline7D- and CFA7D mice in EPM and OFT. (I,J) Performance of EPM and OFT on saline7D- and CFA7D- mice (time in open arm; t16 = 1.118 and P = 0.2799, open arm entries; t14 = 1.414 and P = 0.1792, time in center; t14 = 0.5309 and P = 0.6038, distance traveled; t14 = 0.9066 and P = 0.38). All data are expressed as mean ± SEM. n = 8 mice per group. All data are expressed as mean ± SEM. **P < 0.01, and ***P < 0.001; ns, not significant.
FIGURE 2
FIGURE 2
CFA1D mice demonstrate a decrease in the ZIVGABA activity. (A) Confocal images of ZIVGABA from GAD-tdTOM mice. The white box depicts the area shown in the box of the ZIV. Scale bar, 50 μm. (B) Sample traces and (C) summarized statistical data for action potential firing recorded from ZIVGABA in mice treated with saline1D or CFA1D. Two-way ANOVA with Bonferroni post-tests [Time × group interaction, F(5,180) = 6.735 and P < 0.05]. (D–E) The alterations in action potential properties in (D), rheobase; t36 = 0.53 and P = 0.6012; (E) Vrest (mV); t36 = 0.527 and P = 0.6. (F) Sample traces of the mEPSCs from saline1D or CFA1D groups. (G,H) Summarized statistical data of (G) the frequency; t66 = 2.23 and P = 0.02; (H) the amplitude; t66 = 1.12 and P = 0.26 of CFA1D compared with saline1D mice. Action potential parameters were estimated from the initial evoked spike. n = 17–36 neurons per group. (I) Confocal images of ZIVGABA from GAD-tdTOM mice. The white box depicts the area shown in the box of the ZIV. Scale bar, 50 μm. (J) Sample traces and (K) summarized statistical data for action potential firing recorded from ZIVGABA in mice treated with saline7D or CFA7D. Two-way ANOVA with Bonferroni post-tests [Time × group interaction, F(1,21) = 1.403 and P = 0.2495]. (L,M) The alterations in action potential properties in (L), rheobase; t38 = 1.558 and P = 0.127; (M) Vrest (mV); t38 = 0.526 and P = 0.6. (N) Sample traces of the mEPSCs from saline7D or CFA7D groups. (O,P) Summarized statistical data of (O) the frequency; t45 = 1.26 and P = 0.21; (P) the amplitude; t45 = 0.72 and P = 0.47 of CFA7D compared with saline7D mice. Action potential parameters were estimated from the initial evoked spike. n = 22–25 neurons per group. All data are presented as mean ± SEM. *P < 0.05, **P < 0.01, and ***P < 0.001; ns, not significant.
FIGURE 3
FIGURE 3
Manipulation of ZIGABA activity regulates pain perception and anxiety-like behaviors. (A) Schematic showing unilateral injection of ZIV for chemogenetic manipulation and (B) diagram of viral injection of AAV-DIO-hM3Dq-mCherry (hM3Dq-mCherry) in the ZIV of GAD2-Cre mice. The scale bar is 200 μm. (C) A representative trace displays that bath application of CNO (10 μM) depolarized ZIvGABA, and statistics (right) show the average magnitude of depolarization (One sample t-test, t4 = 11.45 and P = 0.03). (D–G) Chemogenetic activation of ZIvGABA in GAD2-Cre mice affects anxiety-like behaviors in acute pain (Time in open arms: mCherry vs. hM3Dq, P = 0.0469, time in the center; mCherry vs. hM3Dq, P = 0.0036). (D) Mechanical pain threshold; two-way ANOVA with Bonferroni post-tests [Time × group interaction, F(5,65) = 2.235 and P = 0.01612]. (E) Representative animal heat tracks in mCherry vs. hM3Dq mice in EPM and OFT. (F) Time in open arms; ordinary one-way ANOVA with Turkeys’ post-test (mCherry vs. hM3Dq, P = 0.0469). (G) Time in the center; ordinary one-way ANOVA with Turkeys’ post-test (mCherry vs. hM3Dq, P = 0.0015). n = 7 mice per group. (H) Schematic of viral injection in the ZIV for chemogenetic manipulation and (I) diagram of bilateral injection of Cre recombinase-dependent AAV virus expressing hM4Di or mCherry AAV-DIO-hM4Di-mCherry (hM4Di-mCherry) into the ZIV of GAD2-Cre mice. The scale bar is 200 μm. (J) A representative trace from a whole-cell current-clamp electrophysiological recording shows that bath application of CNO (10 μM) hyperpolarizes ZIvGABA. Statistics (right) show the average magnitude of hyperpolarization (One sample t-test, t6 = 11.71 and P < 0.0001). (K–N) Chemogenetic inhibition of ZIvGABA in GAD2-Cre mice induces anxiety-like behaviors and pain in naïve mice. (K) Mechanical pain threshold; two-way ANOVA with Bonferroni post-tests [Time × group interaction, F(5,65) = 3.199 and P = 0.0121]. (L) Representative animal heat tracks in mCherry vs. hM4Di mice in EPM and OFT. (M) Time in open arms; ordinary one-way ANOVA with Turkeys’ post-test (mCherry vs. hM4Di, P = 0.0036). (N) Time in the center; ordinary one-way ANOVA with Turkeys’ post-test (mCherry vs. hM4Di, P = 0.0024). n = 7–8 mice per group. All data are expressed as mean ± SEM. *P < 0.05, **P < 0.01, ***P < 0.001, and ns, not significant.
FIGURE 4
FIGURE 4
Increased microglial cell activity and engulfment of ZIVGABA spines in CFA1D mice. (A) Fluorescence images displaying Iba-1 immunostaining (red) and 3D reconstruction of microglia in the ZIV of saline1D-, CFA1D-, saline7D- and CFA7D mice. The scale bars are 40 μm (overview) and 10 μm (inset and rendering). (B,C) Statistical data for the number of Iba-1+ cells per cubic millimeter (t10 = 2.46 and P = 0.029) and Iba-1 intensity (t10 = 5.42 and P = 0.003) in the ZIV from saline1D- and CFA1D mice. (D,E) Summary data of microglia branches endpoints (t18 = 4.07 and P = 0.0007) and total process lengths per cell of Iba-1+ microglia (t18 = 4.43 and P = 0.0003) in ZIv from saline1D and CFA1D mice. (F,G) Statistical data for the number of Iba-1+ cells per cubic millimeter (t14 = 0.9354 and P = 0.365) and Iba-1 intensity (t14 = 1.765 and P = 0.0994) in the ZIV from saline7D- and CFA7D mice. (H,I) Summary data of total microglia endpoints (t14 = 0.06 and P = 0.953), and total branches lengths per cell of Iba-1+ microglia (t14 = 0.965 and P = 0.3505) in ZIv from saline7D and CFA7D mice. (J,K) Representative images (left) and quantitative analyses (right) of immunostaining for Iba-1 (green) and MHCII (red) (t10 = 6.178 and P = 0.0001) in the ZIV of saline1D- or CFA1D-treated mice. Scale bar, 10 μm. (L,M) Representative images (left) and quantitative analyses (right) of immunostaining for Iba-1 (green) and MHCII (red) (t10 = 1.799 and P = 0.1022) in the ZIV of saline7D- or CFA7D-treated mice. Scale bar, 10 μm. (N) qPCR analysis of IL-1β (t10 = 2.719 and P = 0.0216), IL6 (t10 = 2.901 and P = 0.0158), and TNFα (t10 = 2.740 and P = 0.0208) mRNA in ZIV tissues from saline1D and CFA1D mice. (O) Illustrative images and 3D reconstruction surface rendering of Iba-1+ microglia (green) including PSD95+ puncta (red) and DAPI (blue) in the ZIV from saline1D- and CFA1D- treated mice. Scale bars, 10 μm (overview) and 2 μm (inset and rendering). (P) PSD95+ puncta’s quantification of microglia in slices (t26 = 2.71 and P = 0.011, n = 14–16 slices per group from four mice) as showed in (O). (Q,R) Representative images (left) and quantitative analyses (right) of immunostaining for Iba-1 (green), CD68 (purple), and PSD95 (red) (t10 = 3.212 and P = 0.0093) in the ZIV of saline1D- or CFA1D-treated mice. Scale bar, 10 μm. All data are presented as mean ± SEM. n = 6–10 slices per group from three mice. Unpaired-t test. *P < 0.05; **P < 0.01, and ***P < 0.001; ns, not significant.
FIGURE 5
FIGURE 5
Inactivating microglial cells in ZIV of CFA1D mice reverses anxiety-like behavior in pain and the dynamic modifications of microglial status. (A) Schematic diagram of the experiment and cannula implantation in ZIV. (B) Stimulus intensity of the ipsilateral (P = 0.002) and contralateral (P > 0.9) hind paws CFA1D mice during intra- ZIV injection of minocycline (10 μg/μL) or ACSF, Ordinary one-way ANOVA with Bonferroni’s multiple comparisons tests. (C–E) Heat map visualization and statistics data from EPM [Time in open arm (P = 0.0024), open-arm entries] and OFT [Time in the center (P = 0.0114) and distance traveled] apparatuses in CFA1D mice during intra- ZIV injection of minocycline (10 μg/μL) or ACSF, n = 8 mice per group. (F) Fluorescence images of Iba-1+ cells from CFA1D mice with saline or minocycline, scale bar, 20 μm. Sections show a detailed view of the white box; scale bar, 10 μm. (G–J) Statistical data for the Iba-1+ cell’s number, Iba-1 intensity, endpoints, and process lengths per cell. n = 6 slices per group from three mice. (G,H) Statistical data for the number of Iba-1+ cells per cubic millimeter (Iba-1+ cells; t10 = 2.448 and P = 0.0344) and Iba-1 intensity (Iba-1 intensity; t10 = 3.29 and P = 0.0081) in the ZIV from saline- and minocycline treated CFA1D mice. (I,J) Summary data of microglia total branches endpoints (t16 = 3.054 and P = 0.0076) and all process lengths per cell of Iba-1+ microglia (t16 = 3.65 and P = 0.0022) in ZIV from saline- and minocycline treated CFA1D. All data are expressed as mean ± SEM. n = 6–11 slices per group from three mice. *P < 0.05, **P < 0.01, ***P < 0.001; ns, not significant.
FIGURE 6
FIGURE 6
Blockade of microglial activation affects ZIVGABA activity and microglial engulfment of ZIV neuronal spines in CFA1D mice. (A) Sample traces and (B) summarized statistical data for action potential firing recorded from ZIVGABA in CFA1D mice treated with saline or minocycline. Two-way ANOVA with Bonferroni post-tests [Time × group interaction, F(5,175) = 3.78 and P = 0.0028]. (C,D) The alterations in action potential properties in (C) rheobase (t35 = 0.98 and P = 0.33); (D) Vrest (mV) (t26 = 0.98 and P = 0.33); (E) sample traces of the mEPSCs from CFA1D mice treated with saline or minocycline. (F,G) Summarized statistical data of (F) the frequency (t31 = 3.05 and P = 0.0046); (G) the amplitude (t30 = 1.92 and P = 0.06) of CFA1D mice treated with saline or minocycline. Action potential parameters were estimated from the initial evoked spike. n = 16–21 neurons per group. (H) Representative images and quantification of Iba-1+ microglia (green) containing PSD95+ puncta (red) in the ZIV from CFA-treated mice treated with minocycline or saline. Scale bars, 10 μm (overview) and 2 μm (inset and rendering). (I) PSD95+ puncta’s quantification of microglia in slices (t26 = 2.55 and P = 0.016). n = 14–16 slices per group from four mice. (J,K) Representative images (left) and quantitative analyses (right) of immunostaining for Iba-1 (green), CD68 (purple), and PSD95 (red) in the ZIV of saline1D- or CFA1- mice treated with minocycline slices (t10 = 3.117 and P = 0.0109). Scale bar, 10 μm. Unpaired t-test. All data are presented as mean ± SEM. *P < 0.05 and **P < 0.01; ns, not significant.
FIGURE 7
FIGURE 7
The interactions of the microglial processes and dendritic spines of ZIVGABA. (A) Representative immunofluorescence images and 3D rendering of CD68 (purple), Iba-1 (red), and EGFP (green) of AAV-sparse-CSSP-YFP-8E3 virus into ZIV in the indicated groups. (B) Quantification of EGFP+ dendritic spines (green) containing Iba-1+ microglia (red) in the ZIV from CFA1D and saline mice (t10 = 3.21 and P = 0.0093). (C) Quantification of EGFP+ dendritic spines (green) Iba-1+ microglia (red) in the ZIV from saline and minocycline treatment of CFA1D mice (t10 = 3.117 and P = 0.0109). Scale bars, 10 μm. Unpaired t-test. *P < 0.05 and **P < 0.01; ns, not significant.

Similar articles

Cited by

References

    1. Ahmed A., Wang L.-L., Abdelmaksoud S., Aboelgheit A., Saeed S., Zhang C.-L. (2017). Minocycline modulates microglia polarization in ischemia-reperfusion model of retinal degeneration and induces neuroprotection. Sci. Rep. 7 1–16. 10.1038/s41598-017-14450-5 - DOI - PMC - PubMed
    1. Altarifi A., Alsalem M., Mustafa A. (2019). Effects of intraplantar administration of Complete Freund’s Adjuvant (CFA) on rotarod performance in mice. Scand. J. Pain 19 805–811. 10.1515/sjpain-2018-0358 - DOI - PubMed
    1. Andrews Z. B., Liu Z.-W., Walllingford N., Erion D. M., Borok E., Friedman J. M. (2008). UCP2 mediates ghrelin’s action on NPY/AgRP neurons by lowering free radicals. Nature 454 846–851. 10.1038/nature07181 - DOI - PMC - PubMed
    1. Ang S. T., Lee A. T. H., Foo F. C., Ng L., Low C.-M., Khanna S. (2015). GABAergic neurons of the medial septum play a nodal role in facilitation of nociception-induced affect. Sci. Rep. 5 1–21. 10.1038/srep15419 - DOI - PMC - PubMed
    1. Augusto-Oliveira M., Arrifano G. P., Delage C., I, Tremblay M. E., Crespo-Lopez M. E., Verkhratsky A. (2022). Plasticity of microglia. Biol. Rev. 97 217–250. - PubMed

LinkOut - more resources