

Irisin/FNDC5 influences myogenic markers on skeletal muscle following high and moderate-intensity exercise training in STZ-diabetic rats
- PMID: 35910290
- PMCID: PMC9325938
- DOI: 10.1007/s13205-022-03253-9
Irisin/FNDC5 influences myogenic markers on skeletal muscle following high and moderate-intensity exercise training in STZ-diabetic rats
Abstract
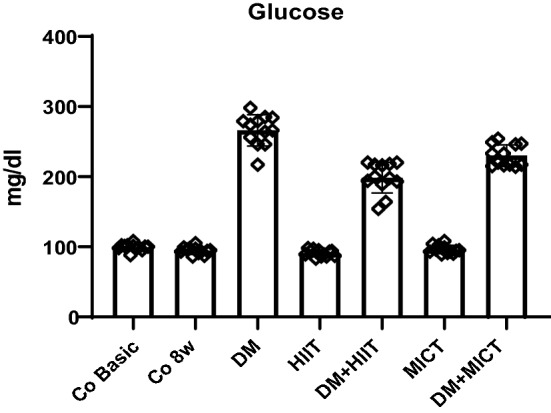
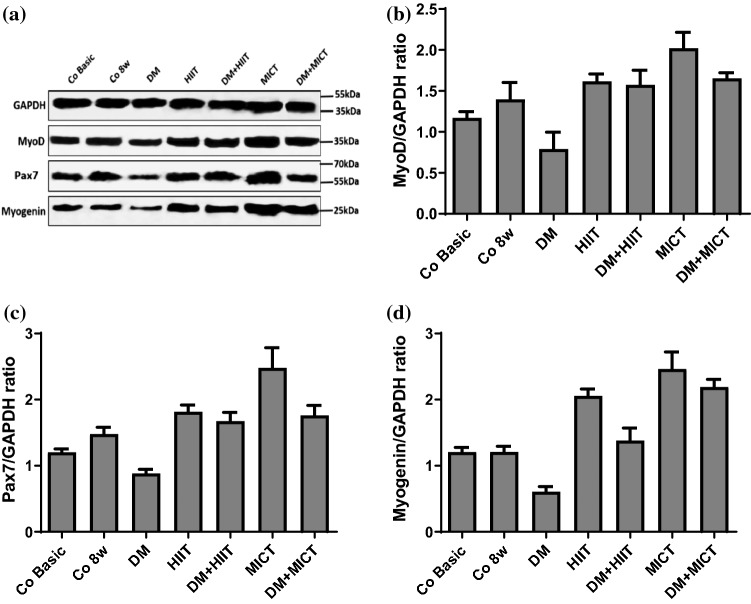
In the present study, we investigated the effects of high-intensity interval training (HIIT) versus moderate-intensity continuous training (MICT) on irisin and expression of myogenic markers (paired box 7 (Pax7), myogenic differentiation 1 (MyoD), myogenin) in skeletal muscle of diabetic rats. Eighty-four male Wistar rats (6 weeks of age) were randomly divided into seven groups (n = 12): basic control (Co Basic), 8 weeks control (Co 8w), diabetes mellitus (DM), HIIT, DM + HIIT, MICT, and DM + MICT groups. Diabetes was induced by intraperitoneal injection of streptozotocin (STZ). The protocol was characterized by running on a rodent treadmill with moderate intensity (60-70% ), 60 min per session, 5 days/week, for 6 weeks. HIIT consisted of six 3-min runs at a high intensity (80-90% ) alternated with 2-min running at low intensity (50% ), 30 min per session, 5 days/week, for 6 weeks. Results showed that DM decreased myoblast markers compared to Co Basic and Co 8w groups. Fibronectin type III domain-containing protein 5 (FNDC5) mRNA decrease was correlated with myoblast markers (Pax7 r = 0.632, p = 0.027; MyoD r = 0.999, p = 0.001; myogenin r = 1.000, p = 0.001) in DM group. DM + MICT significantly increased gene expression of MyoD, myogenin, and FNDC5 compared to DM and DM + HIIT. The results also showed that the intensity and duration of exercise on the treadmill were effective in stimulating irisin and myogenic markers after DM.
Keywords: Diabetes; Exercise training; Irisin; Muscle cell; Pax7; Satellite cells.
© King Abdulaziz City for Science and Technology 2022.
Conflict of interest statement
Conflict of interestThe authors declare that there are no conflicts of interest.
Figures


Similar articles
-
Comparative effects of high-intensity interval training and moderate-intensity continuous training on soleus muscle fibronectin type III domain-containing protein 5, myonectin and glucose transporter type 4 gene expressions: a study on the diabetic rat model.Mol Biol Rep. 2021 Aug;48(8):6123-6129. doi: 10.1007/s11033-021-06633-1. Epub 2021 Aug 10. Mol Biol Rep. 2021. PMID: 34374894
-
High-intensity interval training changes the expression of muscle RING-finger protein-1 and muscle atrophy F-box proteins and proteins involved in the mechanistic target of rapamycin pathway and autophagy in rat skeletal muscle.Exp Physiol. 2019 Oct;104(10):1505-1517. doi: 10.1113/EP087601. Epub 2019 Aug 29. Exp Physiol. 2019. PMID: 31357248
-
Metabolic cross-talk between skeletal muscle and adipose tissue in high-intensity interval training vs. moderate-intensity continuous training by regulation of PGC-1α.Eat Weight Disord. 2020 Feb;25(1):17-24. doi: 10.1007/s40519-018-0491-4. Epub 2018 Feb 26. Eat Weight Disord. 2020. PMID: 29480414
-
High-Intensity Interval Training Mitigates Sarcopenia and Suppresses the Myoblast Senescence Regulator EEF1E1.J Cachexia Sarcopenia Muscle. 2024 Dec;15(6):2574-2585. doi: 10.1002/jcsm.13600. Epub 2024 Sep 14. J Cachexia Sarcopenia Muscle. 2024. PMID: 39276001 Free PMC article.
-
Irisin and its role in the reproductive physiology: a review.Braz J Biol. 2025 May 26;85:e291896. doi: 10.1590/1519-6984.291896. eCollection 2025. Braz J Biol. 2025. PMID: 40435081 Review.
Cited by
-
Effects of Pretreatment With Coenzyme Q10 (CoQ10) and High-Intensity Interval Training (HIIT) on FNDC5, Irisin, and BDNF Levels, and Amyloid-Beta (Aβ) Plaque Formation in the Hippocampus of Aβ-Induced Alzheimer's Disease Rats.CNS Neurosci Ther. 2025 Feb;31(2):e70221. doi: 10.1111/cns.70221. CNS Neurosci Ther. 2025. PMID: 39957598 Free PMC article.
-
Effect of induced diabetes on morphometric indexes of the cerebellar cortex and gene expression in C57BL mice.Iran J Basic Med Sci. 2023;26(12):1444-1448. doi: 10.22038/IJBMS.2023.71172.15457. Iran J Basic Med Sci. 2023. PMID: 37970442 Free PMC article.
-
Impact of Exercise Intensity on Cerebral BDNF Levels: Role of FNDC5/Irisin.Int J Mol Sci. 2024 Jan 19;25(2):1213. doi: 10.3390/ijms25021213. Int J Mol Sci. 2024. PMID: 38279218 Free PMC article.
-
The Role of Adipokines in Spinal Disease: A Narrative Review.JOR Spine. 2025 Jun 3;8(2):e70083. doi: 10.1002/jsp2.70083. eCollection 2025 Jun. JOR Spine. 2025. PMID: 40470308 Free PMC article. Review.
References
-
- Akagawa M, Miyakoshi N, Kasukawa Y, Ono Y, Yuasa Y, Nagahata I, Sato C, Tsuchie H, Nagasawa H, Hongo M. Effects of activated vitamin D, alfacalcidol, and low-intensity aerobic exercise on osteopenia and muscle atrophy in type 2 diabetes mellitus model rats. PLoS ONE. 2018;13(10):e0204857. - PMC - PubMed
-
- Aragno M, Mastrocola R, Catalano MG, Brignardello E, Danni O, Boccuzzi G. Oxidative stress impairs skeletal muscle repair in diabetic rats. Diabetes. 2004;53(4):1082–1088. - PubMed
LinkOut - more resources
Full Text Sources
