

Opto-Electrostatic Determination of Nucleic Acid Double-Helix Dimensions and the Structure of the Molecule-Solvent Interface
- PMID: 35910310
- PMCID: PMC9330769
- DOI: 10.1021/acs.macromol.2c00657
Opto-Electrostatic Determination of Nucleic Acid Double-Helix Dimensions and the Structure of the Molecule-Solvent Interface
Abstract
A DNA molecule is highly electrically charged in solution. The electrical potential at the molecular surface is known to vary strongly with the local geometry of the double helix and plays a pivotal role in DNA-protein interactions. Further out from the molecular surface, the electrical field propagating into the surrounding electrolyte bears fingerprints of the three-dimensional arrangement of the charged atoms in the molecule. However, precise extraction of the structural information encoded in the electrostatic "far field" has remained experimentally challenging. Here, we report an optical microscopy-based approach that detects the field distribution surrounding a charged molecule in solution, revealing geometric features such as the radius and the average rise per basepair of the double helix with up to sub-Angstrom precision, comparable with traditional molecular structure determination techniques like X-ray crystallography and nuclear magnetic resonance. Moreover, measurement of the helical radius furnishes an unprecedented view of both hydration and the arrangement of cations at the molecule-solvent interface. We demonstrate that a probe in the electrostatic far field delivers structural and chemical information on macromolecules, opening up a new dimension in the study of charged molecules and interfaces in solution.
© 2022 The Authors. Published by American Chemical Society.
Conflict of interest statement
The authors declare no competing financial interest.
Figures

 , in a representative trap (top). Labels
“1” and “2” denote locations of the molecule
outside and inside the potential well, respectively, and refer to
spatial locations in the trapping nanostructure depicted in the device
schematic in (a). A time course of optical images in a single trap
(bottom) displays the duration of a single recorded residence event
of duration, Δt. (c) Probability density distributions, P(Δt), of escape times, Δt, for N = 104 escape events
for measurements on double-stranded B-DNA (solid lines) and A-RNA
(dashed lines) in 1.23 mM LiCl for fragment length nb = 30 (red), 40 (blue), and 60 (green) basepairs fitted
to the expression
, in a representative trap (top). Labels
“1” and “2” denote locations of the molecule
outside and inside the potential well, respectively, and refer to
spatial locations in the trapping nanostructure depicted in the device
schematic in (a). A time course of optical images in a single trap
(bottom) displays the duration of a single recorded residence event
of duration, Δt. (c) Probability density distributions, P(Δt), of escape times, Δt, for N = 104 escape events
for measurements on double-stranded B-DNA (solid lines) and A-RNA
(dashed lines) in 1.23 mM LiCl for fragment length nb = 30 (red), 40 (blue), and 60 (green) basepairs fitted
to the expression  . In order to enable comparison across different
molecular species, P(Δt) data
series are rescaled such that the maximum value is 1. Average escape
times, tesc, and measured effective charge
values, qm, are as follows: tesc,30B = 52.2 ± 0.3 ms (qm,30B = −25.28 ± 0.07e), tesc,40B 93.9 ± 0.4 ms (
. In order to enable comparison across different
molecular species, P(Δt) data
series are rescaled such that the maximum value is 1. Average escape
times, tesc, and measured effective charge
values, qm, are as follows: tesc,30B = 52.2 ± 0.3 ms (qm,30B = −25.28 ± 0.07e), tesc,40B 93.9 ± 0.4 ms ( 30.46 ± 0.06e), and
  242.5 ± 1.1 ms (
 40.71 ± 0.07e) for
B-DNA and
40.71 ± 0.07e) for
B-DNA and  46.3 ± 0.2 ms (−23.86
±
0.04e),
46.3 ± 0.2 ms (−23.86
±
0.04e),  70.4 ± 0.8 ms (−28.35
±
0.13e), and
70.4 ± 0.8 ms (−28.35
±
0.13e), and  192.5 ± 0.6 ms (−37.26
±
0.04e) for A-RNA. B-DNA systematically displays 10–20%
longer escape times and higher magnitudes of effective charge than
A-RNA. Space filling structures of B-DNA and A-RNA reproduced with
permission from ref (3) (right).
192.5 ± 0.6 ms (−37.26
±
0.04e) for A-RNA. B-DNA systematically displays 10–20%
longer escape times and higher magnitudes of effective charge than
A-RNA. Space filling structures of B-DNA and A-RNA reproduced with
permission from ref (3) (right).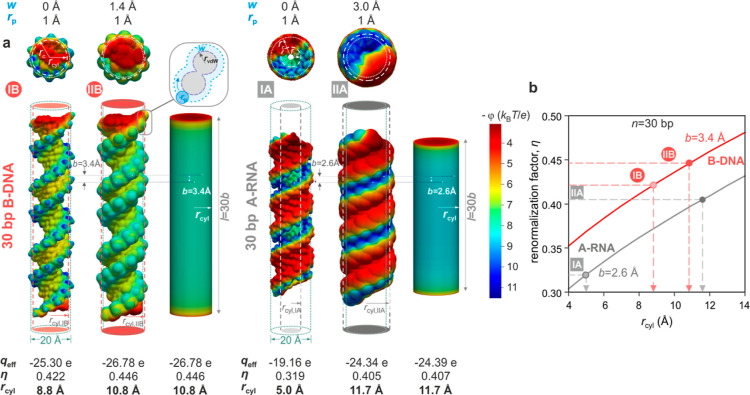
 60e with radii,
  10.8 Å and
  11.7 Å, respectively, and length 30b Å in each case. The radius of the equivalent cylinder,
  (dashed
lines), may be compared with a
nominal double-helical radius rc = 10
Å (dotted lines). (b) Calculated trends for the renormalization
factor,
(dashed
lines), may be compared with a
nominal double-helical radius rc = 10
Å (dotted lines). (b) Calculated trends for the renormalization
factor,  , for cylinders of radius
  and length 30b Å,
with nominal values of b = 3.4 Å for B-DNA (red
line) and 2.6 Å for A-RNA (gray line). η values for the
four molecular models can be related to those for smooth cylinders
and correspond to
and length 30b Å,
with nominal values of b = 3.4 Å for B-DNA (red
line) and 2.6 Å for A-RNA (gray line). η values for the
four molecular models can be related to those for smooth cylinders
and correspond to  8.8 Å(effective
vdW surface),
8.8 Å(effective
vdW surface),  10.8 Å (effective SAS),
  5 Å (vdWS),
and
5 Å (vdWS),
and  11.7 Å (SAS), two of which are depicted
in (a). Panels are reproduced from ref (48), with the permission of AIP Publishing.
11.7 Å (SAS), two of which are depicted
in (a). Panels are reproduced from ref (48), with the permission of AIP Publishing.
 for each molecular species of length n bp, in conjunction
with the corresponding calculated 2D
function (colored surface) for the effective charge,
for each molecular species of length n bp, in conjunction
with the corresponding calculated 2D
function (colored surface) for the effective charge,  , generates a curve of possible solutions
in b and r. Intersection of three
such curves for n = 30, 40, and 60 bp yields a probability-weighted
manifold of solutions from which measured values, bm and rm, for the rise and
radius, respectively, of each helix form can be obtained. (b) Measured b–r probability manifolds for B-DNA
(top) and A-RNA (bottom) for an experiment performed in 1.2 mM CsCl.
Since fM ≠ 1 in experiments, measured b–r manifolds are broader than those
in the ideal case depicted in (a) yielding
, generates a curve of possible solutions
in b and r. Intersection of three
such curves for n = 30, 40, and 60 bp yields a probability-weighted
manifold of solutions from which measured values, bm and rm, for the rise and
radius, respectively, of each helix form can be obtained. (b) Measured b–r probability manifolds for B-DNA
(top) and A-RNA (bottom) for an experiment performed in 1.2 mM CsCl.
Since fM ≠ 1 in experiments, measured b–r manifolds are broader than those
in the ideal case depicted in (a) yielding  3.2 Å and
  10.4 Å and
  2.6 Å and
  12.5 Å for B-DNA and A-RNA, respectively.
 3.1 ± 0.1 Å and
  2.5 ± 0.1 Å.
Helical radius data
were fit with a function of the form
2.5 ± 0.1 Å.
Helical radius data
were fit with a function of the form  , yielding
  10.5 ± 0.6 Å
and
10.5 ± 0.6 Å
and  11.8 ± 0.6 Å. The slope, k = 0.8 ±
0.2, is a shared fit parameter in both relationships.
(b) Cylinder of radius
11.8 ± 0.6 Å. The slope, k = 0.8 ±
0.2, is a shared fit parameter in both relationships.
(b) Cylinder of radius  10.5
10.5  (blue
dashed cylinder) depicting that the
effective cylinder in model-IIB of B-DNA is superimposed for comparison
on the vdW molecular surface in model-IB (gray dashed cylinder). k = 0.8 ± 0.2 suggests that the distance of the closest
approach of screening cations to the molecular surface is directly
related to the radius of the hydrated cation species, aH. The resulting effective “ion accessible surface”
(IAS) is the distance from the molecular axis beyond which the point-ion
description of the electrolyte may be invoked (red, green, and blue
dotted lines). The molecular structure may carry bound ions (yellow
spheres) whose charge is included in
(blue
dashed cylinder) depicting that the
effective cylinder in model-IIB of B-DNA is superimposed for comparison
on the vdW molecular surface in model-IB (gray dashed cylinder). k = 0.8 ± 0.2 suggests that the distance of the closest
approach of screening cations to the molecular surface is directly
related to the radius of the hydrated cation species, aH. The resulting effective “ion accessible surface”
(IAS) is the distance from the molecular axis beyond which the point-ion
description of the electrolyte may be invoked (red, green, and blue
dotted lines). The molecular structure may carry bound ions (yellow
spheres) whose charge is included in  . (c)
For A-RNA, model-IIA which includes
a SAS of thickness w = 3 Å meets the condition
. (c)
For A-RNA, model-IIA which includes
a SAS of thickness w = 3 Å meets the condition  12 Å
(blue dashed cylinder). (d) Extrapolating
the inferred structure of the molecule–electrolyte interface
in (b) to a view of a macroscopic interface in solution where w < 3 Å.
12 Å
(blue dashed cylinder). (d) Extrapolating
the inferred structure of the molecule–electrolyte interface
in (b) to a view of a macroscopic interface in solution where w < 3 Å.References
-
- Tjandra N.; Tate S.-i.; Ono A.; Kainosho M.; Bax A. The NMR structure of a DNA dodecamer in an aqueous dilute liquid crystalline phase. J. Am. Chem. Soc. 2000, 122, 6190–6200. 10.1021/ja000324n. - DOI
LinkOut - more resources
Full Text Sources