Review
. 2022 Jul 15:13:853568.
doi: 10.3389/fphar.2022.853568. eCollection 2022.

The Role of Imaging Biomarkers to Guide Pharmacological Interventions Targeting Tumor Hypoxia

Affiliations
Review

The Role of Imaging Biomarkers to Guide Pharmacological Interventions Targeting Tumor Hypoxia

Bernard Gallez. Front Pharmacol. .

Abstract

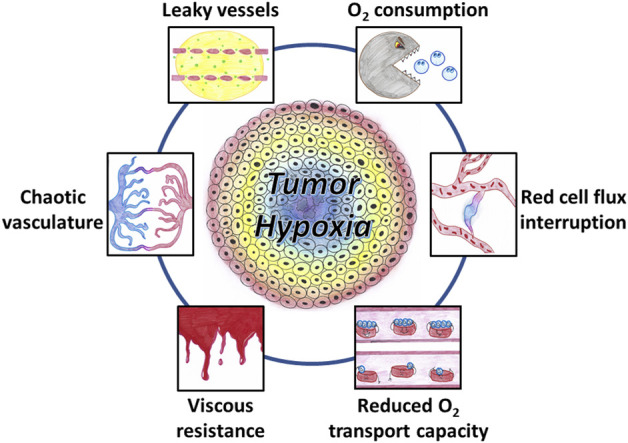
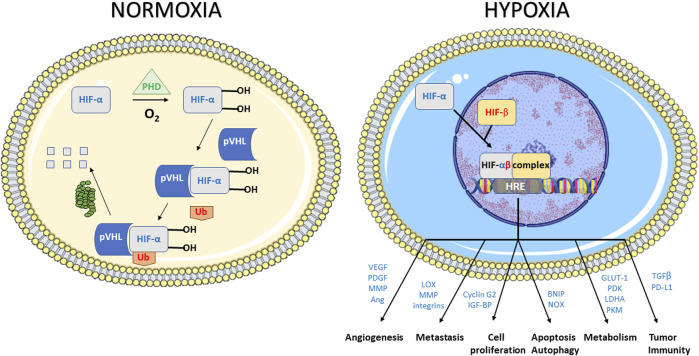
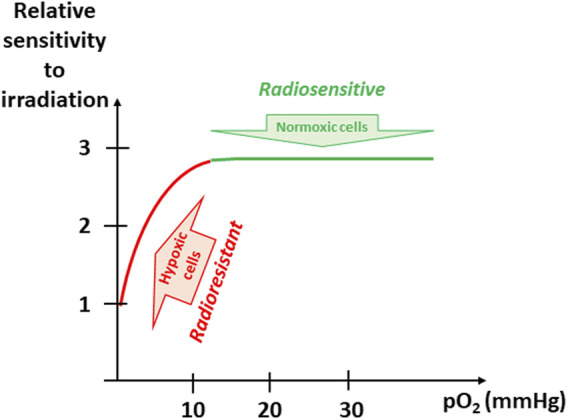
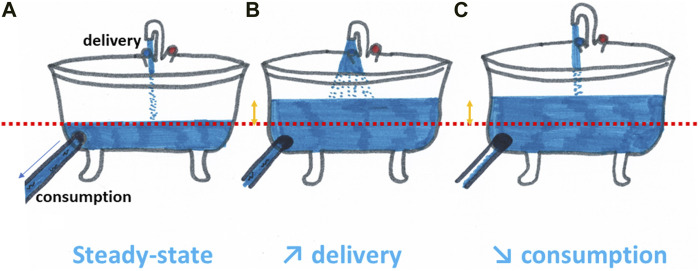
Hypoxia is a common feature of solid tumors that contributes to angiogenesis, invasiveness, metastasis, altered metabolism and genomic instability. As hypoxia is a major actor in tumor progression and resistance to radiotherapy, chemotherapy and immunotherapy, multiple approaches have emerged to target tumor hypoxia. It includes among others pharmacological interventions designed to alleviate tumor hypoxia at the time of radiation therapy, prodrugs that are selectively activated in hypoxic cells or inhibitors of molecular targets involved in hypoxic cell survival (i.e., hypoxia inducible factors HIFs, PI3K/AKT/mTOR pathway, unfolded protein response). While numerous strategies were successful in pre-clinical models, their translation in the clinical practice has been disappointing so far. This therapeutic failure often results from the absence of appropriate stratification of patients that could benefit from targeted interventions. Companion diagnostics may help at different levels of the research and development, and in matching a patient to a specific intervention targeting hypoxia. In this review, we discuss the relative merits of the existing hypoxia biomarkers, their current status and the challenges for their future validation as companion diagnostics adapted to the nature of the intervention.

Keywords: biomarker; cancer; imaging; oxygen; predictive marker; theranostics; therapy; tumor hypoxia.


Conflict of interest statement

The authors declare that the research was conducted in the absence of any commercial or financial relationships that could be construed as a potential conflict of interest.

Figures

FIGURE 1
FIGURE 1
Factors contributing to the occurrence of tumor hypoxia. The tumor vasculature is chaotic, showing abnormal vascular density, contour irregularities, enlarged vessels, and vessels with blind ends. The increased leakiness of immature vessels results in an increased interstitial fluid pressure. Increased viscous resistance may contribute the vascular stasis. Tumor-associated anemia leads to a reduced oxygen transport capacity. Cycling hypoxia results from transient stasis in flow and transient interruption in red blood cell flux. Oxygen utilization by a large density of tumor cells with a high degree of metabolic activity and proliferation also contributes to tumor hypoxia.
FIGURE 2
FIGURE 2
Response to hypoxic stress mediated by the hypoxia inducible factors (HIFs). HIF1s are heterodimeric proteins that consist of two proteins, HIF1-α and HIF1-β. In normoxia, HIF1-α undergoes proteasomal degradation by a mechanism that involves hydroxylation of proline residues on HIF1-α by prolyl hydroxylases (PHDs) and subsequent ubiquitination by the pVHL (von Hippel Lindau) system. In hypoxia, the PHDs lose their activity, the hydroxylation of the HIF1-α subunit is inhibited without subsequent degradation. The non-hydroxylated, stabilized HIF1-α subunits translocate to the nucleus where they dimerize with constitutively expressed HIF1-β subunit, and bind to DNA to initiate gene transcription. Illustrative genes that are transcriptionally activated by HIF-1 included those involved in angiogenesis, invasion and metastasis cell proliferation, apoptosis and autophagy, metabolism and tumor immunity.
FIGURE 3
FIGURE 3
Evolution of sensitivity to irradiation as a function of pO2. The “oxygen enhancement ratio” (OER, the ratio of doses required to obtain the same cell survival under hypoxic and aerobic conditions) varies from 2.5 to 3.0, indicating that hypoxic tumor cells will require a dose 2.5–3 times higher to be killed than normoxic cells. The OER is dramatically increasing when pO2 is rising from 1 to 10 mmHg (found in hypoxic tumors). Above this value of 10 mmHg, further increase in pO2 does not further enhance the radiosensitivity.
FIGURE 4
FIGURE 4
Increasing tumor oxygenation can be compared with the filling of a bath. To rise the water level in a bathtub compared to the steady state (A), you may either increase the water supply by playing with the faucet (B) or decrease the opening of the draining plug (C). In a similar manner, pharmacological strategies aimed at increasing the tumor oxygenation are targeting either the oxygen delivery (through an increase in perfusion, a decrease in blood viscosity or a better release of oxygen from hemoglobin) or the oxygen consumption (through the decrease of metabolic activity of the tumor cells).
FIGURE 5
FIGURE 5
Rationale for combining HAP (hypoxia-activated prodrugs) with radiation therapy. HAPs are selectively killing hypoxic cells (Left) while radiation therapy is efficient in killing non-hypoxic cells (Middle). There is a major interest for combining both approaches for a maximal response (Right).
FIGURE 6
FIGURE 6
Graphical depiction of the identification of reoxygenation timing to radiosensitize tumors. Left: Longitudinal measurements of oxygenation (for example, using EPR oximetry) allows to define the window of reoxygenation after a pharmacological treatment (Tx). Depending of the treatment used and designed to alleviate tumor hypoxia, the window of reoxygenation may occur minutes, hours or days after initiation of a treatment. Middle: tumor regrowth delay experiment. Non-treated tumors (black) will progress regularly over time. Irradiated tumors (yellow) using suboptimal dose will typically present a transient decrease in tumor size due to the cytotoxic effect in a fraction of tumor cells before regrowing. The combination of a treatment together with irradiation administered outside the window of reoxygenation (red) will not lead to an increase in regrowth delay. The combination of the treatment with irradiation in the optimal timing of reoxygenation (green) is increasing the regrowth delay as more cells are killed by the irradiation. Right: Kaplan Meier curve representing the surviving fraction as a function of time depending on the treatment (colors represent the same groups than in the middle panel).
FIGURE 7
FIGURE 7
Radiolabelled nitroimidazoles. Top: Inside cells, nitroimidazoles (RNO2) are metabolized by reduction. This process is reversible under normoxic conditions leading to an equilibrium of the nitroimidazoles between the intra- and extracellular compartment. However, if cells are hypoxic, the radiotracer is further reduced and trapped by reacting with cellular macromolecules. Bottom: structures of commonly used radiolabeled nitroimidazoles (18F-FMISO, 18F-FAZA, 18F-HX4).
FIGURE 8
FIGURE 8
18F-FAZA as predictor of tumor response to radiation therapy. (A) In vivo calibration of 18F-FAZA tumor accumulation (measured by microPET) as a function of tumor pO2 (measured by EPR oximetry) in the same rhabdomyosarcoma tumors. (B) Growth time delay as a function of tumor uptake of 18F-FAZA (measured by microPET) in cohorts of animals breathing air or carbogen. The yellow arrow indicates a tumor-to-background ratio (T/B) corresponding to 10 mmHg (higher T/B means more hypoxic than this value while lower T/B means less hypoxic). (C,D) Value of 18F-FAZA tumor accumulation to predict the outcome of a treatment combining nimorazole together with irradiation. (C) for non-hypoxic tumors, no significant benefit (p > 0.05) was observed when tumors were treated by a combination of irradiation together with nimorazole (n = 7) compared to tumors treated with irradiation alone (n = 7). (D) for hypoxic tumors, a significant benefit was observed when tumors were treated by a combination of irradiation together with nimorazole (n = 9) compared to tumors treated with irradiation alone (n = 5). The figures are built with data from (Tran et al., 2012), (Tran et al., 2014), and (Tran et al., 2015).
FIGURE 9
FIGURE 9
Comparison between measuring tumor oxygenation with hypoxia biomarkers and measuring temperature in a sauna. The direct way to measure the temperature is to use a thermometer. Translated in the hypoxia world, it corresponds to direct measurements of tissue oxygenation (pO2 histography, optic fibres, EPR oximetry, 19F-relaxometry). Another approach is to measure the temperature of the circulating water in the heater. Caution: we do not know if the door is open. This approach is analog to the measurements done using the oxygen blood saturation (R2* or BOLD-MRI). It provides information on the oxygen delivery through the blood. Another approach is to measure the flow of the circulating water in the heater. Caution: we do not know if the door is open and if the circulating water is hot. It is comparable with DCE-MRI. The method only considers the delivery, no information is provided regarding the oxygenation. Finally, we may look for the presence of naked (or almost) people in the room. While we do not know the temperature, their presence likely means a hot temperature inside the sauna. This situation is analog to the accumulation of nitroimidazoles inside hypoxic cells. We do not know the real oxygenation of the tissue, but it is likely hypoxic.

Similar articles

Cited by

References

    1. Abraham J., Salama N. N., Azab A. K. (2015). The Role of P-Glycoprotein in Drug Resistance in Multiple Myeloma. Leuk. Lymphoma 56, 26–33. 10.3109/10428194.2014.907890 - DOI - PubMed
    1. Adams A., van Brussel A. S., Vermeulen J. F., Mali W. P., van der Wall E., van Diest P. J., et al. (2013). The Potential of Hypoxia Markers as Target for Breast Molecular Imaging-Aa Systematic Review and Meta-Analysis of Human Marker Expression. BMC Cancer 13, 538. 10.1186/1471-2407-13-538 - DOI - PMC - PubMed
    1. Adams G. E., Dische S., Fowler J. F., Thomlinson R. H. (1976). Hypoxic Cell Sensitisers in Radiotherapy. Lancet 1, 186–188. 10.1016/s0140-6736(76)91285-x - DOI - PubMed
    1. Agani F., Jiang B. H. (2013). Oxygen-independent Regulation of HIF-1: Novel Involvement of PI3K/AKT/mTOR Pathway in Cancer. Curr. Cancer Drug Targets 13, 245–251. 10.2174/1568009611313030003 - DOI - PubMed
    1. Ahmad R., Kuppusamy P. (2010). Theory, Instrumentation, and Applications of Electron Paramagnetic Resonance Oximetry. Chem. Rev. 110, 3212–3236. 10.1021/cr900396q - DOI - PMC - PubMed