. 2022 Jul 15:13:896551.
doi: 10.3389/fphar.2022.896551. eCollection 2022.

High-Dose Rifampicin Mediated Systemic Alterations of Cytokines, Chemokines, Growth Factors, Microbial Translocation Markers, and Acute-Phase Proteins in Pulmonary Tuberculosis

Affiliations

High-Dose Rifampicin Mediated Systemic Alterations of Cytokines, Chemokines, Growth Factors, Microbial Translocation Markers, and Acute-Phase Proteins in Pulmonary Tuberculosis

Gokul Raj Kathamuthu et al. Front Pharmacol. .

Abstract

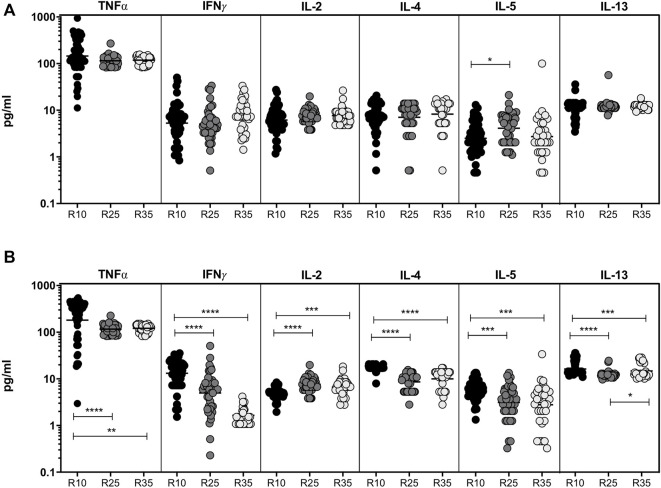
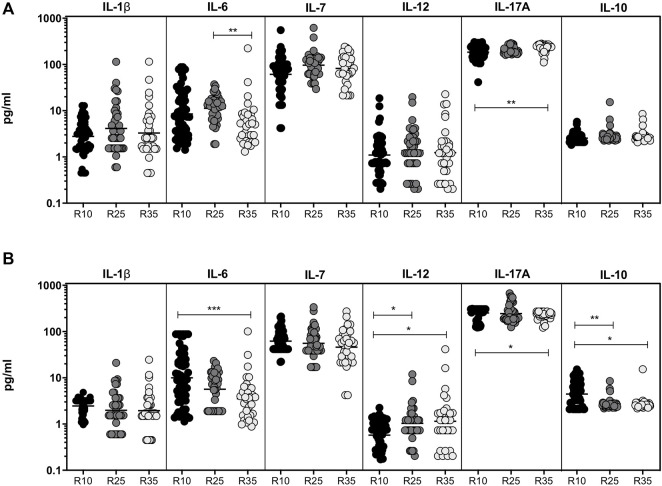
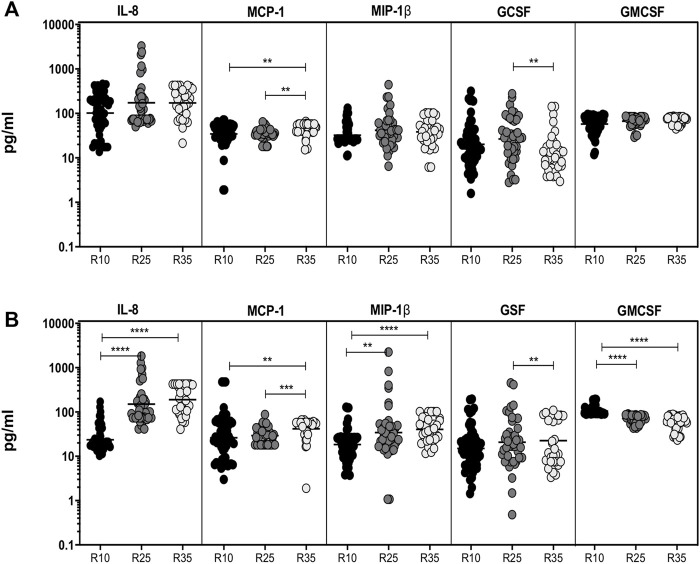
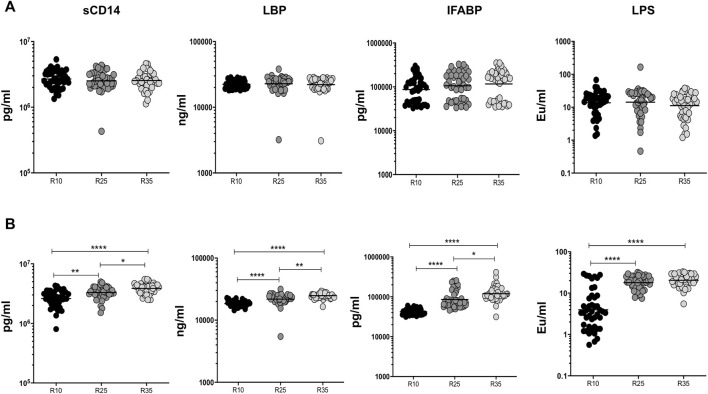
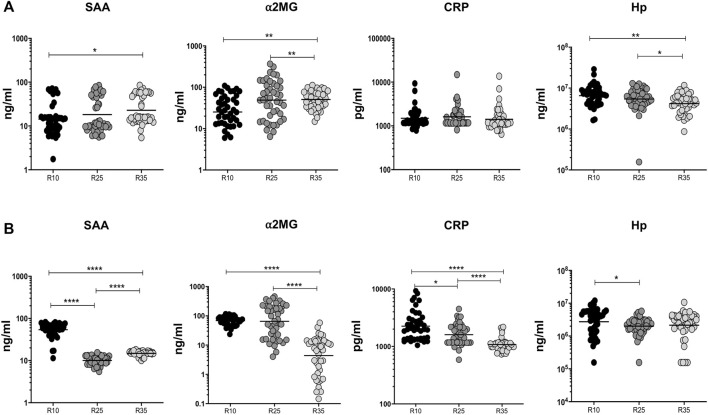
High-dose rifampicin (HDR) is now undergoing clinical trials to improve the efficacy of anti-tuberculosis treatment (ATT). However, the influence of HDR in the modulation of different cytokines, chemokines/growth factors, microbial translocation markers (MTMs), and acute-phase proteins (APPs) in pulmonary tuberculosis (PTB) is not well known. PTB individuals were separated into three different arms (R10, R25, and R35) based on their rifampicin dosage. We examined the circulating levels of Type 1, Type 2, pro-inflammatory/regulatory cytokines, chemokines/growth factors, MTMs, and APPs at baseline and after completion of the second month of ATT by ELISA. The baseline levels of cytokines, chemokines/growth factors, MTMs, and APPs did not (except IL-5, IL-6, IL-17A, MCP-1, MIP-1β, GCSF, SAA, ⍺2 MG, Hp) significantly differ between the study individuals. However, at the second month, the plasma levels of Type 1 (TNFα and IFNγ), Type 2 (IL-4, IL-5, and IL-13), pro-inflammatory/regulatory cytokines (IL-6, IL-17A, IL-10, and GMCSF), and APPs were significantly decreased in R35 regimen- compared to R25 and/or R10 regimen-treated PTB individuals. In contrast, the plasma levels of IL-2, IL-8, MCP-1, MIP-1β, GSF, and MTMs were significantly increased in the R35 regimen compared to R25 and/or R10 regimen-treated PTB individuals. Overall, our data reveal that HDR could potentially be beneficial for host immunity by altering different immune and inflammatory markers.

Keywords: acute-phase proteins; chemokines; cytokines; growth factors; high-dose rifampicin; microbial translocation markers; pulmonary tuberculosis.


Conflict of interest statement

The authors declare that the research was conducted in the absence of any commercial or financial relationships that could be construed as a potential conflict of interest.

Figures

FIGURE 1
FIGURE 1
High dose rifampicin is associated with decreased plasma levels of Type 1 and Type 2 cytokines at the second month in PTB individuals. (A) Baseline analysis of Type 1 (IFNγ, TNFα, and IL-2) and Type 2 (IL-4, IL-5, and IL-13) cytokines between the three different rifampicin (R10 [n = 57], R25 [n = 42], R35 [n = 33]) treated arm of PTB individuals. (B) Second month analysis of Type 1 (IFNγ, TNFα, IL-2), and Type 2 (IL-4, IL-5, and IL-13) cytokines between the three different rifampicin (R10 [n = 57], R25 [n = 42], R35 [n = 33]) treated arm of PTB individuals. We used Kruskal–Wallis test with Dunn’s multiple comparisons to measure the p values and each individual were denoted using scatter plots.
FIGURE 2
FIGURE 2
Altered pro-inflammatory and decreased regulatory cytokines are associated with High dose rifampicin treated PTB individuals at the second month (A) Baseline plasma levels of pro-inflammatory (IL-1β, IL-6, IL-7, IL-12, and IL-17A) and regulatory (IL-10) cytokines between the three different rifampicin (R10 [n = 57], R25 [n = 42], and R35 [n = 33]) treated arm of PTB individuals. (B) Second month plasma levels of pro-inflammatory (IL-1β, IL-6, IL-7, IL-12, and IL-17A) and regulatory (IL-10) cytokines between the three different rifampicin (R10 [n = 57], R25 [n = 42], and R35 [n = 33]) treated arm of PTB individuals. We used Kruskal–Wallis test with Dunn’s multiple comparisons to measure the p values and each individual were denoted using scatter plots.
FIGURE 3
FIGURE 3
High dose rifampicin is associated with altered chemokines and growth factors at second month in PTB individuals. (A) Baseline plasma levels of chemokines (IL-8, MCP-1, MIP-1β) and growth (GCSF, GMCSF) factors between the three different rifampicin (R10 [n = 57], R25 [n = 42], R35 [n = 33]) treated arm of PTB individuals. (B) Second month plasma levels of chemokines (IL-8, MCP-1, MIP-1β) and growth (GCSF, GMCSF) factors between the three different rifampicin (R10 [n = 57], R25 [n = 42], R35 [n = 33]) treated arm of PTB individuals. We used Kruskal–Wallis test with Dunn’s multiple comparisons to measure the p values and each individual were denoted using scatter plots.
FIGURE 4
FIGURE 4
High dose rifampicin is associated with elevated MTMs at second month in PTB individuals. (A) Baseline plasma levels of MTMs (sCD14, LBP, IFABP, and LPS) between the three different rifampicin (R10 [n = 44], R25 [n = 44], R35 [n = 44]) treated arm of PTB individuals. (B) Second month plasma levels of MTMs (sCD14, LBP, IFABP, and LPS) between the three different rifampicin (R10 [n = 44], R25 [n = 44], R35 [n = 44]) treated arm of PTB individuals. We used Kruskal–Wallis test with Dunn’s multiple comparisons to measure the p values and each individual were denoted using scatter plots.
FIGURE 5
FIGURE 5
High dose rifampicin is associated with reduced APPs at the second month in PTB individuals. (A) Baseline plasma levels of APPs (SAA, α2MG, CRP, and Hp) between the three different rifampicin (R10 [n = 44], R25 [n = 44], R35 [n = 44]) treated arm of PTB individuals. (B) Second month plasma levels of APPs (SAA, α2MG, CRP, and Hp) between the three different rifampicin (R10 [n = 44], R25 [n = 44], R35 [n = 44]) treated arm of PTB individuals. We used Kruskal–Wallis test with Dunn’s multiple comparisons to measure the p values and each individual were denoted using scatter plots.

Similar articles

Cited by

References

    1. Baumann H., Gauldie J. (1990). Regulation of Hepatic Acute Phase Plasma Protein Genes by Hepatocyte Stimulating Factors and Other Mediators of Inflammation. Mol. Biol. Med. 7 (2), 147–159. - PubMed
    1. Boeree M. J., Diacon A. H., Dawson R., Narunsky K., du Bois J., Venter A., et al. (2015). A Dose-Ranging Trial to Optimize the Dose of Rifampin in the Treatment of Tuberculosis. Am. J. Respir. Crit. Care Med. 191 (9), 1058–1065. 10.1164/rccm.201407-1264OC - DOI - PubMed
    1. Boeree M. J., Heinrich N., Aarnoutse R., Diacon A. H., Dawson R., Rehal S., et al. (2017). High-dose Rifampicin, Moxifloxacin, and SQ109 for Treating Tuberculosis: a Multi-Arm, Multi-Stage Randomised Controlled Trial. Lancet Infect. Dis. 17 (1), 39–49. 10.1016/S1473-3099(16)30274-2 - DOI - PMC - PubMed
    1. Brenchley J. M., Price D. A., Schacker T. W., Asher T. E., Silvestri G., Rao S., et al. (2006). Microbial Translocation Is a Cause of Systemic Immune Activation in Chronic HIV Infection. Nat. Med. 12 (12), 1365–1371. 10.1038/nm1511 - DOI - PubMed
    1. Casanova J. L., Abel L. (2002). Genetic Dissection of Immunity to Mycobacteria: the Human Model. Annu. Rev. Immunol. 20, 581–620. 10.1146/annurev.immunol.20.081501.125851 - DOI - PubMed