

Cyclin-Dependent Kinase 1 Inhibition Potentiates the Proliferation of Tonsil-Derived Mesenchymal Stem Cells by Delaying Cellular Senescence
- PMID: 35910534
- PMCID: PMC9337930
- DOI: 10.1155/2022/4302992
Cyclin-Dependent Kinase 1 Inhibition Potentiates the Proliferation of Tonsil-Derived Mesenchymal Stem Cells by Delaying Cellular Senescence
Abstract
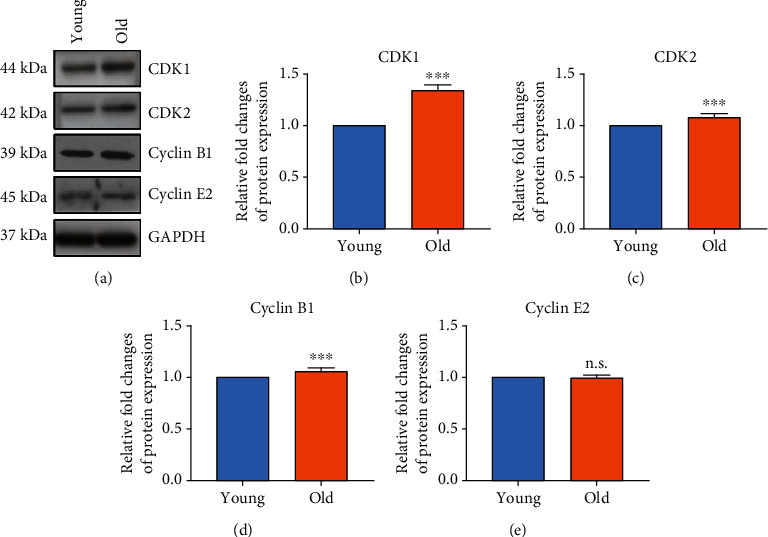
Mesenchymal stem cells (MSCs) have been widely used in tissue regeneration and stem cell therapy and are currently being tested in numerous clinical trials. Senescence-related changes in MSC properties have attracted considerable attention. Senescent MSCs exhibit a compromised potential for proliferation; senescence acts as a stress response that prevents the proliferation of dysfunctional cells by inducing an irreversible cell cycle arrest. Here, we established a senescent MSC model using senescence-associated β-galactosidase, proliferation, and cell cycle assays. We further identified novel biomarker candidates for old, senescent tonsil-derived MSCs (TMSCs) using transcriptomics. A plot of the cellular senescence pathway showed cyclin-dependent kinase 1 (CDK1; +8-fold) and CDK2 (+2-fold), and transforming growth factor beta 2 (TGFB2; +2-fold) showed significantly higher expression in old TMSCs than in young TMSCs. The CDK family was shown to be related to cell cycle and proliferation, as confirmed by quantitative RT-PCR. As replicative senescence of TMSCs, the gene and protein expression of CDK1 was significantly increased, which was further validated by inhibiting CDK1 using an inhibitor and siRNA. Taken together, we suggest that the CDK1 can be used as a selective senescence biomarker of MSCs and broaden the research criteria for senescent mechanisms.
Copyright © 2022 Da Hyeon Choi et al.
Conflict of interest statement
The authors declare no conflict of interest.
Figures


Similar articles
-
A transcriptomic analysis of serial-cultured, tonsil-derived mesenchymal stem cells reveals decreased integrin α3 protein as a potential biomarker of senescent cells.Stem Cell Res Ther. 2020 Aug 17;11(1):359. doi: 10.1186/s13287-020-01860-y. Stem Cell Res Ther. 2020. PMID: 32807231 Free PMC article.
-
Tonsil-derived mesenchymal stem cells incorporated in reactive oxygen species-releasing hydrogel promote bone formation by increasing the translocation of cell surface GRP78.Biomaterials. 2021 Nov;278:121156. doi: 10.1016/j.biomaterials.2021.121156. Epub 2021 Sep 25. Biomaterials. 2021. PMID: 34597900
-
Tensin-3 Regulates Integrin-Mediated Proliferation and Differentiation of Tonsil-Derived Mesenchymal Stem Cells.Cells. 2019 Dec 30;9(1):89. doi: 10.3390/cells9010089. Cells. 2019. PMID: 31905841 Free PMC article.
-
Quantifying Senescence-Associated Phenotypes in Primary Multipotent Mesenchymal Stromal Cell Cultures.Methods Mol Biol. 2019;2045:93-105. doi: 10.1007/7651_2019_217. Methods Mol Biol. 2019. PMID: 31020633
-
Exploring Microenvironment Strategies to Delay Mesenchymal Stem Cell Senescence.Stem Cells Dev. 2022 Feb;31(3-4):38-52. doi: 10.1089/scd.2021.0254. Epub 2022 Jan 21. Stem Cells Dev. 2022. PMID: 34913751 Review.
Cited by
-
Transcriptomic Changes in Human Tonsil-Derived Mesenchymal Stem Cells Across Culture Passages.Genes (Basel). 2024 Dec 19;15(12):1626. doi: 10.3390/genes15121626. Genes (Basel). 2024. PMID: 39766894 Free PMC article.
References
-
- Ibrahim H. F., Safwat S. H., Zeitoun T. M., El Mulla K. F., Medwar A. Y. The therapeutic potential of amniotic fluid-derived stem cells on busulfan-induced azoospermia in adult rats. Tissue Engineering and Regenerative Medicine . 2021;18(2):279–295. doi: 10.1007/s13770-020-00309-w. - DOI - PMC - PubMed
-
- Lam C., Alsaeedi H. A., Koh A. E., et al. Human dental pulp stem cells (DPSCs) therapy in rescuing photoreceptors and establishing a sodium iodate-induced retinal degeneration rat model. Tissue Engineering and Regenerative Medicine . 2021;18(1):143–154. doi: 10.1007/s13770-020-00312-1. - DOI - PMC - PubMed
LinkOut - more resources
Full Text Sources
Molecular Biology Databases
Research Materials
Miscellaneous
