. 2022 Jul 13:13:916197.
doi: 10.3389/fphys.2022.916197. eCollection 2022.

Plasma Levels of Acyl-Carnitines and Carboxylic Acids Correlate With Cardiovascular and Kidney Function in Subjects With Sickle Cell Trait

Affiliations

Plasma Levels of Acyl-Carnitines and Carboxylic Acids Correlate With Cardiovascular and Kidney Function in Subjects With Sickle Cell Trait

Travis Nemkov et al. Front Physiol. .

Abstract

Subjects with sickle cell trait (SCT) carry one copy of mutated β-globin gene at position E6V at the origin of the production of sickle hemoglobin (HbS). Indeed, individuals with SCT have both normal hemoglobin and HbS, in contrast to patients with sickle cell disease who inherited of two copies of the mutated gene. Although SCT is generally benign/asymptomatic, carriers may develop certain adverse outcomes such as renal complications, venous thromboembolism, exercise-induced rhabdomyolysis … However, little is known about whether similar metabolic pathways are affected in individuals with SCT and whether these metabolic derangements, if present, correlate to clinically relevant parameters. In this study, we performed metabolomics analysis of plasma from individuals with sickle cell trait (n = 34) compared to healthy controls (n = 30). Results indicated a significant increase in basal circulating levels of hemolysis markers, mono- (pyruvate, lactate), di- and tri-carboxylates (including all Krebs cycle intermediates), suggestive of systems-wide mitochondrial dysfunction in individuals with SCT. Elevated levels of kynurenines and indoles were observed in SCT samples, along with increases in the levels of oxidative stress markers (advanced glycation and protein-oxidation end-products, malondialdehyde, oxylipins, eicosanoids). Increases in circulating levels of acyl-carnitines and fatty acids were observed, consistent with increased membrane lipid damage in individuals with sickle cell trait. Finally, correlation analyses to clinical co-variates showed that alterations in the aforementioned pathways strongly correlated with clinical measurements of blood viscosity, renal (glomerular filtration rate, microalbuminuria, uremia) and cardiovascular function (carotid-femoral pulse wave velocity, blood pressure).

Keywords: hemoglobin S; lands cycle; metabolome; mitochondria; sickle cell trait.


Conflict of interest statement

AD and TN are founders of Omix Tehcnologies Inc and Altis Biosciences. AD is also a scientific advisory board member for Hemanext Inc and Forma Therapeutics. The remaining authors declare that the research was conducted in the absence of any commercial or financial relationships that could be construed as a potential conflict of interest.

Figures

FIGURE 1
FIGURE 1
Study design, hematological and clinical parameters. A total of 64 subjects (n = 30 in the control group—blue and n = 34 in the sickle cell trait—SCT group—red) were enrolled in this study (A). Hierarchical clustering of clinical and hemorheological parameters is shown in panel (B). Violin plots (C) show significantly different hematological parameters between the two groups, including % Hemoglobin S (HbS), hematocrit (%), mean cell hemoglobin concentration (MCHC), mean cell volume (MCV); markers of kidey filtration (microalbuminuria) and chronic kidney disease or EPI DFG estimates. Markers of oxidant stress (advances oxidation protein products), total cholesterol levels were also significantly different between the two groups. However, no significant differences were noted with respect to the levels of multiple interleukins (IL-6, IL-8, IL-10 and TNFα—Supplementary Figure S1). Asterisks indicate significance (* p < 0.05; ** p < 0.01; *** p < 0.001; **** p < 0.0001 Wilcoxon/Mann-Whitney U-test). FDR-corrected p-values are provided for all analytes in Supplementary Table S1 and indicated with # using the same significance ranges as per the asterisks in p-values above.
FIGURE 2
FIGURE 2
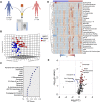
Metabolomics analyses were performed on plasma from healthy controls and subjects with sickle cell trait (A). Statistical analyses showed distinct metabolic profiles between the two groups, as gleaned by multivariate principal component analysis (B), variable importance in projection (C), hierarchical clustering analysis (D), and volcano plots (E).
FIGURE 3
FIGURE 3
Correlation matrix (A), correlation network (B) and metabolic correlates to HbS levels (C), advanced oxidation protein products (D) and carotid femoral PWV (E)—Spearman correlation.
FIGURE 4
FIGURE 4
Overview of glycolysis, heme metabolism and redox metabolism in plasma from control (blue) and sickle cell trait (red) subjects. Asterisks indicate significance (* p < 0.05; ** p < 0.01; *** p < 0.001 Wilcoxon/Mann-Whitney U-test). FDR-corrected p-values are provided for all analytes in Supplementary Table S1 and indicated with # using the same significance ranges as per the asterisks in p-values above.
FIGURE 5
FIGURE 5
Overview of purine metabolism in plasma from control (blue) and sickle cell trait (red) subjects. Asterisks indicate significance (* p < 0.05; ** p < 0.01; *** p < 0.001; **** p < 0.0001 Wilcoxon/Mann-Whitney U-test). FDR-corrected p-values are provided for all analytes in Supplementary Table S1 and indicated with # using the same significance ranges as per the asterisks in p-values above.
FIGURE 6
FIGURE 6
Overview of carboxylic acid metabolism and glutaminolysis (A) and violin plot representation of metabolites in these pathways (B) as measured in plasma from control (blue) and sickle cell trait (red) subjects. Asterisks indicate significance (* p < 0.05; ** p < 0.01; *** p < 0.001 Wilcoxon/Mann-Whitney U-test). FDR-corrected p-values are provided for all analytes in Supplementary Table S1 and indicated with # using the same significance ranges as per the asterisks in p-values above.
FIGURE 7
FIGURE 7
Overview of tryptophan metabolism (A) and sphingolipid metabolism (B) in plasma from control (blue) and sickle cell trait (red) subjects. Asterisks indicate significance (* p < 0.05; ** p < 0.01; *** p < 0.001 Wilcoxon/Mann-Whitney U-test). FDR-corrected p-values are provided for all analytes in Supplementary Table S1 and indicated with # using the same significance ranges as per the asterisks in p-values above.
FIGURE 8
FIGURE 8
Overview of the Lands cycle (A) with a focus on acyl carnitines—(B) and free fatty acids—(C), CoA and oxylipin metabolism (D) in plasma from control (blue) and sickle cell trait (red) subjects. Asterisks indicate significance (* p < 0.05; ** p < 0.01; *** p < 0.001 Wilcoxon/Mann-Whitney U-test). FDR-corrected p-values are provided for all analytes in Supplementary Table S1 and indicated with # using the same significance ranges as per the asterisks in p-values above.

References

    1. Adebiyi M. G., Manalo J. M., Xia Y. (2019). Metabolomic and Molecular Insights into Sickle Cell Disease and Innovative Therapies. Blood Adv. 3 (8), 1347–1355. 10.1182/bloodadvances.2018030619 - DOI - PMC - PubMed
    1. Austin H., Key N. S., Benson J. M., Lally C., Dowling N. F., Whitsett C., et al. (2007). Sickle Cell Trait and the Risk of Venous Thromboembolism Among Blacks. Blood 110 (3), 908–912. 10.1182/blood-2006-11-057604 - DOI - PubMed
    1. Bakshi N., Morris C. R. (2016). The Role of the Arginine Metabolome in Pain: Implications for Sickle Cell Disease. J. Pain Res. 9, 167–175. 10.2147/JPR.S55571 - DOI - PMC - PubMed
    1. Bissinger R., Nemkov T., D'Alessandro A., Grau M., Dietz T., Bohnert B. N., et al. (2021). Proteinuric Chronic Kidney Disease Is Associated with Altered Red Blood Cell Lifespan, Deformability and Metabolism. Kidney Int. 100 (6), 1227–1239. 10.1016/j.kint.2021.08.024 - DOI - PubMed
    1. Brim H., Taylor J., Abbas M., Vilmenay K., Daremipouran M., Varma S., et al. (2021). The Gut Microbiome in Sickle Cell Disease: Characterization and Potential Implications. PLOS ONE 16 (8), e0255956. 10.1371/journal.pone.0255956 - DOI - PMC - PubMed

LinkOut - more resources