. 2022 Jul 14:13:922760.
doi: 10.3389/fmicb.2022.922760. eCollection 2022.

Metabolites From Trypanosome-Infected Cattle as Sensitive Biomarkers for Animal Trypanosomosis

Affiliations

Metabolites From Trypanosome-Infected Cattle as Sensitive Biomarkers for Animal Trypanosomosis

Merid N Getahun et al. Front Microbiol. .

Abstract

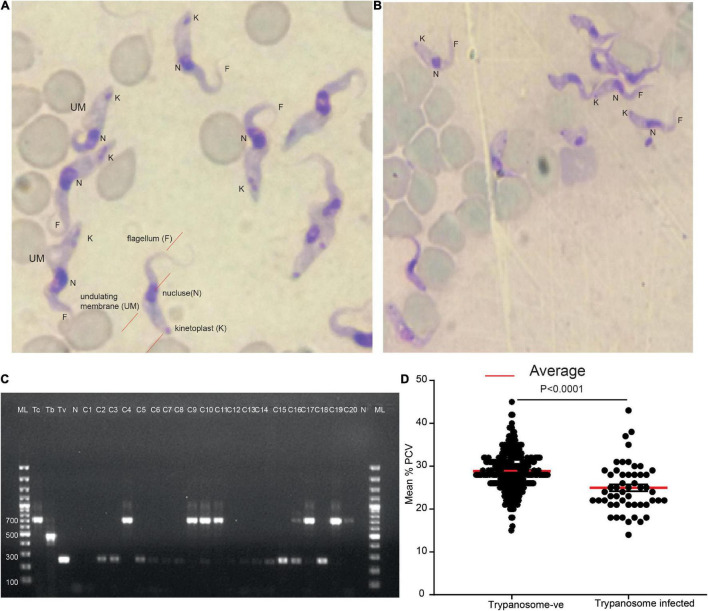
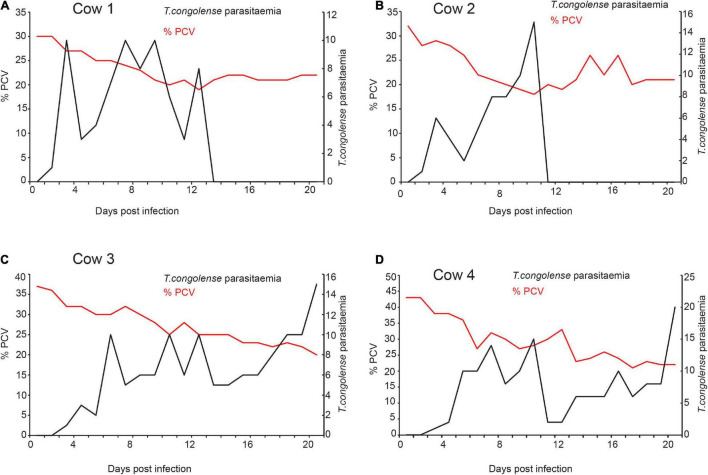
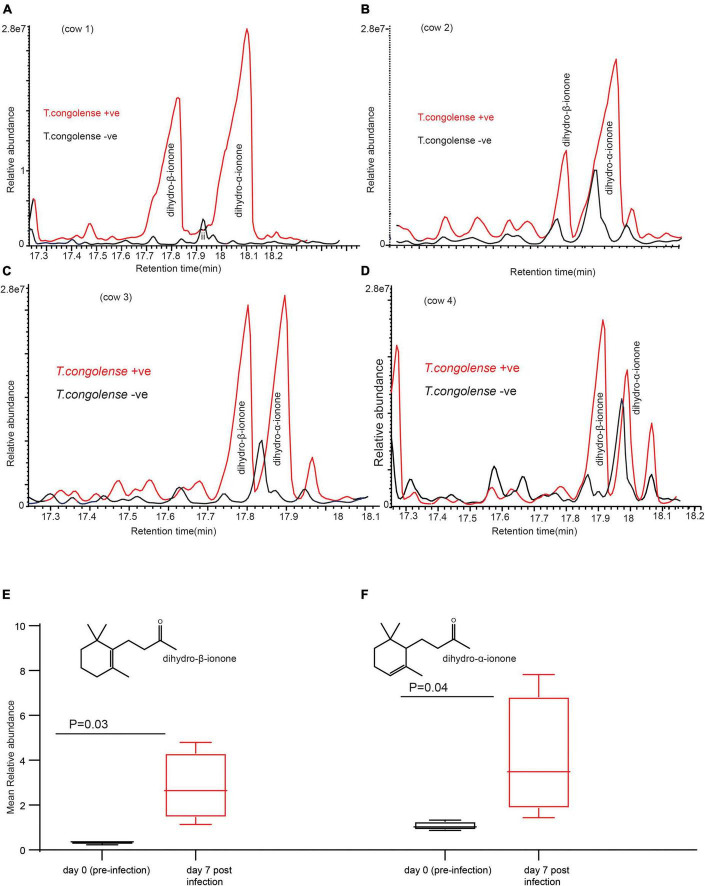
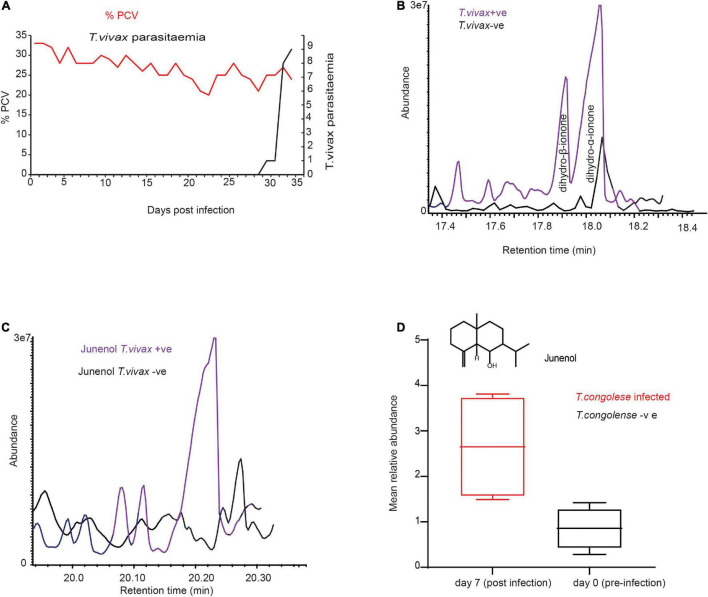
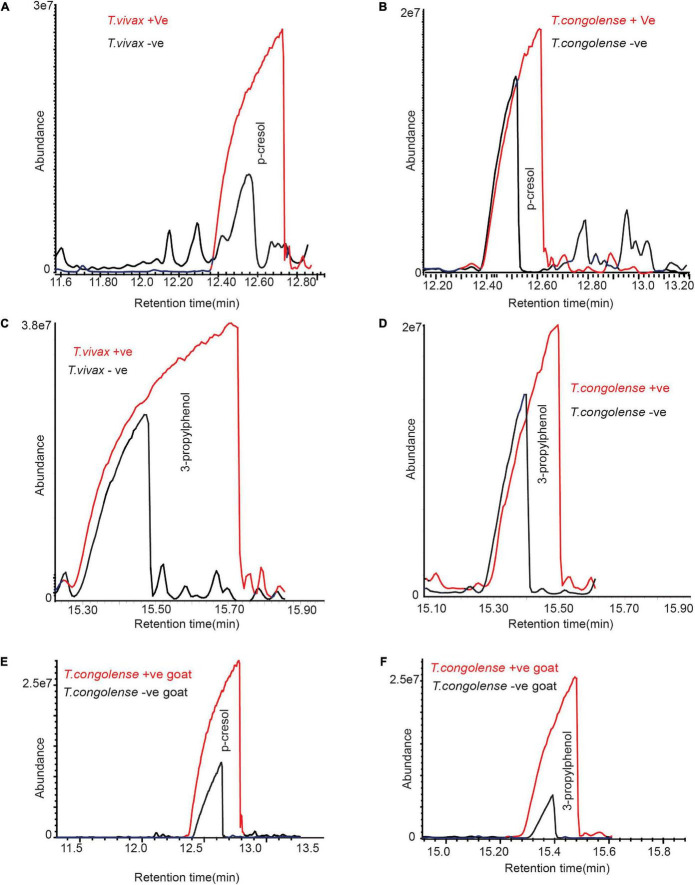
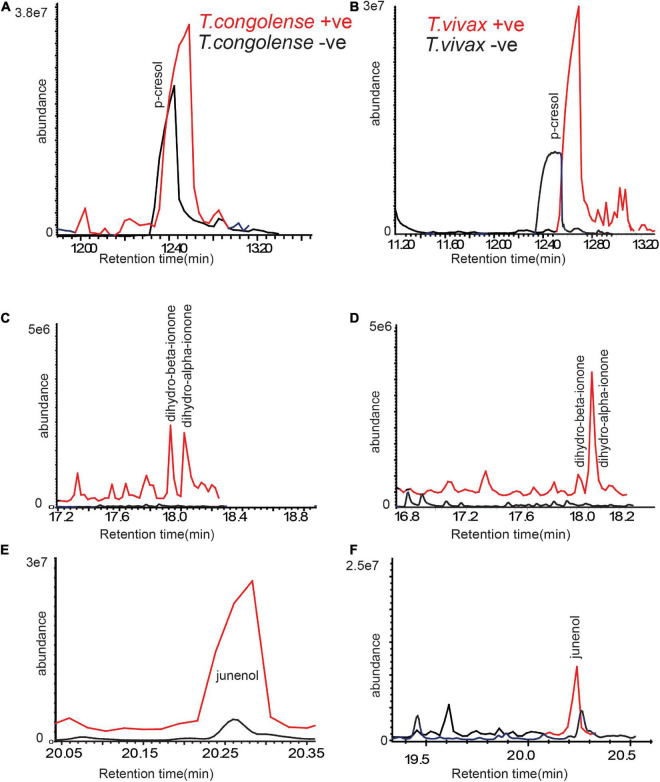
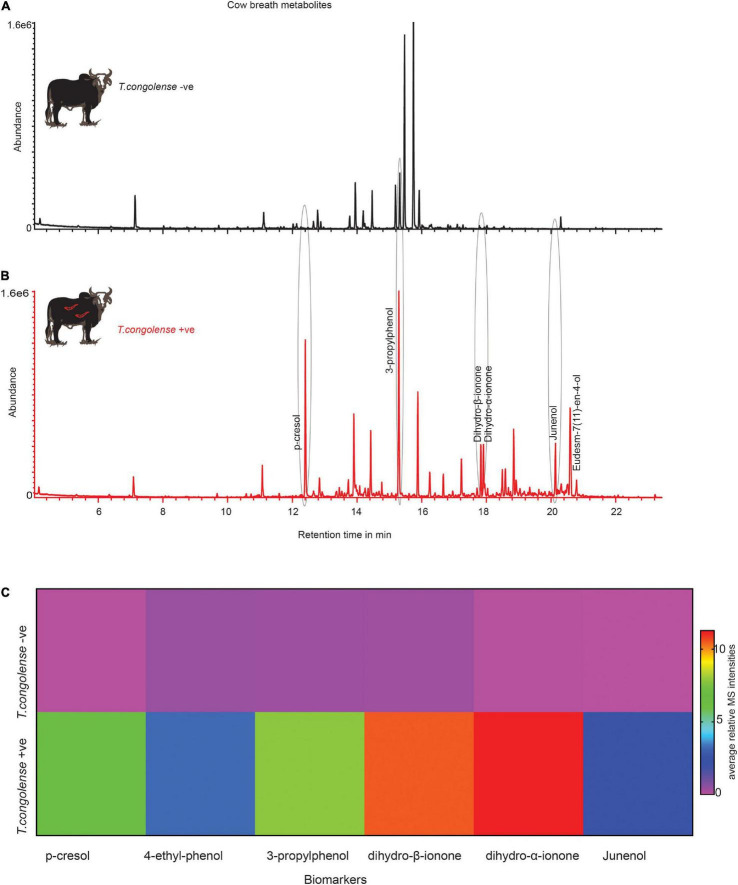
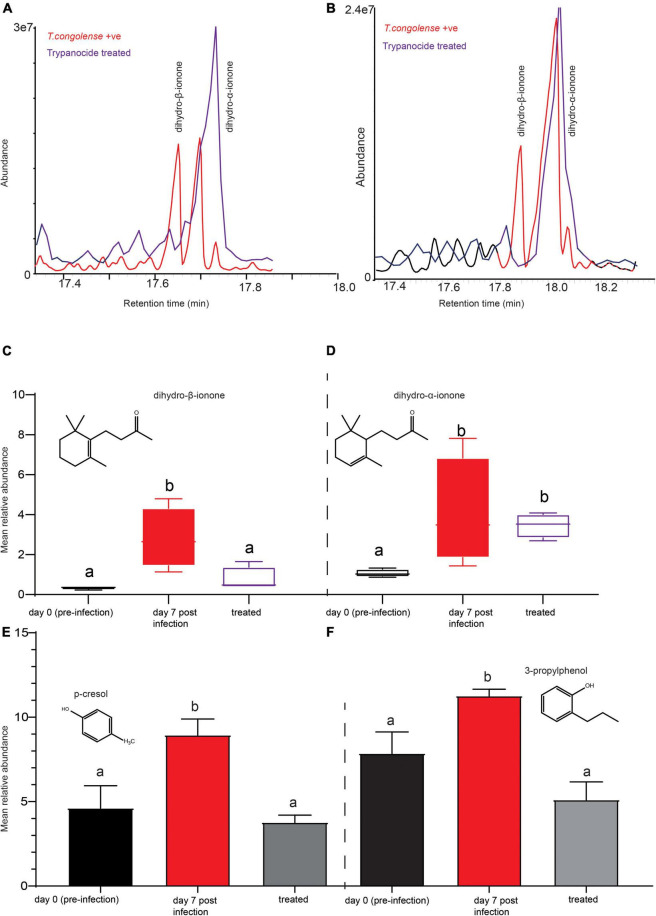
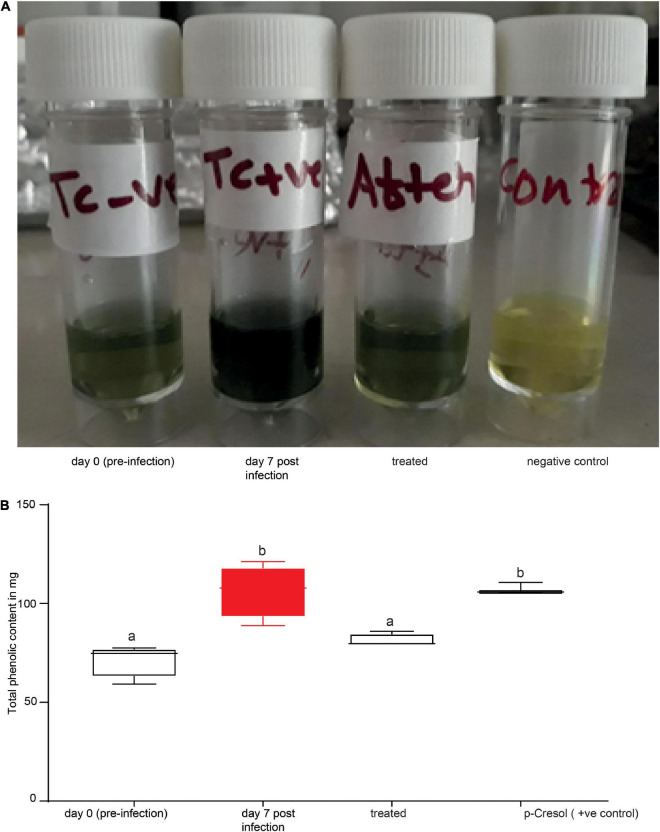
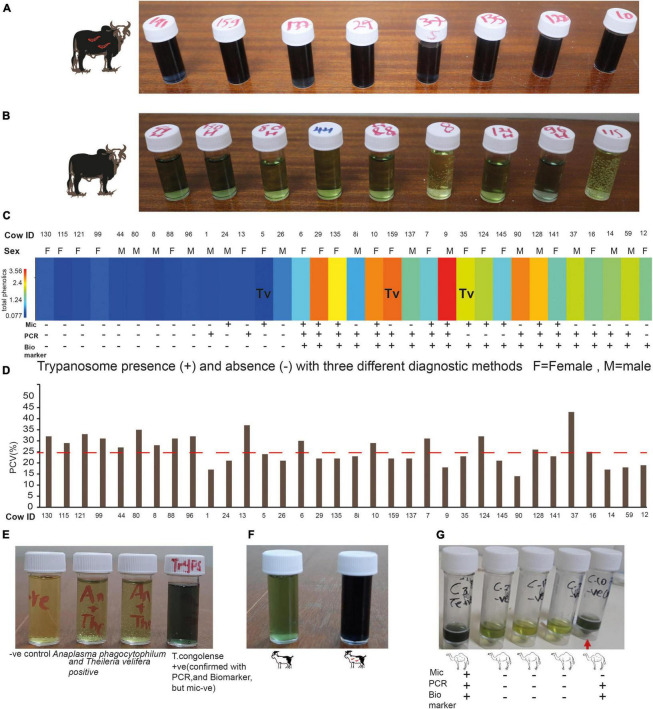
Trypanosomes are important global livestock and human pathogens of public health importance. Elucidating the chemical mechanisms of trypanosome-relevant host interactions can enhance the design and development of a novel, next-generation trypanosomosis diagnostics. However, it is unknown how trypanosome infection affects livestock volatile odors. Here, we show that Trypanosoma congolense and Trypanosoma vivax infections induced dihydro-β- ionone and junenol, while abundance of dihydro-α-ionone, phenolics, p-cresol, and 3-propylphenol significantly elevated in cow urine. These biomarkers of trypanosome infection are conserved in cow breath and the urine metabolites of naturally infected cows, regardless of population, diet, or environment differences. Furthermore, treating trypanosome-infected cows reduced the levels of these indicators back to the pre-infection levels. Finally, we demonstrated that the potential of some specific biomarkers of phenolic origin may be used to detect active trypanosome infections, including low-level infections that are not detectable by microscopy. The sensitivity and specificity of biomarkers detection are suited for rapid, robust, and non-invasive trypanosomosis diagnosis under field conditions.

Keywords: animal trypanosomosis; biomarkers; diagnostic; metabolites; volatile.


Conflict of interest statement

The authors declare that the research was conducted in the absence of any commercial or financial relationships that could be construed as a potential conflict of interest.

Figures

FIGURE 1
FIGURE 1
Two major trypanosome species were detected from naturally infected cows. (A) Representative light micrographs of Giemsa-stained cow blood sample smears infected with T. vivax (look the wavy shape and long flagellum). (B) Representative light micrograph of Giemsa-stained cow blood sample smears infected with T. congolense showing the less wavy shape and shorter in length flagellum. (C) Molecular confirmation of the two trypanosomes. ML 100 bp marker, Tc +ve control for T. congolense, Tb, T. brucei, and Tv, T. vivax, and N, negative control, C1–C20 cows blood sample. (D) The mean PCV of cow microscopically trypanosome negative and positive from field samples, n = 371.
FIGURE 2
FIGURE 2
Trypanosome infection caused anemia in infected cows (A–D). The relation between T. congolense parasitemia and change in PCV. Right Y-axis black dotted graph is the change in parasitemia (number of trypanosomes/ml blood) from pre-infection (day 0) to 20 days post-infection. (>10 trypanosomes per field is equivalent to ∼ > 5 × 10⁵ trypanosomes/ml blood; and 1–10 trypanosome per field is equivalent to ∼104 5 × 10⁵ trypanosomes/ml blood). Left Y-axis the red-dotted line is the measure of Packed Cell Volume (PCV) recorded as a percentage of total blood volume, it measures the level of anemia from pre-infection (day 0) to 20 days post-infection. PCV < 25 considered anemic.
FIGURE 3
FIGURE 3
Trypanosoma congolense infection induced dihydro-β-ionone in urine metabolites. (A–D) GC-MS profiles showing dihydro-β-ionone and dihydro-α-ionone levels in T. congolense-uninfected and infected cows, and (E) graph showing the significant change in abundance of dihydro-β-ionone due to T. congolense infection (F). Graph showing the significant change in a relative abundance of dihydro-α-ionone due to T. congolense infection. Y-axis in (A–D) is the area of the peak, which reflects the amount of a given compound. The size and area of the component peak are proportional to the amount of the component reaching the detector. X-axis in (A–D) is retention time in minute, which is a measure of the time taken for a compound to pass through a chromatography column. It is calculated as the time from injection to detection.
FIGURE 4
FIGURE 4
Trypanosoma vivax infection induced similar metabolites. (A) Parasitemia and PCV change over time in T. vivax-infected cow. Left Y-axis the red dot is the measure of PCV it signifies the level of anemia from pre-infection (day 0) to 33 days post-infection, PCV < 25 considered anemic. Right Y-axis, black-dotted graph is the change in parasitemia (number of parasites/ml blood).>10 trypanosomes per field is equivalent to ∼ > 5 × 10⁵ trypanosomes/ml blood; and 1–10 trypanosome per field is equivalent to ∼104 – 5 × 10⁵ trypanosomes/ml blood. (B) GC-MS profile showing dihydro-β-ionone induction and dihydro-α-ionone enhancement due to T. vivax infection, (C) GC-MS profile showing the induction of junenol due to T. vivax infection. (D) The mean signal intensity of junenol in healthy and T. congolense-infected cow urine, n = 4, paired t-test 3.96, P = 0.02.
FIGURE 5
FIGURE 5
Trypanosome infection increased phenolic compounds concentration in cow urine. (A–D) Representative GC-MS profile showing the significant increase of phenolic compounds due to T. congolense and T. vivax infection. (E,F) Representative GC-MS profile showing the significant increase of phenolic compounds due to T. congolense in goat urine. Panel (A) is for T. congolense and (B) is for T. vivax infection. Due to the variation of metabolites modification between individual livestock, the graphs are not presented at the same scale.
FIGURE 6
FIGURE 6
Trypanosome-induced and modified metabolites are conserved in naturally infected cattle urine. (A,C,E) Representative GC-MS profiles of trypanosomosis biomarkers in urine of naturally T. congolense, (red line) infected cow as compared to healthy cow (black line) and (B,D,F) for T. vivax. Given the variation of metabolites modification between individual livestock, the graphs are not presented at the same scale.
FIGURE 7
FIGURE 7
Trypanosoma congolense infection induced similar metabolites in cow breath. (A) Representative GC-MS trace showing the breath odor components of healthy cow. (B) T. congolense-infected cow breath. (C) The heat map based on the mean relative MS intensities of breath metabolites induced due to T. congolense infection, n = 4.
FIGURE 8
FIGURE 8
Trypanocides treatment restored the metabolites back to normal. (A,B) Representaive GC-MS profiles showing key biomarker levels in trypanosome-infected (red) and after trypanocide treatment (purple). (C) The mean relative abundance of dihydro-β-ionone (D) dihydro-α-ionone at pre-infection, day 7 post-infection and after treatment. (E) The mean relative intensity of p-cresol and (F) 3-propylphenol at pre-infection, day 7 post-infection and after treatment. In (C–F), bars followed by different letters are statistically significant. Error bars represent standard error of the mean.
FIGURE 9
FIGURE 9
Phenolic biomarkers can be used to diagnose animal trypanosomosis. (A) Shows the urine of the same cow before (day 0 pre-infection), during infection (day 7 post-infection) and after treatment. (B) Spectrophotometer data quantifying the total phenolic content in the urine of healthy, infected, treated cow (verbine) and 500 ng/μl p-cresol (positive control) as standard. Bars followed by different letters are statistically different, ANOVA followed by Tukeys Post hoc test, n = 4. Error bars represent standard error of the mean. Folin–Ciocalteu reagent upon reacting with phenolics, it produces a blue color which absorbs at 760 nm and the intensity increases linearly with the concentration of phenolics in the sample.
FIGURE 10
FIGURE 10
Field validation of the biomarker-based diagnostic. (A) Representative cow urine samples from trypanosome positive cows after treatment with diagnostic reagent (see the dark blue color). (B) Representative cow urine samples from trypanosome negative cow samples (observe the green color). (C) Heat map of the total phenolic contents (unnormalized) from independent field samples both infected and uninfected cows, n = 34. (mic, microscopy; PCR, biomarker). Tv, T. vivax and the rest infected with T. congolense. (D) PCV of the 34 cows presented in (C), the dashed line shows the threshold PCV value to be considered anemic (PCV < 25). (E) Specificity test. (F) Trypanosomosis diagnosis in goat. (G) Camel trypanosomosis (surra) diagnosis.

Similar articles

Cited by

References

    1. Adams E. R., Malele I. I., Msangi A. R., Gibson W. C. (2006). Trypanosome identification in wild tsetse populations in Tanzania using generic primers to amplify the ribosomal RNA ITS-1 region. Acta Trop. 100 103–109. - PubMed
    1. Aksoy S., Buscher P., Lehane M., Solano P., Van Den Abbeele J. (2017). Human African trypanosomiasis control: achievements and challenges. PLoS Negl. Trop. Dis. 11:e0005454. 10.1371/journal.pntd.0005454 - DOI - PMC - PubMed
    1. Alsan M. (2015). The effect of the tsetse fly on African development. Am. Econ. Rev. 105 382–410. 10.1257/aer.20130604 - DOI
    1. Amann A., de Lacy Costello B., Miekisch W., Schubert J., Buszewski B., Pleil J., et al. (2014). The human volatilome: volatile organic compounds (VOCs) in exhaled breath, skin emanations, urine, feces and saliva. J. Breath Res. 8:034001. 10.1088/1752-7155/8/3/034001 - DOI - PubMed
    1. Auty H., Anderson N. E., Picozzi K., Lembo T., Mubanga J., Hoare R., et al. (2012). Trypanosome diversity in wildlife species from the serengeti and luangwa valley ecosystems. PLoS Negl. Trop. Dis. 6:e1828. 10.1371/journal.pntd.0001828 - DOI - PMC - PubMed

LinkOut - more resources