. 2022 Jul 14:13:866705.
doi: 10.3389/fmicb.2022.866705. eCollection 2022.

Genetic Diversity and Low Therapeutic Impact of Variant-Specific Markers in HIV-1 Pol Proteins

Affiliations

Genetic Diversity and Low Therapeutic Impact of Variant-Specific Markers in HIV-1 Pol Proteins

Paloma Troyano-Hernáez et al. Front Microbiol. .

Abstract

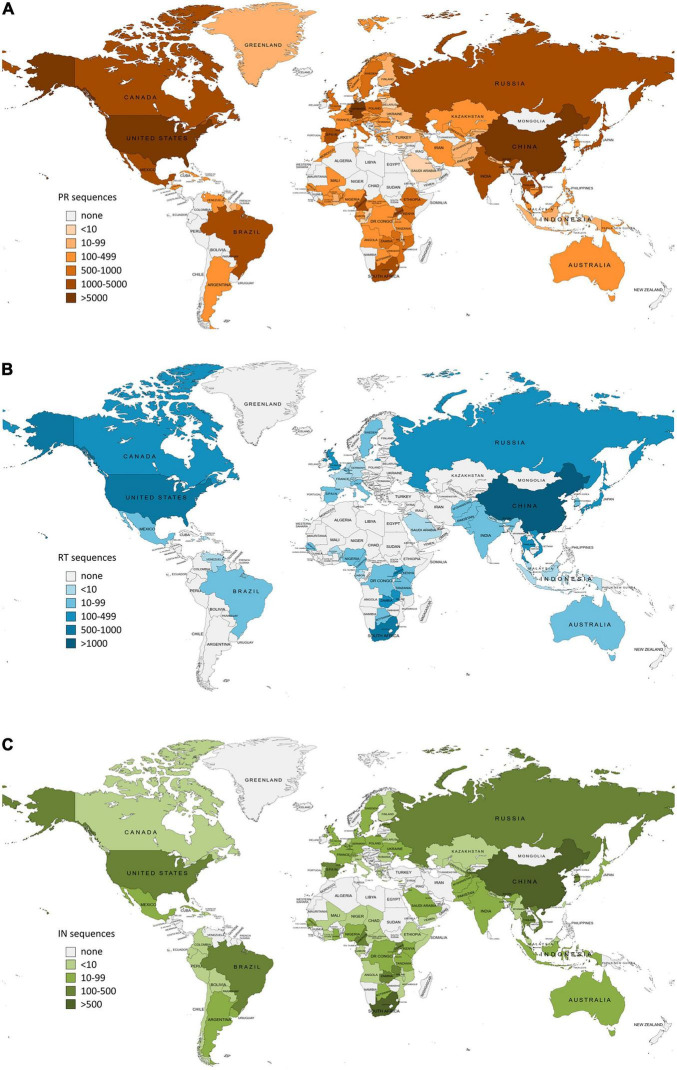
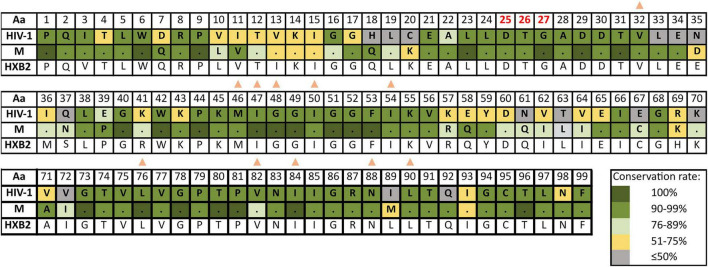
The emergence and spread of new HIV-1 variants pose a challenge for the effectiveness of antiretrovirals (ARV) targeting Pol proteins. During viral evolution, non-synonymous mutations have fixed along the viral genome, leading to amino acid (aa) changes that can be variant-specific (V-markers). Those V-markers fixed in positions associated with drug resistance mutations (DRM), or R-markers, can impact drug susceptibility and resistance pathways. All available HIV-1 Pol sequences from ARV-naïve subjects were downloaded from the United States Los Alamos HIV Sequence Database, selecting 59,733 protease (PR), 6,437 retrotranscriptase (RT), and 6,059 integrase (IN) complete sequences ascribed to the four HIV-1 groups and group M subtypes and circulating recombinant forms (CRFs). Using a bioinformatics tool developed in our laboratory (EpiMolBio), we inferred the consensus sequences for each Pol protein and HIV-1 variant to analyze the aa conservation in Pol. We analyzed the Wu-Kabat protein variability coefficient (WK) in PR, RT, and IN group M to study the susceptibility of each site to evolutionary replacements. We identified as V-markers the variant-specific aa changes present in >75% of the sequences in variants with >5 available sequences, considering R-markers those V-markers that corresponded to DRM according to the IAS-USA2019 and Stanford-Database 9.0. The mean aa conservation of HIV-1 and group M consensus was 82.60%/93.11% in PR, 88.81%/94.07% in RT, and 90.98%/96.02% in IN. The median group M WK was 10 in PR, 4 in RT, and 5 in IN. The residues involved in binding or catalytic sites showed a variability <0.5%. We identified 106 V-markers: 31 in PR, 28 in RT, and 47 in IN, present in 11, 12, and 13 variants, respectively. Among them, eight (7.5%) were R-markers, present in five variants, being minor DRM with little potential effect on ARV susceptibility. We present a thorough analysis of Pol variability among all HIV-1 variants circulating to date. The relatively high aa conservation observed in Pol proteins across HIV-1 variants highlights their critical role in the viral cycle. However, further studies are needed to understand the V-markers' impact on the Pol proteins structure, viral cycle, or treatment strategies, and periodic variability surveillance studies are also required to understand PR, RT, and IN evolution.

Keywords: HIV-1; Pol; conservation; integrase; protease; resistance; reverse transcriptase; variants.


Conflict of interest statement

The authors declare that the research was conducted in the absence of any commercial or financial relationships that could be construed as a potential conflict of interest.

Figures

FIGURE 1
FIGURE 1
Number of HIV-1 Pol sequences per country included in this study as available in Los Alamos HIV sequence database (LANL) in January 2022. PR, protease; RT, reverse transcriptase; IN, integrase. (A) Protease sequences per country. Total LANL sequences: 59.733. (B) Reverse transcriptase sequences per country. Total LANL sequences: 6.437. (C) Integrase sequences per country. Total LANL sequences: 6.059. Eleven integrase sequences had no record of the country of origin.
FIGURE 2
FIGURE 2
Geographic distribution by regions of HIV-1 Pol variants available in Los Alamos HIV sequence database (LANL) in January 2022. HIV-1 variant distribution within regions in PR (A), RT (B), and IN (C). PR, Protease; RT, reverse transcriptase; IN, integrase. Countries are colored by regions according to the United Nations geoscheme (https://unstats.un.org). Geographic regions color code inside the box in (A). Pie graphs show the percentage of the HIV-1 variants per region as available in LANL in January 2022 and the most frequent variant per region. The total number of available LANL sequences per region is in brackets beside the region name. NA, Northern Africa; SA, Southern Africa; EA, Eastern Africa; WA, Western Africa; CA, Central Africa; SAM, South America; CAC, Central America and The Caribbean; NAM, North America; OC, Oceania; NEU, Northern Europe; SEU, Southern Europe; EEU, Eastern Europe; WEU, Western Europe; CAS, Central Asia; SEAS, Southern and Southeastern Asia; EAS, Eastern Asia; WAS, Western Asia.
FIGURE 3
FIGURE 3
Amino acid conservation rate along PR in HIV-1 and group M consensus. aa, amino acid; M, group M consensus. PR, protease (99 aa). Dots in group M represent the same aa as in HIV-1 consensus for that position. HXB2 reference sequence is described below the groups for further guidance. Colors represent the conservation rate. Residues of PR active site (triad Asp25-Thr26-Gly27, conserved among aspartyl proteases) are highlighted in red font. Orange triangles indicate positions where major DRM to PI are located according to Stanford v9.0 (Release Notes - HIV Drug Resistance Database, 2020) and summarized in https://cms.hivdb.org/prod/downloads/resistance-mutation-handout/resistance-mutation-handout.pdf. Aa code: A, alanine; C, cysteine; D, aspartic acid; E, glutamic acid; F, phenylalanine; G, glycine; H, histidine; I, isoleucine; K, lysine; L, leucine; M, methionine; N, asparagine; P, proline; Q, glutamine; R, arginine; S, serine; T, threonine; V, valine; W, tryptophan; Y, tyrosine.
FIGURE 4
FIGURE 4
Amino acid conservation rate along RT in HIV-1 and group M consensus. Aa, amino acid; M, group M consensus. RT, reverse transcriptase (440 aa). Dots in group M represent the same aa as in HIV-1 consensus for that position. HXB2 reference sequence is described below the groups for further guidance. Colors represent the conservation rate. Residues of the catalytic triad (Asp110, Asp185, and Asp186) are highlighted in red font. Blue crosses and blue diamonds indicate positions where DRM to NRTI and to NNRTI, respectively, are located according to Stanford v9.0 (Release Notes - HIV Drug Resistance Database, 2020). Aa code according to Figure 3.
FIGURE 5
FIGURE 5
Amino acid conservation rate along IN in HIV-1 and group M consensus. Aa, amino acid; M, group M consensus. IN, integrase (288 aa). Dots in group M represent the same aa as in HIV-1 consensus for that position. HXB2 reference sequence is described below the groups for further guidance. Colors represent the conservation rate. Residues of the zinc-binding site (His12, His16, Cys40, and Cys43) and the D–D–E motif of the catalytic domain (Asp64, Asp116, and Glu152) are highlighted in red font. Green circles indicate positions where major INSTIs DRM are located according to Stanford v9.0 (Release Notes - HIV Drug Resistance Database, 2020). Aa code according to Figure 3.
FIGURE 6
FIGURE 6
Percentage of aa conservation of PR, RT, and IN across the HIV-1 group M variants with >5 sequences at LANL. X-axis: HIV-1 group M variants with >5 available sequences at LANL (46 in PR, 16 in RT, and 36 in IN). Y-axis: conservation rate for each variant included in this analysis. The horizontal line represents 90% conservation.
FIGURE 7
FIGURE 7
Wu–Kabat variability coefficient plot of PR, RT, and IN group M sequences. (A) Wu–Kabat variability coefficient plot of PR (99 aa). (B) Wu–Kabat variability coefficient plot of RT (440 aa). (C) Wu–Kabat variability coefficient plot of IN (288 aa). X-axis, amino acid position; Y-axis, WK variability coefficient.
FIGURE 8
FIGURE 8
Proportion of Wu–Kabat variability coefficient values in PR, RT, and IN residues. Each box represents the proportion of residues within each protein that present a Wu–Kabat coefficient value within the range indicated beneath the figure and colored accordingly. Protease (99 aa), reverse transcriptase (440 aa), integrase (288 aa). WK, WK variability coefficient.

References

    1. Abecasis A. B., Vandamme A.-M., Lemey P. (2009). Quantifying differences in the tempo of human immunodeficiency virus type 1 subtype evolution. J. Virol. 83 12917–12924. 10.1128/JVI.01022-09 - DOI - PMC - PubMed
    1. Anstett K., Cutillas V., Fusco R., Mesplède T., Wainberg M. A. (2016). Polymorphic substitution E157Q in HIV-1 integrase increases R263K-mediated dolutegravir resistance and decreases DNA binding activity. J. Antimicrob. Chemother. 71 2083–2088. 10.1093/jac/dkw109 - DOI - PMC - PubMed
    1. Baeten J. M., Chohan B., Lavreys L., Chohan V., McClelland R. S., Certain L., et al. (2007). HIV-1 subtype D infection is associated with faster disease progression than subtype A in spite of similar plasma HIV-1 loads. J. Infect. Dis. 195 1177–1180. 10.1086/512682 - DOI - PubMed
    1. Bandaranayake R. M., Prabu-Jeyabalan M., Kakizawa J., Sugiura W., Schiffer C. A. (2008). Structural analysis of human immunodeficiency virus type 1 CRF01_AE protease in complex with the substrate p1-p6. J. Virol. 82 6762–6766. 10.1128/JVI.00018-08 - DOI - PMC - PubMed
    1. Baxter J. D., Schapiro J. M., Boucher C. A. B., Kohlbrenner V. M., Hall D. B., Scherer J. R., et al. (2006). Genotypic changes in human immunodeficiency virus type 1 protease associated with reduced susceptibility and virologic response to the protease inhibitor tipranavir. J. Virol. 80 10794–10801. 10.1128/JVI.00712-06 - DOI - PMC - PubMed