

Inhibition of Cronobacter sakazakii in an infant simulator of the human intestinal microbial ecosystem using a potential synbiotic
- PMID: 35910651
- PMCID: PMC9335077
- DOI: 10.3389/fmicb.2022.947624
Inhibition of Cronobacter sakazakii in an infant simulator of the human intestinal microbial ecosystem using a potential synbiotic
Abstract
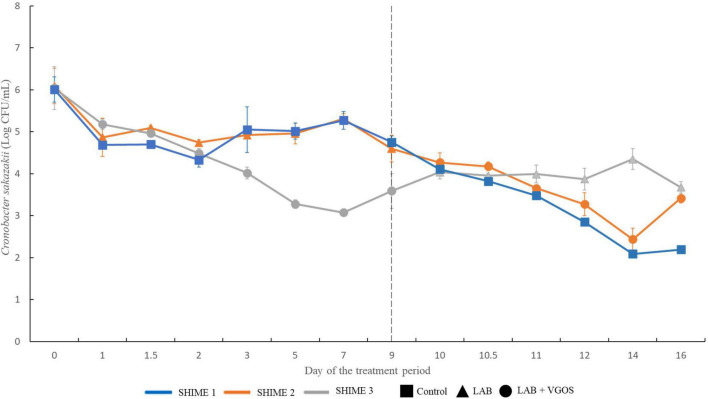
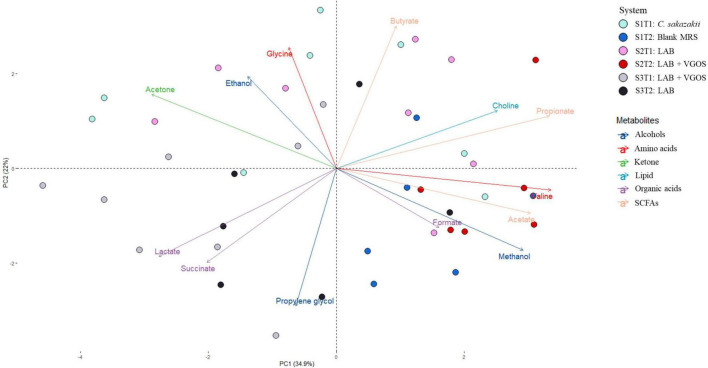
Powdered infant formula (PIF) can be contaminated with Cronobacter sakazakii, which can cause severe illnesses in infants. Synbiotics, a combination of probiotics and prebiotics, could act as an alternative control measure for C. sakazakii contamination in PIF and within the infant gut, but synbiotics have not been well studied for their ability to inhibit C. sakazakii. Using a Simulator of the Human Intestinal Microbial Ecosystem (SHIME®) inoculated with infant fecal matter, we demonstrated that a potential synbiotic, consisting of six lactic acid bacteria (LAB) strains and Vivinal GOS, can inhibit the growth of C. sakazakii in an infant possibly through either the production of antimicrobial metabolites like acetate, increasing species diversity within the SHIME compartments to compete for nutrients or a combination of mechanisms. Using a triple SHIME set-up, i.e., three identical SHIME compartments, the first SHIME (SHIME 1) was designated as the control SHIME in the absence of a treatment, whereas SHIME 2 and 3 were the treated SHIME over 2, 1-week treatment periods. The addition of the potential synbiotic (LAB + VGOS) resulted in a significant decrease in C. sakazakii levels within 1 week (p < 0.05), but in the absence of a treatment the significant decline took 2 weeks (p < 0.05), and the LAB treatment did not decrease C. sakazakii levels (p ≥ 0.05). The principal component analysis showed a distinction between metabolomic profiles for the control and LAB treatment, but similar profiles for the LAB + VGOS treatment. The addition of the potential synbiotic (LAB + VGOS) in the first treatment period slightly increased species diversity (p ≥ 0.05) compared to the control and LAB, which may have had an effect on the survival of C. sakazakii throughout the treatment period. Our results also revealed that the relative abundance of Bifidobacterium was negatively correlated with Cronobacter when no treatments were added (ρ = -0.96; p < 0.05). These findings suggest that C. sakazakii could be inhibited by the native gut microbiota, and inhibition can be accelerated by the potential synbiotic treatment.
Keywords: 16S sequencing; Cronobacter sakazakii; gut model; metabolomics; synbiotic.
Copyright © 2022 Ke, Parreira, Farber and Goodridge.
Conflict of interest statement
The authors declare that the research was conducted in the absence of any commercial or financial relationships that could be construed as a potential conflict of interest.
Figures


Similar articles
-
Selection of a Potential Synbiotic against Cronobacter sakazakii.J Food Prot. 2022 Aug 1;85(9):1240-1248. doi: 10.4315/JFP-22-048. J Food Prot. 2022. PMID: 35435968
-
Effect of Bifidobacterium crudilactis and 3'-sialyllactose on the toddler microbiota using the SHIME® model.Food Res Int. 2020 Dec;138(Pt A):109755. doi: 10.1016/j.foodres.2020.109755. Epub 2020 Oct 6. Food Res Int. 2020. PMID: 33292938
-
Survival and Expression of rpoS and grxB of Cronobacter sakazakii in Powdered Infant Formula Under Simulated Gastric Conditions of Newborns.J Food Prot. 2024 May;87(5):100269. doi: 10.1016/j.jfp.2024.100269. Epub 2024 Mar 20. J Food Prot. 2024. PMID: 38519033
-
Current and Future Perspectives on the Role of Probiotics, Prebiotics, and Synbiotics in Controlling Pathogenic Cronobacter Spp. in Infants.Front Microbiol. 2021 Oct 21;12:755083. doi: 10.3389/fmicb.2021.755083. eCollection 2021. Front Microbiol. 2021. PMID: 34745060 Free PMC article. Review.
-
Trending biocontrol strategies against Cronobacter sakazakii: A recent updated review.Food Res Int. 2020 Nov;137:109385. doi: 10.1016/j.foodres.2020.109385. Epub 2020 Jun 5. Food Res Int. 2020. PMID: 33233087 Review.
Cited by
-
Antimicrobial and Anticancer Activities of Lactiplantibacillus plantarum Probio87 Isolated from Human Breast Milk.Nutrients. 2025 Aug 5;17(15):2554. doi: 10.3390/nu17152554. Nutrients. 2025. PMID: 40806138 Free PMC article.
-
Dysbiosis of the gut microbiome in elderly patients with hepatocellular carcinoma.Sci Rep. 2023 May 13;13(1):7797. doi: 10.1038/s41598-023-34765-w. Sci Rep. 2023. PMID: 37179446 Free PMC article.
-
Impact of Metabolites from Foodborne Pathogens on Cancer.Foods. 2024 Dec 1;13(23):3886. doi: 10.3390/foods13233886. Foods. 2024. PMID: 39682958 Free PMC article. Review.
-
Protective Effects and Mechanism of a Novel Probiotic Strain Ligilactobacillus salivarius YL20 against Cronobacter sakazakii-Induced Necrotizing Enterocolitis In Vitro and In Vivo.Nutrients. 2022 Sep 16;14(18):3827. doi: 10.3390/nu14183827. Nutrients. 2022. PMID: 36145205 Free PMC article.
References
-
- Ackerberg T. S., Labuschagne L. I, Lombard M. J. (2012). The use of prebiotics and probiotics in infant formula. S. Afr. Fam. Pract. 54 321–323. 10.1080/20786204.2012.10874243 - DOI
LinkOut - more resources
Full Text Sources
Miscellaneous