

A general equilibrium assessment of COVID-19's labor productivity impacts on china's regional economies
- PMID: 35910675
- PMCID: PMC9314246
- DOI: 10.1007/s11123-022-00642-3
A general equilibrium assessment of COVID-19's labor productivity impacts on china's regional economies
Abstract
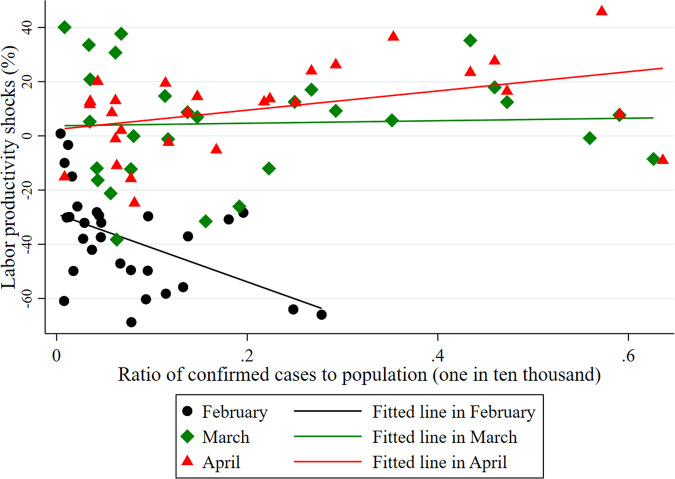
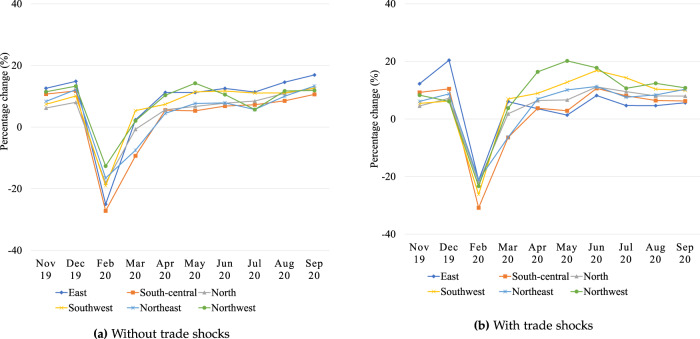
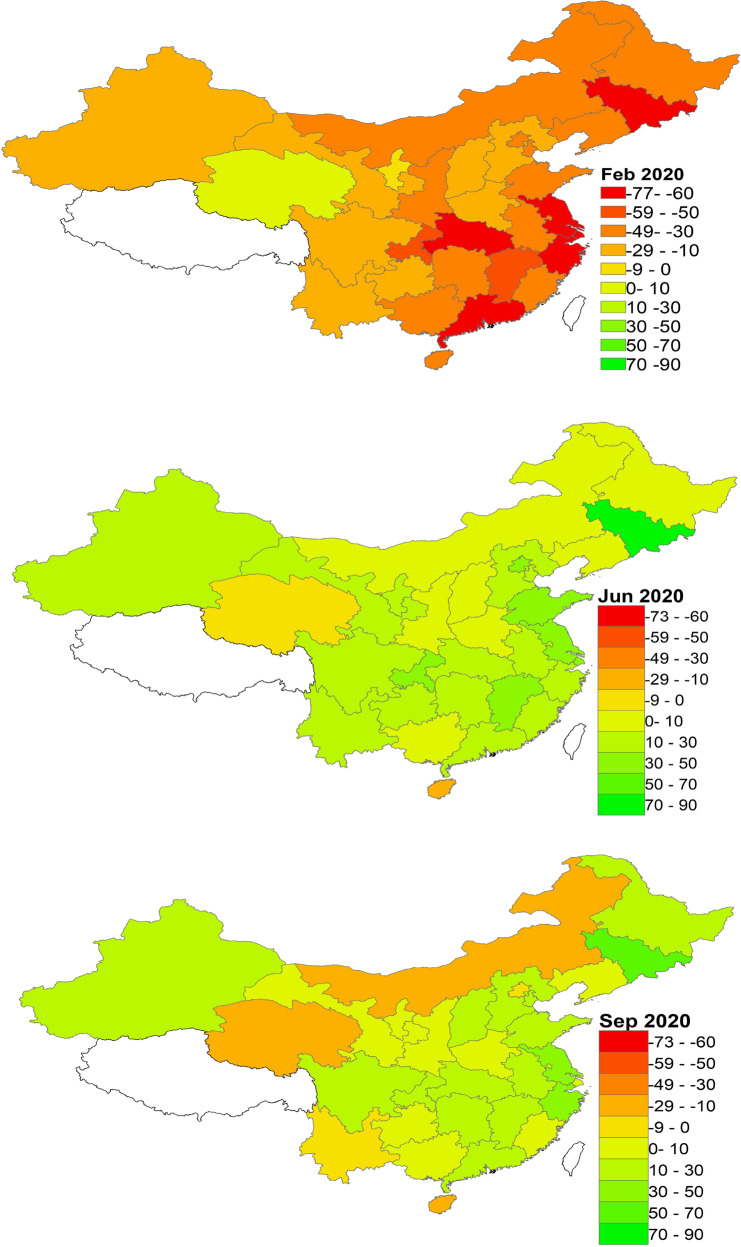
This study introduces a database for analyzing COVID-19's impacts on China's regional economies. This database contains various sectoral and regional economic outcomes at the weekly and monthly level. In the context of a general equilibrium trade model, we first formulate a mathematical representation of the Chinese regional economy and calibrate the model with China's multi-regional input-output table. We then utilize the monthly provincial and sectoral value-added and national trade series to estimate COVID-19's province-by-month labor-productivity impacts from February 2020 to September 2020. As a year-on-year comparison, relative to February 2019 levels, we find an average 39.5% decrease in labor productivity (equivalent to around 305 million jobs) and an average 25.9% decrease in welfare. Labor productivity and welfare quickly returned to the recent high-growth trends for China in the latter half of 2020. By September 2020, relative to September 2019, average labor productivity increased by 12.2% (equivalent to around 94 million jobs) and average welfare increased by 8.2%.
Keywords: E20; F10; J01; R13.
© The Author(s), under exclusive licence to Springer Science+Business Media, LLC, part of Springer Nature 2022.
Conflict of interest statement
Conflict of interestThe authors declare no competing interests.
Figures


Similar articles
-
A multi-regional input-output table mapping China's economic outputs and interdependencies in 2012.Sci Data. 2018 Aug 7;5:180155. doi: 10.1038/sdata.2018.155. Sci Data. 2018. PMID: 30084849 Free PMC article.
-
Examining the effects of socioeconomic development on China's carbon productivity: A panel data analysis.Sci Total Environ. 2019 Apr 1;659:681-690. doi: 10.1016/j.scitotenv.2018.12.409. Epub 2018 Dec 31. Sci Total Environ. 2019. PMID: 31096398
-
Weighing China's embodied CO2 emissions and value added under global value chains: Trends, characteristics, and paths.J Environ Manage. 2022 Aug 15;316:115302. doi: 10.1016/j.jenvman.2022.115302. Epub 2022 May 19. J Environ Manage. 2022. PMID: 35597213
-
The Impacts of COVID-19 on China's Economy and Energy in the Context of Trade Protectionism.Int J Environ Res Public Health. 2021 Dec 3;18(23):12768. doi: 10.3390/ijerph182312768. Int J Environ Res Public Health. 2021. PMID: 34886492 Free PMC article.
-
Calculation of the contribution rate of China's hydraulic science and technology based on a feedforward neural network.PLoS One. 2019 Sep 11;14(9):e0222091. doi: 10.1371/journal.pone.0222091. eCollection 2019. PLoS One. 2019. PMID: 31509561 Free PMC article.
Cited by
-
The impact of COVID-19 and associated policy responses on global food security.Agric Econ. 2022 Nov;53(6):855-869. doi: 10.1111/agec.12749. Epub 2022 Nov 4. Agric Econ. 2022. PMID: 36718268 Free PMC article.
-
The impact of COVID-19 pandemic on the world's major economies: based on a multi-country and multi-sector CGE model.Front Public Health. 2024 Mar 19;12:1338677. doi: 10.3389/fpubh.2024.1338677. eCollection 2024. Front Public Health. 2024. PMID: 38566793 Free PMC article.
-
Approximating Terms of Trade Effects in Single Country CGE Models.J Glob Econ Anal. 2024 Dec 27;9(2):70-111. doi: 10.21642/JGEA.090202AF. J Glob Econ Anal. 2024. PMID: 40546297 Free PMC article.
References
-
- Barrot JN, Grassi B, Sauvagnat J (2021) Sectoral effects of social distancing. AEA Papers and Proceedings, Pittsburgh, PA (111): 277–81. 10.1257/pandp.20211108
-
- Bartik A, Bertrand M, Lin F, Rothstein J, Unrath M (2020) Measuring the labor market at the onset of the COVID-19 crisis. Technical Report w27613, NBER Working Paper, Cambridge, MA, https://www.nber.org/system/files/working_papers/w27613/w27613.pdf
-
- Barwick PJ, Deng Y, Huang X, Li S, Li T (2020) Covid-19 pandemic and unemployment: evidence from mobile phone data in China. Technical Report, SSRN Working Paper 10.2139/ssrn.3755371
-
- Bauer A, Haltom N, Rubio-Ramirez JF. Smoothing the shocks of a dynamic stochastic general equilibrium model. Econ Rev. 2005;90(2):35–49.
LinkOut - more resources
Full Text Sources
Research Materials
Miscellaneous