. 2022 Jul 29;4(3):zcac024.
doi: 10.1093/narcan/zcac024. eCollection 2022 Sep.

KAP1 is a new non-genetic vulnerability of malignant pleural mesothelioma (MPM)

Affiliations

KAP1 is a new non-genetic vulnerability of malignant pleural mesothelioma (MPM)

Eugenia Lorenzini et al. NAR Cancer. .

Abstract

Malignant pleural mesothelioma (MPM) is a rare and incurable cancer, which incidence is increasing in many countries. MPM escapes the classical genetic model of cancer evolution, lacking a distinctive genetic fingerprint. Omics profiling revealed extensive heterogeneity failing to identify major vulnerabilities and restraining development of MPM-oriented therapies. Here, we performed a multilayered analysis based on a functional genome-wide CRISPR/Cas9 screening integrated with patients molecular and clinical data, to identify new non-genetic vulnerabilities of MPM. We identified a core of 18 functionally-related genes as essential for MPM cells. The chromatin reader KAP1 emerged as a dependency of MPM. We showed that KAP1 supports cell growth by orchestrating the expression of a G2/M-specific program, ensuring mitosis correct execution. Targeting KAP1 transcriptional function, by using CDK9 inhibitors resulted in a dramatic loss of MPM cells viability and shutdown of the KAP1-mediated program. Validation analysis on two independent MPM-patients sets, including a consecutive, retrospective cohort of 97 MPM, confirmed KAP1 as new non-genetic dependency of MPM and proved the association of its dependent gene program with reduced patients' survival probability. Overall these data: provided new insights into the biology of MPM delineating KAP1 and its target genes as building blocks of its clinical aggressiveness.


Figures

Graphical Abstract
Graphical Abstract
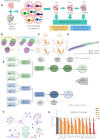
Schematic model of the mechanism of MPM-dependency from KAP1 and its clinical implications. KAP1 binding to the B-MYB/FOXM1-MuvB complex sitting on CHR promoters fosters the recruitment of CDK9 for prompt activation of RNA-PolII into proficient elongation on G2/M genes, thus ensuring correct mitosis execution. KAP1 loss, as well as CDK9 inhibitors, leads to mitosis failure that results in cell death. Moreover, KAP1 high expression is associated to bad survival of MPM patients.
Figure 1.
Figure 1.
Genome-wide CRISPR-Cas9 screening in MSTO-211H cells. (A) Graphic overview of the genome-wide CRISPR/Cas9 screening performed in MSTO-211H cells; time points are relative to the start of the selection. (B) Venn diagrams reporting the number of genes identified in the two replicates at each time point and final merge for both essential (left) and suppressor (right) genes. (C) Volcano plots showing beta value and FDR adjusted P-value distributions at both time points and in each bio-replicate. (D) Graphic representation of the distribution of common essential, MPM essential and MPM suppressor genes in seven MPM cell lines according to DEPMAP database, ordered for dependency score. (E) Schematic representation of the flowchart that we adopted to analyze the screening results. (F) Network representation of the most significant enriched pathways for the 233 MPM essential genes. (G) Validation assay of the effect of the reported MPM essential genes using a competition assay. For each time point the ratio between GFP-positive (infected) and GFP-negative (uninfected) cells has been calculated and normalized on T0. Statistical significance has been calculated comparing the normalized ratio for each sample to T0. Data are mean ± SEM; *P < 0.05; N = 2.
Figure 2.
Figure 2.
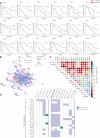
The genome-wide CRISPR-Cas9 screening identifies chromatin organization as key node for MPM progression. (A) Kaplan–Meier plots showing correlation of the 18 epigenetic readers with MPM patients survival based on TCGA data; (N = 87). Patients were divided in quartiles of gene expression and compared between first (red) and fourth (black) quartiles. (B) Protein–protein interaction network of the 18 epigenetic readers essential for MPM survival and added interactors by STRING (v11). The type of evidence linked to each edge is represented by a color scale. (C) Expression correlation matrix (Spearman test) within the 18 chromatin readers based on TCGA MPM data; *P < 0.05, **P < 0.01, ***P < 0.001. (D) Association among the expressions of the 18 chromatin readers and MPM most relevant mutations and mutational burden according to TCGA data. MPM samples were dichotomized based on the presence of mutations. Differential analysis was conducted to establish whether the expression of the 18 MPM essential epigenetic readers showed a significantly different distribution in the mutated vs non-mutated group. POS and NEG association mean respectively higher or lower gene expression (on Y axis) in presence of mutations (on X axis). Association was established by Kruskal test adjusted for Benjamini–Hochberg. Results were considered significant for Padjusted <0.05. Percentage of mutated patients is reported following the gene name. Genes showing CNA or mutations in less than 5 patients were not considered.
Figure 3.
Figure 3.
KAP1 inactivation strongly impairs proliferation of MPM cells and delays cell cycle. (A, B) Proliferation assays in MSTO-211H (A) and NCI-H2052 (B) cells reported as proliferation rate relative to day 0, measured with Incucyte S3 Live Cell Analysis (Sartorius). Data are represented as mean ± SEM; *P < 0.05; N = 3. The panels on top represent western blot of KAP1 protein loss upon KAP1 KD at 72 h after siRNA release. (C, D) KAP1 KD effect on colony forming ability of MSTO-211H (C) and NCI-H2052 (D) cells. Data are mean ± SEM; *P < 0.05; N = 2. (E) Cell cycle analysis of MSTO-211H/Cas9 NT1 versus KAP1-sg.1 cells performed with a FACS Canto cytometer upon Nicoletti staining. The analysis was performed 4 days after infection. Data are represented as mean ± SEM; *P< 0.05; N = 3. (H) Apoptosis analysis through Annexin V and 7AAD staining in MSTO-211H (F) and NCI-H2052 (H) cells. Cells were collected 72 h after transfection and analyzed with a FACS Canto cytometer. Data are represented as mean ± SEM; *P < 0.05; N = 3. (G, I) Western Blot of MPM cells showing accumulation of the pro-apoptotic protein BAX in KAP1 KD cells in MSTO-211H (G) and NCI-H2052 (I) cells at 72 h post transfection.
Figure 4.
Figure 4.
KAP1 KD results in down-regulation of G2/M genes. (A) Distribution of KAP1 target genes as emerged by RNA-seq profiling percentages of cell cycle and mitotic downregulated genes. (B) Barplot of the most significant enriched pathways (FDR<0.05) for genes that are downregulated from RNA-seq. (C) MA plot visualization of differential expression analysis performed on RNA-seq data. The essential core of downregulated genes is highlighted. (DG) qRT-PCR and western blot validation of the indicated KAP1 target genes in siKAP1 and siCTRL cells in MSTO-211H (D, E) and NCI-H2052 cells (F, G). Data are represented as mean ± SEM; *P < 0.05; N = 4. (H) Distribution of mitotic morphological features in siKAP1 versus siCtrl MSTO-211H cells analyzed by immunofluorescence staining. (I) Immunofluorescence showing B-tubulin (red) in MSTO-211H siCTRL and siKAP1 cells. B-tubulin antibodies were used to visualize mitotic spindles. (J) Immunofluorescence staining of AURKA and H3-pSer10 in siKAP1 and siCtrl MSTO-211H cells. (K) Immunofluorescence staining of AURKB and F-actin in siKAP1 and siCtrl MSTO-211H cells. Scale bars 100 μm. (L) Heatmap of the 43 CHR genes that were significantly downregulated in KAP1 KO cells and showed KAP1 binding in their promoter by ChIP-seq analysis. Genes were grouped based on unsupervised hierarchical clustering according to expression values expressed as Log2 Fold Change. The list of CHR genes was taken from Fischer et al. (38).
Figure 5.
Figure 5.
CDK9i phenocopied KAP1 loss, leading to dose-dependent MPM cell growth inhibition. (A) Visualization of KAP1, CDK9, RNA-PolII and pSer2-RNA-PolII binding profiles on selected target genes with Integrative Genome Viewer (IGV). (B) ChIP analysis of KAP1 binding on its mitotic target genes. Values are represented as percentage of input. Data are expressed as mean + SD and one representative experiment is reported. (CE) Co-IP experiments in MSTO-211H cells. IP and WB were conducted with the indicated antibodies. One representative experiment is reported; N = 3. (F) ChIP analysis of RNA-PolII binding on KAP1 mitotic target gene promoters in siCTRL and siKAP1 MSTO-211H cells; (CD69 negative control). Values are represented as percentage of input. Data are expressed as mean ± SD and one representative experiment is reported. (G) ChIP analysis showing pSer2-RNA-PolII binding alongside the gene-body of AURKB in siCTRL and siKAP1 MSTO-211H cells; CD69 promoter is used as a negative control. Values are represented as percentage of input. Data are expressed as mean ± SD and one representative experiment is reported. (H, I) Proliferation assays showing the effect of the CDK9i AZD4573 at sublethal doses in MSTO-211H (H) and NCI-H2052 (I) cell lines. Proliferation rates were measured with Incucyte S3 Live Cell Analysis (Sartorius). Data are expressed as mean ± SEM; *P < 0.05, **P < 0.01, ***P < 0.001; N = 3. (J, K) Distribution of mitotic morphological features in 10 nM AZD4573 versus DMSO treated MSTO-211H (J) and NCI-H2052 (K) cells analyzed by immunofluorescence staining. Inserts display representative immunofluorescence showing DAPI staining in 10 nM AZD4573 versus DMSO treated MSTO-211H and NCI-H2052 cells. Pink arrows indicate mitotic nuclei while white arrows indicate apoptotic nuclei. (L, M) qRT-PCR analysis of a subset of KAP1 direct target genes in MPM cell lines treated with DMSO or sublethal doses of AZD4573. Data are expressed as mean ± SEM. *P < 0.05, **P < 0.01, ***P < 0.001.
Figure 6.
Figure 6.
KAP1 and its dependent gene program are prognostic marker in MPM patients. (A) Flowchart of the validation analysis in the MPM-TCGA and MPM-RE cohort. FU: follow up. (B, C) PCA analysis of the distribution of long and short survivors (I and IV quartile) based on the expression of KAP1 and its targets genes in both cohorts (FDR < 0.05). (D, E) Expression correlation matrix (Spearman test) within KAP1 and its mitotic target genes in the MPM-TCGA (D) and MPM-RE (E) cohorts; *P < 0.05, **P < 0.01, ***P < 0.001. (F, G) Histogram representing the ratio of expression of the indicated genes in short versus long survivors (I and IV quartile). *P < 0.05, **P < 0.01, ***P < 0.001 MPM-TCGA (F) and MPM-RE (G) datasets. (H, I) Forest-Plot displaying the correlation of KAP1 and its target genes with reduced survival probability in MPM patients. The analysis in the MPM-RE cohort (I) was corrected for surgery and chemotherapy treatment.

Similar articles

Cited by

References

    1. Galateau-Salle F., Churg A., Roggli V., Travis W.D.World Health Organization Committee for Tumors of the Pleura The 2015 World Health Organization classification of tumors of the pleura: advances since the 2004 classification. J. Thorac. Oncol. 2016; 11:142–154. - PubMed
    1. Carbone M., Ly B.H., Dodson R.F., Pagano I., Morris P.T., Dogan U.A., Gazdar A.F., Pass H.I., Yang H. Malignant mesothelioma: facts, myths, and hypotheses. J. Cell. Physiol. 2012; 227:44–58. - PMC - PubMed
    1. Bianchi C., Bianchi T. Malignant mesothelioma: global incidence and relationship with asbestos. Ind. Health. 2007; 45:379–387. - PubMed
    1. Lococo F., Torricelli F., Lang-Lazdunski L., Veronesi G., Rena O., Paci M., Casadio C., Piana S., Novellis P., Di Stefano T.S. et al. . Survival results in biphasic malignant pleural mesothelioma patients: a multicentric analysis. J. Thorac. Cardiovasc. Surg. 2020; 159:1584–1593. - PubMed
    1. Yap T.A., Aerts J.G., Popat S., Fennell D.A. Novel insights into mesothelioma biology and implications for therapy. Nat. Rev. Cancer. 2017; 17:475–488. - PubMed