

RNA-binding protein CELF6 modulates transcription and splicing levels of genes associated with tumorigenesis in lung cancer A549 cells
- PMID: 35910766
- PMCID: PMC9336609
- DOI: 10.7717/peerj.13800
RNA-binding protein CELF6 modulates transcription and splicing levels of genes associated with tumorigenesis in lung cancer A549 cells
Abstract
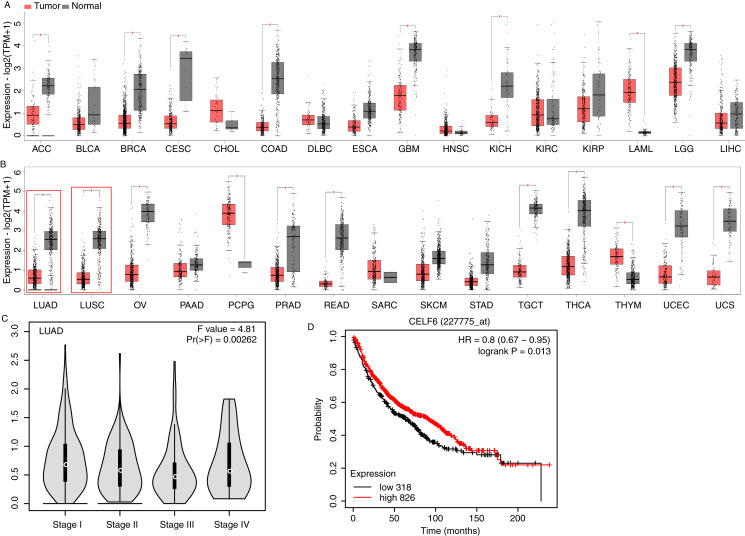
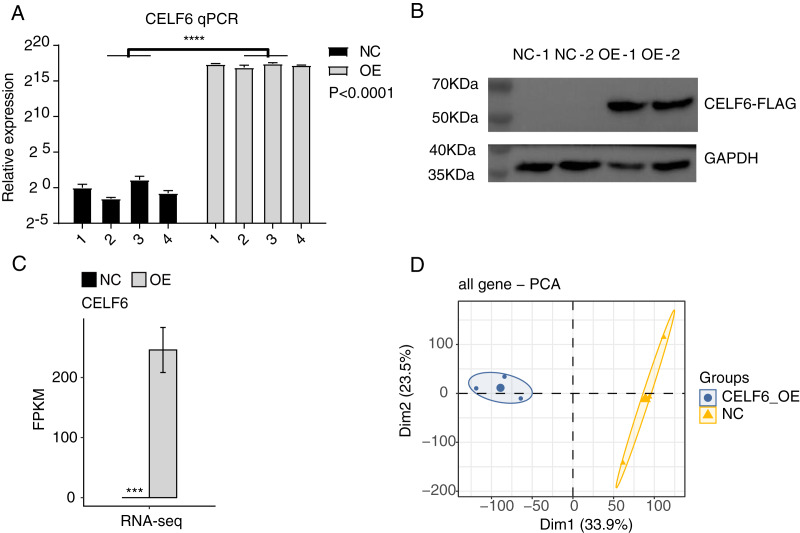
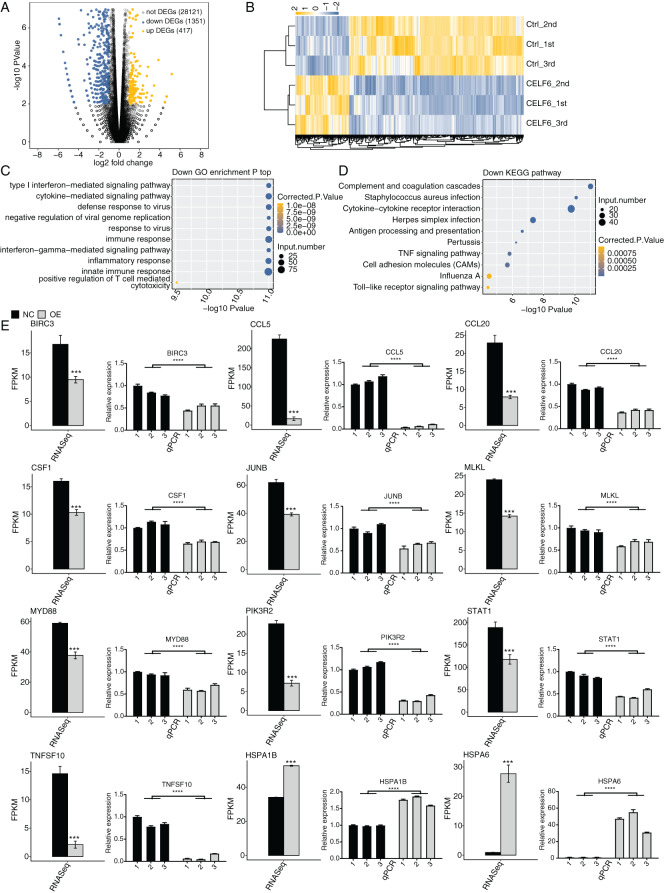
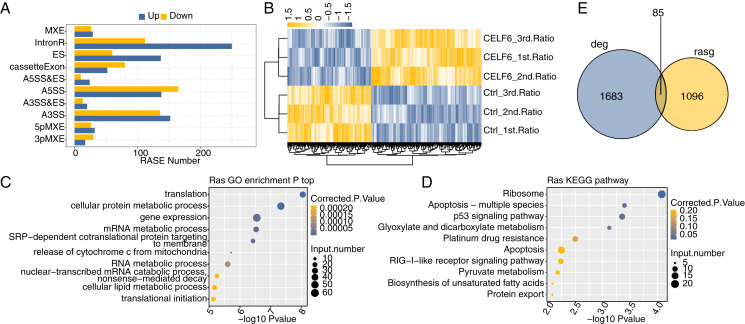
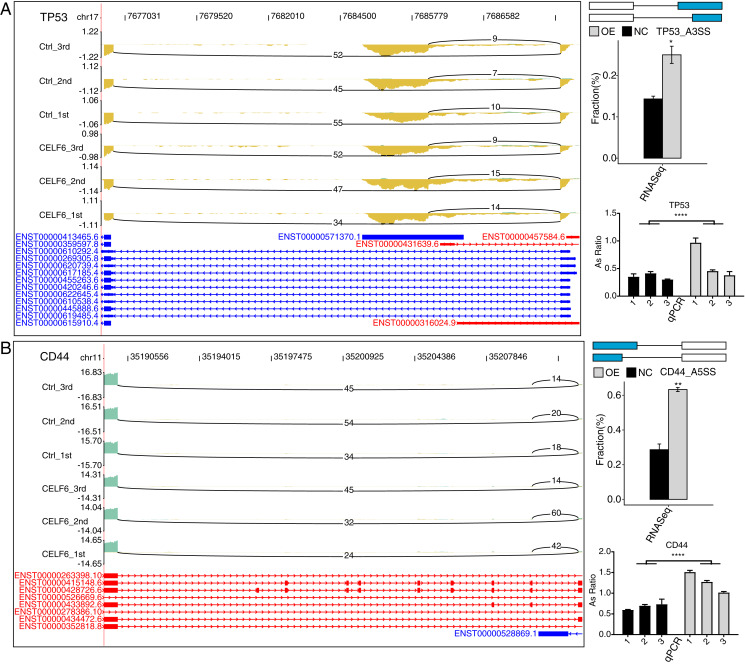
CELF6 (CUGBP Elav-Like Family Member 6), a canonical RNA binding protein (RBP), plays important roles in post-transcriptional regulation of pre-mRNAs. However, the underlying mechanism of lower expressed CELF6 in lung cancer tissues is still unclear. In this study, we increased CELF6 manually in lung cancer cell line (A549) and utilized transcriptome sequencing (RNA-seq) technology to screen out differentially expressed genes (DEGs) and alternative splicing events (ASEs) after CELF6 over-expression (CELF6-OE). We found that CELF6-OE induced 417 up-regulated and 1,351 down-regulated DEGs. Functional analysis of down-regulated DEGs showed that they were highly enriched in immune/inflammation response- related pathways and cell adhesion molecules (CAMs). We also found that CELF6 inhibited the expression of many immune-related genes, including TNFSF10, CCL5, JUNB, BIRC3, MLKL, PIK3R2, CCL20, STAT1, MYD88, and CFS1, which mainly promote tumorigenesis in lung cancer. The dysregulated DEGs were also validated by reverse transcriptase quantitative polymerase chain reaction (RT-qPCR) experiment. In addition, CELF6 regulates the splicing pattern of large number of genes that are enriched in p53 signaling pathway and apoptosis, including TP53 and CD44. In summary, we made an extensive analysis of the transcriptome profile of gene expression and alternative splicing by CELF6-OE, providing a global understanding of the target genes and underlying regulation mechanisms mediated by CELF6 in the pathogenesis and development of lung cancer.
Keywords: Alternative splicing; CELF6; Lung cancer; RNA-Binding Protein; RNA-seq.
© 2022 Ma et al.
Conflict of interest statement
Dong Chen and Joshua Wang were employed by the company of Wuhan Ruixing Biotechnology Co. Ltd.
Figures
Similar articles
-
CELF6, a member of the CELF family of RNA-binding proteins, regulates muscle-specific splicing enhancer-dependent alternative splicing.J Biol Chem. 2004 Apr 23;279(17):17756-64. doi: 10.1074/jbc.M310687200. Epub 2004 Feb 3. J Biol Chem. 2004. PMID: 14761971
-
Fascin actin-bundling protein 1 regulates non-small cell lung cancer progression by influencing the transcription and splicing of tumorigenesis-related genes.PeerJ. 2023 Dec 5;11:e16526. doi: 10.7717/peerj.16526. eCollection 2023. PeerJ. 2023. PMID: 38077434 Free PMC article.
-
Exploring gene expression, alternative splicing events and RNA-binding proteins changes in PBMC from patients with hyperuricemia.Gene. 2025 Mar 20;942:149256. doi: 10.1016/j.gene.2025.149256. Epub 2025 Jan 17. Gene. 2025. PMID: 39828062
-
CELF Family Proteins in Cancer: Highlights on the RNA-Binding Protein/Noncoding RNA Regulatory Axis.Int J Mol Sci. 2021 Oct 14;22(20):11056. doi: 10.3390/ijms222011056. Int J Mol Sci. 2021. PMID: 34681716 Free PMC article. Review.
-
Alternative splicing modulates cancer aggressiveness: role in EMT/metastasis and chemoresistance.Mol Biol Rep. 2021 Jan;48(1):897-914. doi: 10.1007/s11033-020-06094-y. Epub 2021 Jan 5. Mol Biol Rep. 2021. PMID: 33400075 Review.
Cited by
-
Long noncoding RNA LINC01594 inhibits the CELF6-mediated splicing of oncogenic CD44 variants to promote colorectal cancer metastasis.Cell Death Dis. 2023 Jul 14;14(7):427. doi: 10.1038/s41419-023-05924-8. Cell Death Dis. 2023. PMID: 37452042 Free PMC article.
-
CELF1 Promotes Post-myocardial Infarction Cardiac Remodeling Via Suppression of FMO2.Cardiovasc Toxicol. 2025 Mar;25(3):441-454. doi: 10.1007/s12012-024-09951-5. Epub 2025 Feb 28. Cardiovasc Toxicol. 2025. PMID: 40021568
-
The role of RNA binding proteins in cancer biology: A focus on FMRP.Genes Dis. 2024 Dec 21;12(4):101493. doi: 10.1016/j.gendis.2024.101493. eCollection 2025 Jul. Genes Dis. 2024. PMID: 40271197 Free PMC article. Review.
-
RNA-binding proteins and autophagy in lung cancer: mechanistic insights and therapeutic perspectives.Discov Oncol. 2025 Apr 24;16(1):599. doi: 10.1007/s12672-025-02413-6. Discov Oncol. 2025. PMID: 40272614 Free PMC article. Review.
-
Role of the RNA-binding protein family in gynecologic cancers.Am J Cancer Res. 2023 Aug 15;13(8):3799-3821. eCollection 2023. Am J Cancer Res. 2023. PMID: 37693158 Free PMC article. Review.
References
-
- Canale M, Petracci E, Delmonte A, Bronte G, Chiadini E, Ludovini V, Dubini A, Papi M, Baglivo S, De Luigi N, Verlicchi A, Chiari R, Landi L, Metro G, Burgio MA, Crino L, Ulivi P. Concomitant TP53 mutation confers worse prognosis in EGFR-mutated non-small cell lung cancer patients treated with TKIs. Journal of Clinical Medicine. 2020;9(4):1047. doi: 10.3390/jcm9041047. - DOI - PMC - PubMed
Publication types
MeSH terms
Substances
LinkOut - more resources
Full Text Sources
Medical
Molecular Biology Databases
Research Materials
Miscellaneous
