. 2022 Jul 11;12(12):5364-5388.
doi: 10.7150/thno.72713. eCollection 2022.

Impairment of autophagy after spinal cord injury potentiates neuroinflammation and motor function deficit in mice

Affiliations

Impairment of autophagy after spinal cord injury potentiates neuroinflammation and motor function deficit in mice

Yun Li et al. Theranostics. .

Abstract

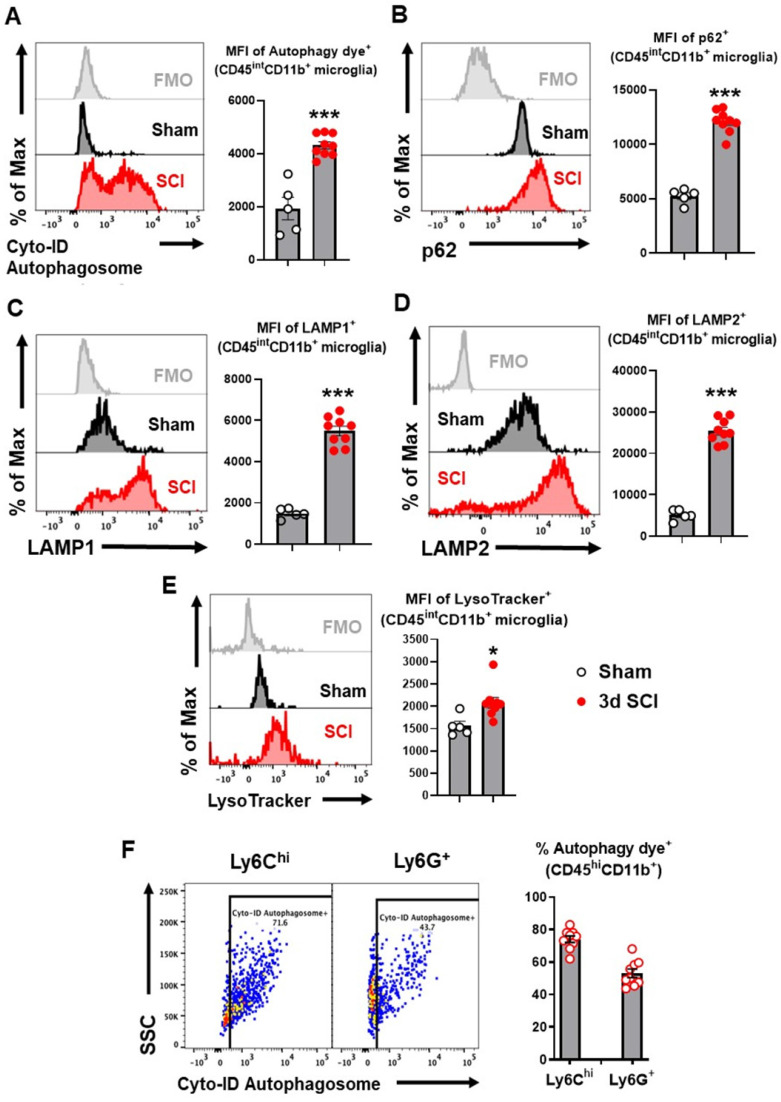
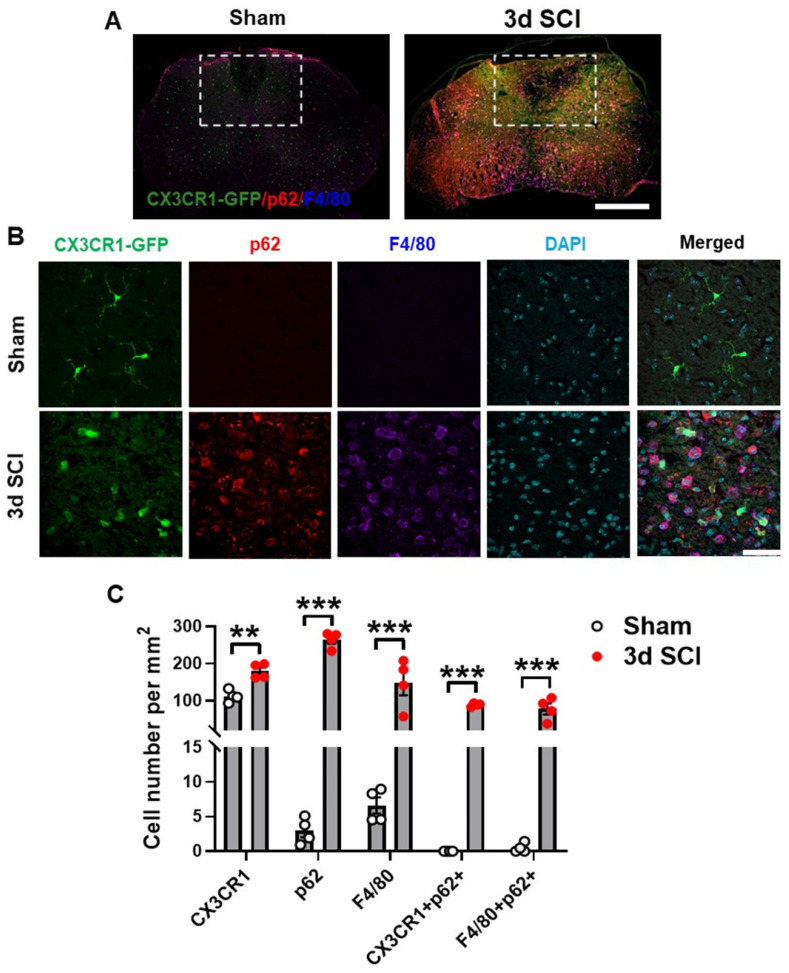
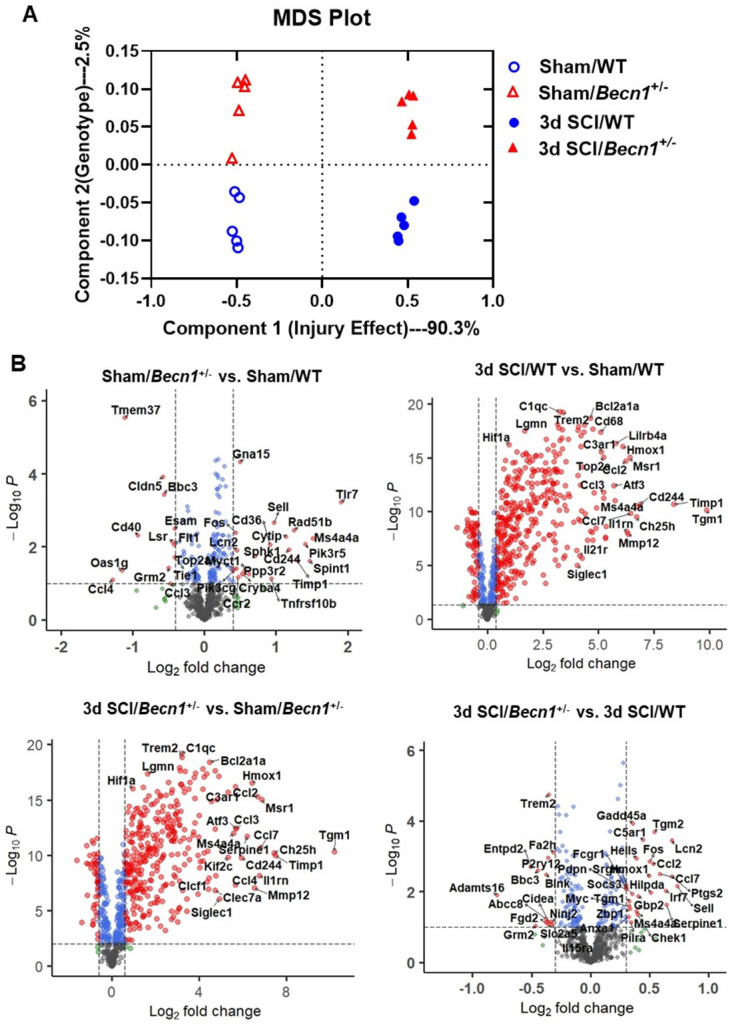
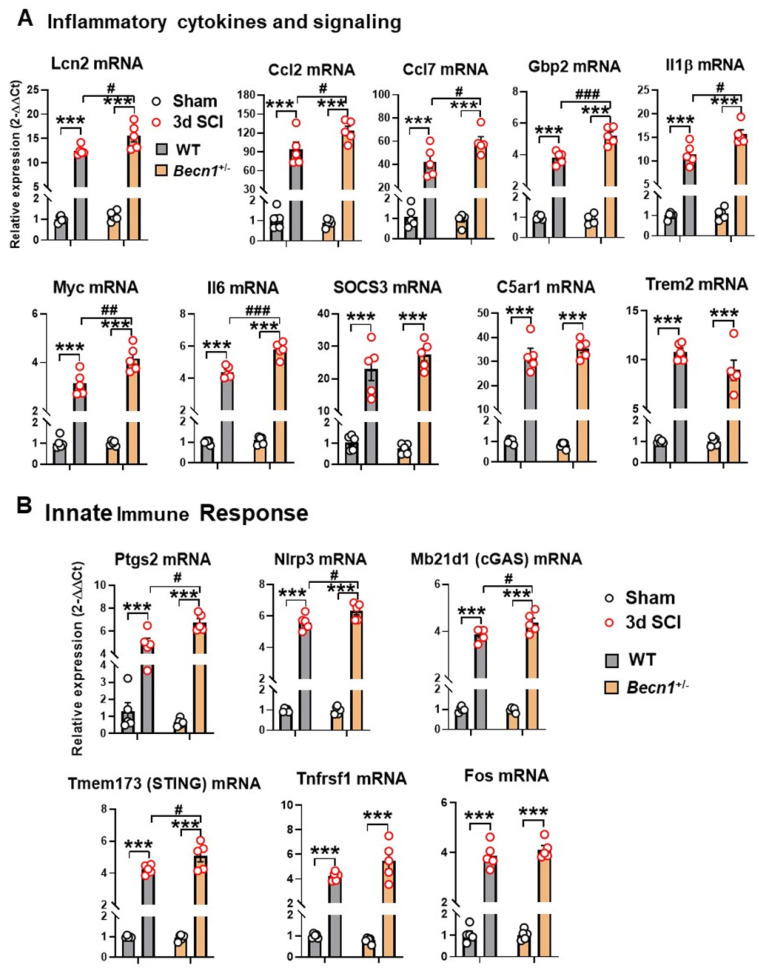
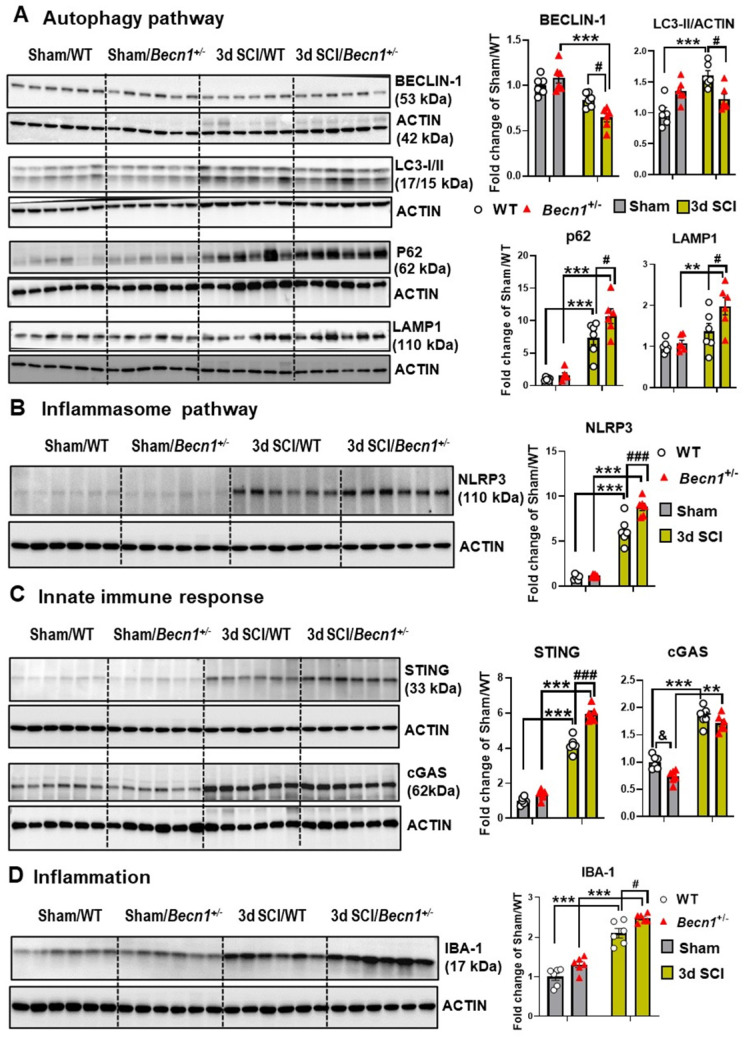
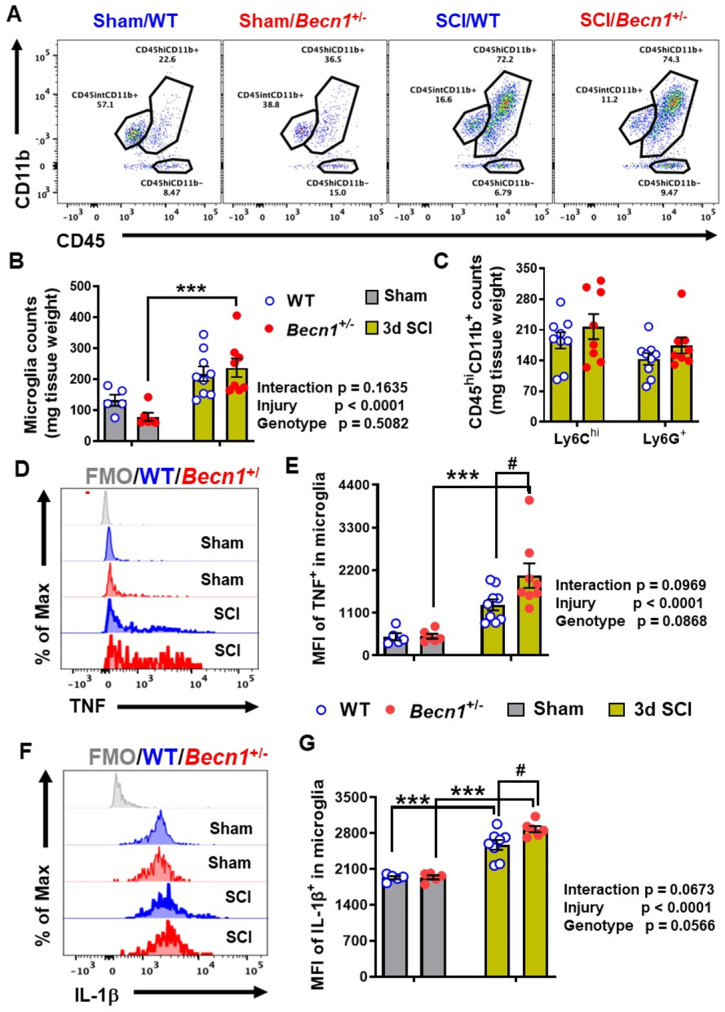
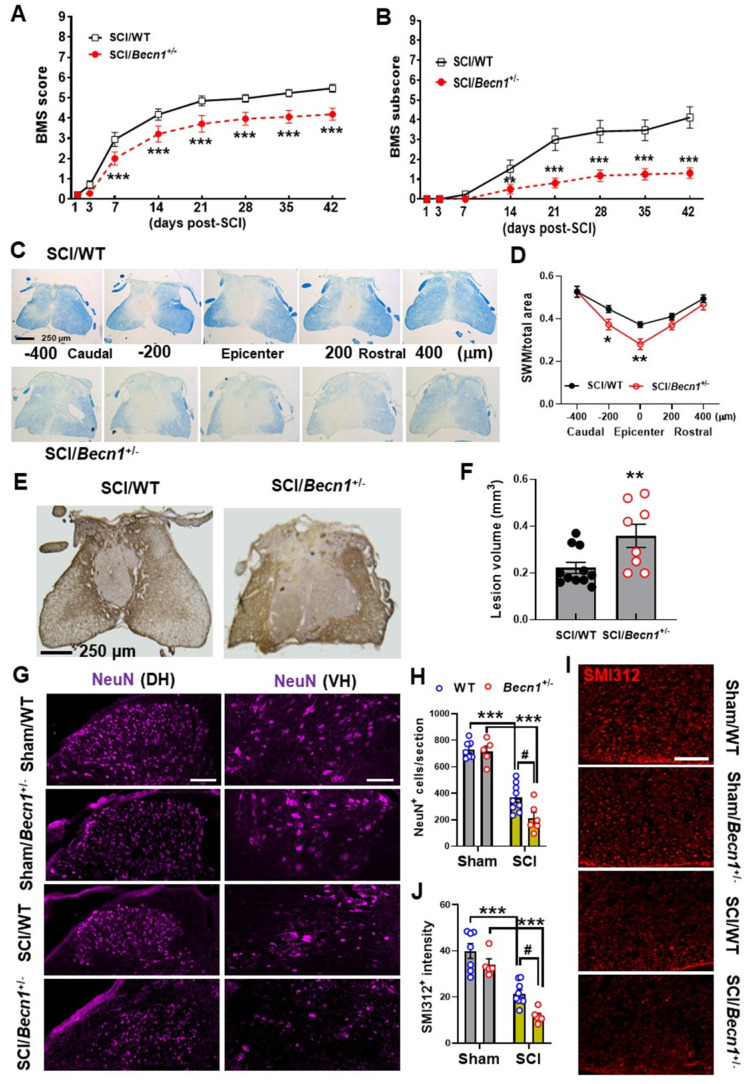
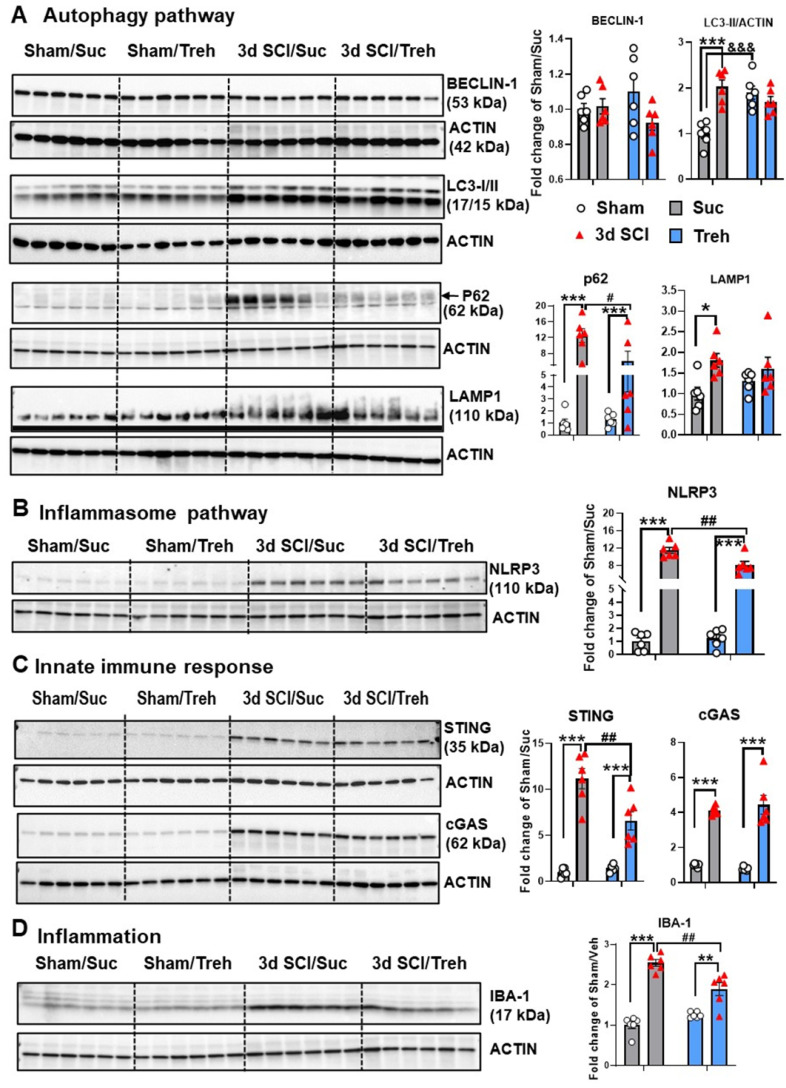
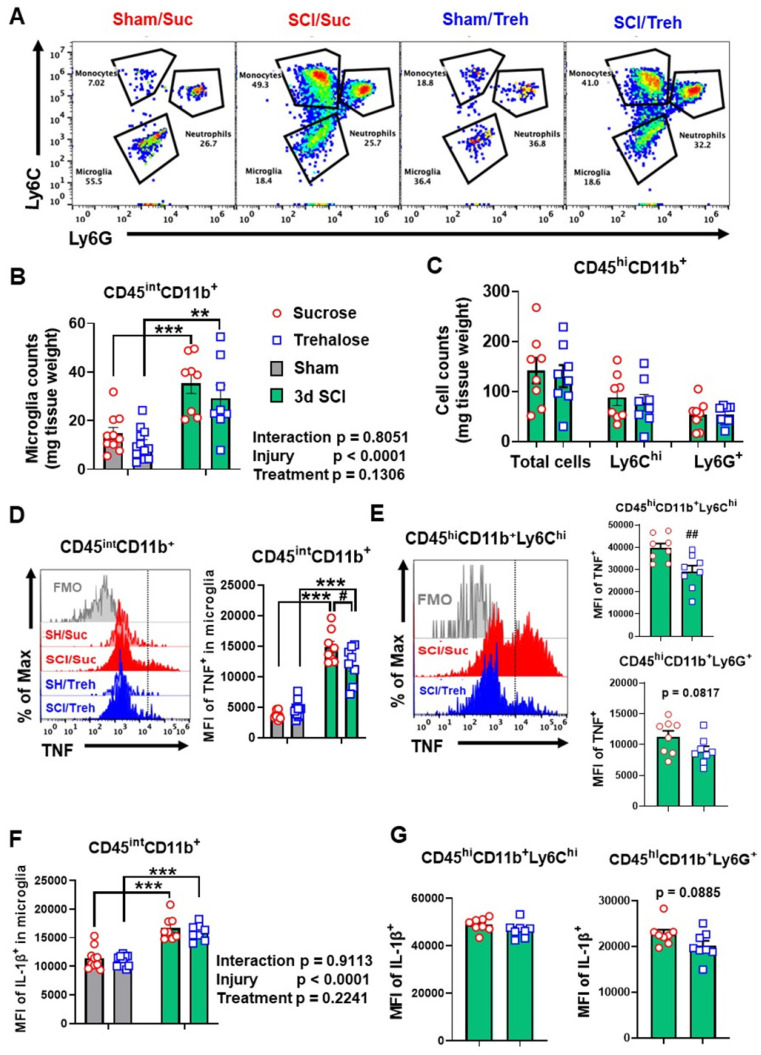
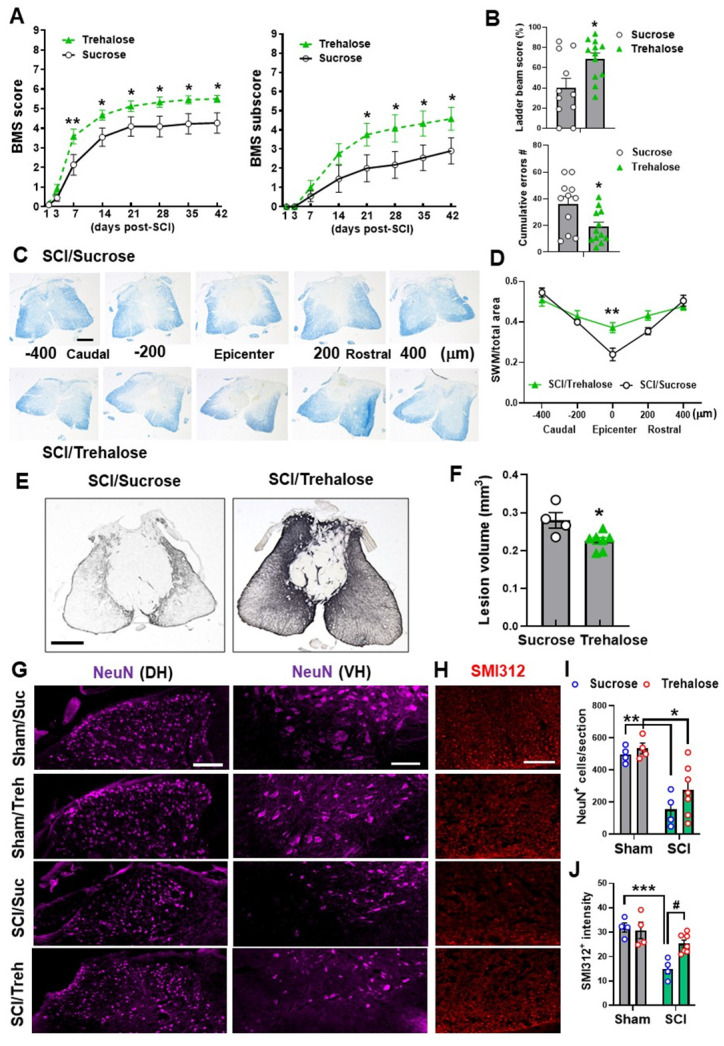
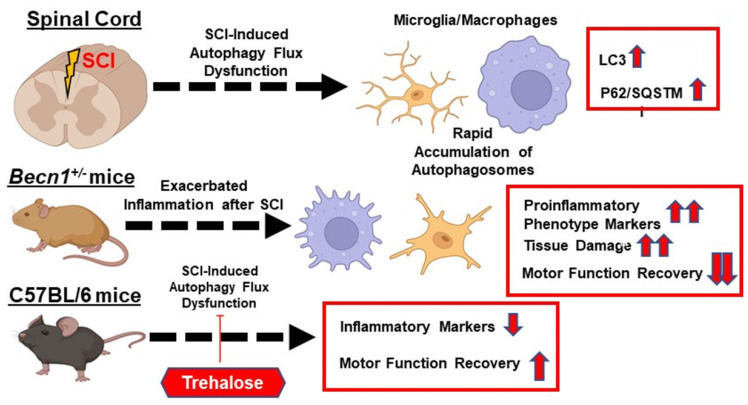
Autophagy is a catabolic process that degrades cytoplasmic constituents and organelles in the lysosome, thus serving an important role in cellular homeostasis and protection against insults. We previously reported that defects in autophagy contribute to neuronal cell damage in traumatic spinal cord injury (SCI). Recent data from other inflammatory models implicate autophagy in regulation of immune and inflammatory responses, with low levels of autophagic flux associated with pro-inflammatory phenotypes. In the present study, we examined the effects of genetically or pharmacologically manipulating autophagy on posttraumatic neuroinflammation and motor function after SCI in mice. Methods: Young adult male C57BL/6, CX3CR1-GFP, autophagy hypomorph Becn1+/- mice, and their wildtype (WT) littermates were subjected to moderate thoracic spinal cord contusion. Neuroinflammation and autophagic flux in the injured spinal cord were assessed using flow cytometry, immunohistochemistry, and NanoString gene expression analysis. Motor function was evaluated with the Basso Mouse Scale and horizontal ladder test. Lesion volume and spared white matter were evaluated by unbiased stereology. To stimulate autophagy, disaccharide trehalose, or sucrose control, was administered in the drinking water immediately after injury and for up to 6 weeks after SCI. Results: Flow cytometry demonstrated dysregulation of autophagic function in both microglia and infiltrating myeloid cells from the injured spinal cord at 3 days post-injury. Transgenic CX3CR1-GFP mice revealed increased autophagosome formation and inhibition of autophagic flux specifically in activated microglia/macrophages. NanoString analysis using the neuroinflammation panel demonstrated increased expression of proinflammatory genes and decreased expression of genes related to neuroprotection in Becn1+/- mice as compared to WT controls at 3 days post-SCI. These findings were further validated by qPCR, wherein we observed significantly higher expression of proinflammatory cytokines. Western blot analysis confirmed higher protein expression of the microglia/macrophage marker IBA-1, inflammasome marker, NLRP3, and innate immune response markers cGAS and STING in Becn1+/- mice at 3 day after SCI. Flow cytometry demonstrated that autophagy deficit did not affect either microglial or myeloid counts at 3 days post-injury, instead resulting in increased microglial production of proinflammatory cytokines. Finally, locomotor function showed significantly worse impairments in Becn1+/- mice up to 6 weeks after SCI, which was accompanied by worsening tissue damage. Conversely, treatment with a naturally occurring autophagy inducer trehalose, reduced protein levels of p62, an adaptor protein targeting cargo to autophagosomes as well as the NLRP3, STING, and IBA-1 at 3 days post-injury. Six weeks of trehalose treatment after SCI led to improved motor function recovery as compared to control group, which was accompanied by reduced tissue damage. Conclusions: Our data indicate that inhibition of autophagy after SCI potentiates pro-inflammatory activation in microglia and is associated with worse functional outcomes. Conversely, increasing autophagy with trehalose, decreased inflammation and improved outcomes. These findings highlight the importance of autophagy in spinal cord microglia and its role in secondary injury after SCI.

Keywords: Autophagy; Beclin-1; Microglia; Neuroinflammation; Spinal cord injury.


Conflict of interest statement

Competing Interests: The authors have declared that no competing interest exists.

Figures

Figure 1
Figure 1
Autophagy flux is inhibited in microglia and infiltrating monocytes in acute phase SCI. Young adult male C57BL/6 mice were subjected to moderate contusion injury at T10 and flow cytometry was used to examine autophagy biomarkers at 3 days post-injury. (A) Representative histograms and mean fluorescent intensity (MFI) quantification show the relative production of autophagosomes in CD45intCD11b+ microglia as measured by the Cyto-ID Autophagy Detection Kit. (B-D) Representative histograms and MFI of p62/SQSTM1 (B), LAMP1 (C), and LAMP2 (D) in CD45intCD11b+ microglia. (E) Representative histograms and MFI of lysosomal activity in microglia as measured by the LysoTracker dye. (F) Representative dot plots and quantitative data depict the composition of infiltrating CD45hiCD11b+ monocytes with Cyto-ID positive staining in the spinal cord injury site. n = 5 mice for Sham group and 9 mice for 3 d SCI group. ***p < 0.001. Two-tailed unpaired t-test.
Figure 2
Figure 2
Autophagosomes acutely accumulate in activated microglia and infiltrating macrophages at 3 days after SCI. Young adult male CX3CR1-GFP mice underwent moderate contusion injury at T10. (A) Immunohistochemistry (IHC) representative images of GFP+(green)/p62+(red)/F4/80+ (blue) cells at 0.3 mm rostral to the epicenter. Insets display the dorsal white matter for quantification. (B-C) Representative images and cell count quantification of p62 (red) and F4/80 (blue) positive cells in the dorsal white matter of CX3CR1-GFP mice. n = 4 mice/group. *p < 0.05, **p < 0.01, ***p < 0.001. Two-tailed unpaired t-test. Scale bar = 500 µm (A) and 50 µm (B).
Figure 3
Figure 3
Autophagy deficiency alters neuroinflammation transcriptome within the spinal cord at 3 days after SCI. (A) Multi-dimensional scaling (MDS) was performed using all normalized gene counts from the NanoString neuroinflammation panel. (B) Volcano plot of genes in each set of pairwise comparisons with Log2 (fold change) and Log10(P). n = 5 mice/group.
Figure 4
Figure 4
Becn1+/- mice display robust changes in signaling pathway and transcriptomes related to cellular function. (A) Pathway enrichment analysis of genes modified by SCI in Becn1+/- vs. WT mice. (B-D) Depending on the percentage of genes within each pathway that has been modified, the top three pathways are Inflammatory response (B), Cytokine signaling (C), and Innate immune response (D). The DE genes contained in each pathway are normalized into z-scores and the group average was used for the heatmaps.
Figure 5
Figure 5
The effects of autophagy deficiency on the inflammatory signaling and innate immune genes in the spinal cord at 3 d post-injury. (A) Quantitative real-time PCR revealed that a total of seven pro-inflammatory markers showed significantly higher levels in Becn1+/- mice compared to WT littermates at 3d after SCI. (B) Several innate immune genes (Ptgs2, Nlrp3, Mb21d1, and Tmem173) showed significant injury effects between Sham and SCI groups but increased even further in the spinal cord of SCI/Becn1+/- mice. n = 5 mice/group, ***p < 0.001 vs. Sham groups; #p < 0.05, ##p < 0.01, ###p < 0.001 vs. SCI/WT. Two-way ANOVA followed by Tukey's multiple comparison.
Figure 6
Figure 6
Effects of autophagy deficiency on protein expression level of key inflammatory and autophagic markers. Young adult male Becn1+/- and WT mice were subjected to moderate contusion injury and Western blotting was used to examine autophagic and inflammatory markers at 3 d post-injury. (A) Expression of BECLIN-1, p62, the autophagosome marker LC3-II and the lysosome marker LAMP1. (B) Expression of inflammasomes NLRP3. (C) Expression of the markers cGAS and STING for innate immune response following SCI. (D) Expression of microglia/macrophages marker IBA-1. n = 6 mice/group, *p < 0.05, ***p < 0.001 vs. Sham/WT. #p < 0.05, ##p < 0.005, ###p < 0.001 vs. SCI/WT. Two-way ANOVA followed by Tukey's multiple comparison.
Figure 7
Figure 7
The effects of autophagy deficiency in Becn1+/- mice on the neuro-immune response in the spinal cord at 3 d post-injury. (A-C) Flow cytometry analysis showed increased numbers of CD45intCD11b+ microglia and CD45hiCD11b+ leukocyte infiltration in both WT and Becn1+/- mice following SCI. Representative dot plot of immune cells in the spinal cord of sham and injured mice are shown in A. Quantification of CD45intCD11b+ microglia counts and CD45hiCD11b+ leukocyte are indicated in B and C. (D-G) Proinflammatory cytokines TNF (D-E) and IL-1β (F-G) in the microglia showed significant increase after SCI, with even higher levels in Becn1+/- mice. n = 5 (Sham/WT), 9 (SCI/WT), 6 (Sham/Becn1+/-), and 8 (SCI/Becn1+/-) mice. ***p < 0.001 vs. Sham groups. #p < 0.05 vs. SCI/WT. Two-way ANOVA followed by Tukey's multiple comparison.
Figure 8
Figure 8
Effects of autophagy deficiency on long-term functional outcome and tissue loss. (A-B) BMS and subscores for WT and Becn1+/- mice at weekly assessment of hindlimb motor function. Two-way repeated measurement ANOVA followed by Holm-Sidak's post-hoc test. n=17 (SCI/WT) and 16 mice (SCI/Becn1+/-). **p < 0.01, ***p < 0.001 vs. SCI/WT. (C-D) Representative images and quantification of spared white matter (SWM) at 6 w post-injury. n=11 (SCI/WT) and 8 mice (SCI/Becn1+/-). *p < 0.05, **p < 0.01 vs. SCI/WT. Two-way ANOVA followed by Tukey's multiple comparison. (E-F) Representative images of GFAP-DAB staining and quantification of the lesion volume at 6 w SCI. n=11 (SCI/WT) and 8 mice (SCI/Becn1+/-). **p < 0.01 vs. SCI/WT. Two-tailed unpaired t-test. (G-H) Representative images of NeuN (purple) staining at the ventral (VH) and dorsal horn (DH) and quantification in the grey matter (I-J) Representative images and quantification of the neurofilament marker SMI312 (red) in the white matter, Scale bars = 100 μm (G) and 50 μm (I). n = 7 (Sham/WT), 5 (Sham/Becn1+/-), 9 (SCI/WT), and 6 (SCI/Becn1+/-) mice/group. ***p < 0.001 vs. Sham groups; #p < 0.05 vs. SCI/WT. Two-way ANOVA followed by Tukey's multiple comparison.
Figure 9
Figure 9
Effects of Trehalose treatment on protein expression level of key inflammatory and autophagic markers. Young adult C57BL/6 mice subjected to moderate contusion injury were given 5% trehalose or sucrose via oral gavage twice per day in addition to treated drinking water. At 3 d after SCI, spinal cord tissue surrounding injury site were dissected for examination of the autophagic and inflammatory markers. Western blot analysis of protein expression for BECLIN-1, LC3-II, p62, and LAMP1 (A), NLRP3 (B), cGAS and STING (C), and IBA-1 (D) and the representative blot images are shown. n = 6 mice/group. * p < 0.05, **p < 0.05, ***p < 0.001 vs. Sham groups; #p < 0.05, ##p < 0.01 vs. SCI/WT; &&& p <0.001 vs. Sham/Suc group. Two-way ANOVA followed by Tukey's multiple comparison.
Figure 10
Figure 10
The effects of Trehalose treatment on the neuro-immune response of the spinal cord at 3 d post-injury. (A-C) Flow cytometry analysis showed similar numbers of CD45intCD11b+ microglia and CD45hiCD11b+ leukocyte infiltration in both sucrose (Suc) and trehalose (Treh) groups following SCI. Representative dot plot of immune cells in the spinal cord of sham and injured mice are shown in A. Quantification of CD45intCD11b+ microglia counts and CD45hiCD11b+ leukocyte are indicated in B and C. (D-G) Proinflammatory cytokine TNF (D-E) in microglia and monocytes showed significant decrease in Trehalose group after SCI, while IL-1β (F-G) remained the same between Trehalose and Sucrose. n = 10 (Sham/Suc), 8 (SCI/Suc), 12 (Sham/Treh), and 8 (SCI/Treh) mice. ** p < 0.01, *** p < 0.001 vs. Sham groups. # p < 0.05, ## p < 0.01 vs. SCI/Suc. Two-way ANOVA followed by Tukey's multiple comparison.
Figure 11
Figure 11
Effects of Trehalose on long-term functional outcomes following SCI. Young adult C57BL/6 mice were administrated 5% trehalose or sucrose via oral gavage twice per day for the first week followed by continuous administration at 2.5% trehalose or sucrose in their drinking water for 6 w. (A-B) BMS and subscores (A) showed significantly better recovery of their hindlimb motor function in trehalose-treated mice compared to sucrose-treated animals. Trehalose treated group showed significantly higher ladder beam scores and lower number of cumulative errors compared to sucrose control group in horizontal ladder test (B). n = 11 (sucrose) and 12 mice (trehalose). * p < 0.05, ** p < 0.01 vs. SCI/Sucrose group. (C-D) Representative images and quantification of SWM at 6 w post-injury. n = 4 (SCI/Sucrose) and 7 mice (SCI/Trehalose). ** p < 0.01 vs. SCI/Sucrose group. Scale bars = 250 μm. (E-F) Representative images of GFAP-DAB staining and quantification of the lesion volume at 6 w SCI. n = 4 (SCI/Sucrose) and 7 mice (SCI/Trehalose). * p < 0.05 vs. SCI/Sucrose. Scale bars = 250 μm. (G-J) Immunohistochemistry (IHC) representative images of NeuN (G, purple) in the dorsal (DH) and ventral horn (VH) regions of the spinal cord at 6w after injury. H indicates representative images of the neurofilament marker SMI312 (red) in the surrounding white matter. Quantification of NeuN+ cells in the grey matter (I) and the SMI312+ intensity in the white matter (J) are presented. Scale bars = 100 μm (G) and 50 μm (H). n = 4 (Sham/Suc), 4 (Sham/Treh), 4 (SCI/Suc), and 7 (SCI/Treh) mice/group. * p < 0.05, ** p < 0.01, *** p < 0.001 vs. Sham groups; # p < 0.05 vs. SCI/Suc group. Two-way repeated measurement ANOVA followed by Holm-Sidak's post-hoc test for A, Mann Whitney test for B (upper panel) and D, unpaired t test for B (low panel) and F, Two-way ANOVA followed by Tukey's multiple comparison for I-J.
Figure 12
Figure 12
The function of autophagy in modulating neuroinflammation following spinal cord injury (SCI). The function of autophagy in modulating neuroinflammation following spinal cord injury (SCI). SCI impairs autophagic flux in microglia/macrophages. Genetically or pharmacologically manipulating autophagy can modulate SCI-mediated pro-inflammatory response and neurological recovery.

Similar articles

Cited by

References

    1. Wu J, Lipinski MM. Autophagy in Neurotrauma: Good, Bad, or Dysregulated. Cells. 2019;8:693. - PMC - PubMed
    1. Kanno H, Ozawa H, Sekiguchi A, Itoi E. The role of autophagy in spinal cord injury. Autophagy. 2009;5:390–2. - PubMed
    1. Liu S, Sarkar C, Dinizo M, Faden AI, Koh EY, Lipinski MM. et al. Disrupted autophagy after spinal cord injury is associated with ER stress and neuronal cell death. Cell Death Dis. 2015;6:e1582. - PMC - PubMed
    1. Liu S, Li Y, Choi HMC, Sarkar C, Koh EY, Wu J. et al. Lysosomal damage after spinal cord injury causes accumulation of RIPK1 and RIPK3 proteins and potentiation of necroptosis. Cell Death Dis. 2018;9:476. - PMC - PubMed
    1. Li Y, Jones JW, H MCC, Sarkar C, Kane MA, Koh EY. et al. cPLA2 activation contributes to lysosomal defects leading to impairment of autophagy after spinal cord injury. Cell Death Dis. 2019;10:531. - PMC - PubMed

Publication types