

Raman spectroscopy reveals phenotype switches in breast cancer metastasis
- PMID: 35910801
- PMCID: PMC9330538
- DOI: 10.7150/thno.74002
Raman spectroscopy reveals phenotype switches in breast cancer metastasis
Abstract
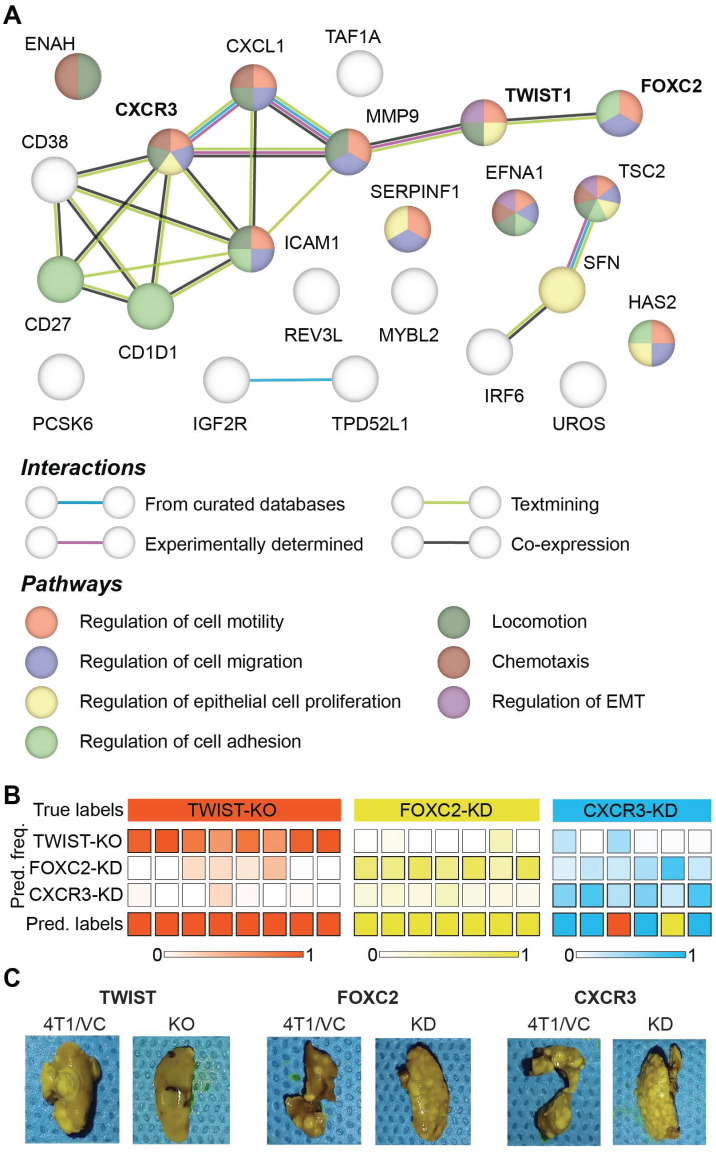
The accurate analytical characterization of metastatic phenotype at primary tumor diagnosis and its evolution with time are critical for controlling metastatic progression of cancer. Here, we report a label-free optical strategy using Raman spectroscopy and machine learning to identify distinct metastatic phenotypes observed in tumors formed by isogenic murine breast cancer cell lines of progressively increasing metastatic propensities. Methods: We employed the 4T1 isogenic panel of murine breast cancer cells to grow tumors of varying metastatic potential and acquired label-free spectra using a fiber probe-based portable Raman spectroscopy system. We used MCR-ALS and random forests classifiers to identify putative spectral markers and predict metastatic phenotype of tumors based on their optical spectra. We also used tumors derived from 4T1 cells silenced for the expression of TWIST, FOXC2 and CXCR3 genes to assess their metastatic phenotype based on their Raman spectra. Results: The MCR-ALS spectral decomposition showed consistent differences in the contribution of components that resembled collagen and lipids between the non-metastatic 67NR tumors and the metastatic tumors formed by FARN, 4T07, and 4T1 cells. Our Raman spectra-based random forest analysis provided evidence that machine learning models built on spectral data can allow the accurate identification of metastatic phenotype of independent test tumors. By silencing genes critical for metastasis in highly metastatic cell lines, we showed that the random forest classifiers provided predictions consistent with the observed phenotypic switch of the resultant tumors towards lower metastatic potential. Furthermore, the spectral assessment of lipid and collagen content of these tumors was consistent with the observed phenotypic switch. Conclusion: Overall, our findings indicate that Raman spectroscopy may offer a novel strategy to evaluate metastatic risk during primary tumor biopsies in clinical patients.
Keywords: Cancer metastasis; Phenotype switch; Raman spectroscopy; Random forests; TWIST.
© The author(s).
Conflict of interest statement
Competing Interests: The authors have declared that no competing interest exists.
Figures


Similar articles
-
Coarse Raman and optical diffraction tomographic imaging enable label-free phenotyping of isogenic breast cancer cells of varying metastatic potential.Biosens Bioelectron. 2021 Mar 1;175:112863. doi: 10.1016/j.bios.2020.112863. Epub 2020 Nov 27. Biosens Bioelectron. 2021. PMID: 33272866 Free PMC article.
-
Label-free discrimination analysis of breast cancer tumor and adjacent tissues of patients after neoadjuvant treatment using Raman spectroscopy: a diagnostic study.Int J Surg. 2025 Feb 1;111(2):1788-1800. doi: 10.1097/JS9.0000000000002201. Int J Surg. 2025. PMID: 39715100
-
Metabolic plasticity of metastatic breast cancer cells: adaptation to changes in the microenvironment.Neoplasia. 2015 Aug;17(8):671-84. doi: 10.1016/j.neo.2015.08.005. Neoplasia. 2015. PMID: 26408259 Free PMC article.
-
Organ-specific isogenic metastatic breast cancer cell lines exhibit distinct Raman spectral signatures and metabolomes.Oncotarget. 2017 Mar 21;8(12):20266-20287. doi: 10.18632/oncotarget.14865. Oncotarget. 2017. PMID: 28145887 Free PMC article.
-
Advances in the in Vivo Raman Spectroscopy of Malignant Skin Tumors Using Portable Instrumentation.Int J Mol Sci. 2015 Jun 26;16(7):14554-70. doi: 10.3390/ijms160714554. Int J Mol Sci. 2015. PMID: 26132563 Free PMC article. Review.
Cited by
-
In Depth Mapping of Mesoporous Silica Nanoparticles in Malignant Glioma Cells Using Scattering-Type Scanning Near-Field Optical Microscopy.Chem Biomed Imaging. 2024 Oct 19;2(12):842-849. doi: 10.1021/cbmi.4c00053. eCollection 2024 Dec 23. Chem Biomed Imaging. 2024. PMID: 39735833 Free PMC article.
-
RaMALDI: Enabling simultaneous Raman and MALDI imaging of the same tissue section.Biosens Bioelectron. 2023 Nov 1;239:115597. doi: 10.1016/j.bios.2023.115597. Epub 2023 Aug 12. Biosens Bioelectron. 2023. PMID: 37597501 Free PMC article.
-
An engineered niche delineates metastatic potential of breast cancer.Bioeng Transl Med. 2023 Sep 29;9(1):e10606. doi: 10.1002/btm2.10606. eCollection 2024 Jan. Bioeng Transl Med. 2023. PMID: 38193115 Free PMC article.
-
Clinical study of the diagnosis of thyroid tumours using Raman spectroscopy.Braz J Otorhinolaryngol. 2025 May-Jun;91(3):101568. doi: 10.1016/j.bjorl.2025.101568. Epub 2025 Feb 28. Braz J Otorhinolaryngol. 2025. PMID: 40022834 Free PMC article.
-
Raman analysis of lipids in cells: Current applications and future prospects.J Pharm Anal. 2025 Apr;15(4):101136. doi: 10.1016/j.jpha.2024.101136. Epub 2024 Nov 1. J Pharm Anal. 2025. PMID: 40242217 Free PMC article. Review.
References
-
- Peinado H, Zhang H, Matei IR, Costa-Silva B, Hoshino A, Rodrigues G. et al. Pre-metastatic niches: organ-specific homes for metastases. Nat Rev Cancer. 2017;17(5):302–317. - PubMed
-
- Wu CY, Du SL, Zhang J, Liang AL, Liu YJ. Exosomes and breast cancer: a comprehensive review of novel therapeutic strategies from diagnosis to treatment. Cancer Gene Ther. 2017;24(1):6–12. - PubMed
-
- Houthuijzen JM, Jonkers J. Cancer-associated fibroblasts as key regulators of the breast cancer tumor microenvironment. Cancer Metastasis Rev. 2018;37(4):577–597. - PubMed
-
- Mohan V, Das A, Sagi I. Emerging roles of ECM remodeling processes in cancer. Semin Cancer Biol. 2020;62:192–200. - PubMed
Publication types
MeSH terms
Grants and funding
LinkOut - more resources
Full Text Sources
Research Materials
Miscellaneous
