

Effects and Interaction of Meteorological Factors on Pulmonary Tuberculosis in Urumqi, China, 2013-2019
- PMID: 35910866
- PMCID: PMC9330012
- DOI: 10.3389/fpubh.2022.951578
Effects and Interaction of Meteorological Factors on Pulmonary Tuberculosis in Urumqi, China, 2013-2019
Abstract
Background: Most existing studies have only investigated the delayed effect of meteorological factors on pulmonary tuberculosis (PTB). However, the effect of extreme climate and the interaction between meteorological factors on PTB has been rarely investigated.
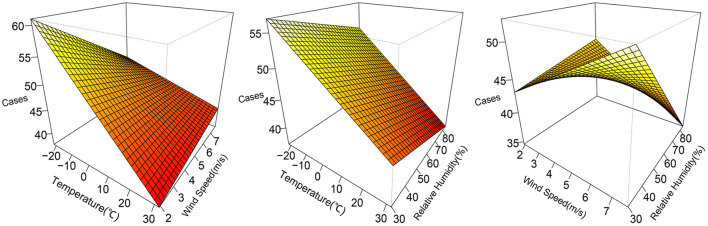
Methods: Newly diagonsed PTB cases and meteorological factors in Urumqi in each week between 2013 and 2019 were collected. The lag-exposure-response relationship between meteorological factors and PTB was analyzed using the distributed lag non-linear model (DLNM). The generalized additive model (GAM) was used to visualize the interaction between meteorological factors. Stratified analysis was used to explore the impact of meteorological factors on PTB in different stratification and RERI, AP and SI were used to quantitatively evaluate the interaction between meteorological factors.
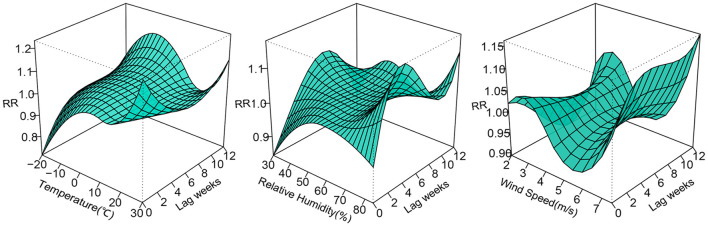
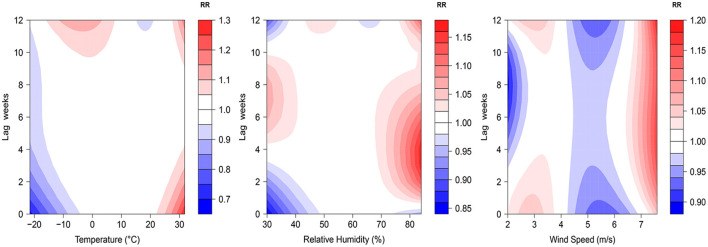
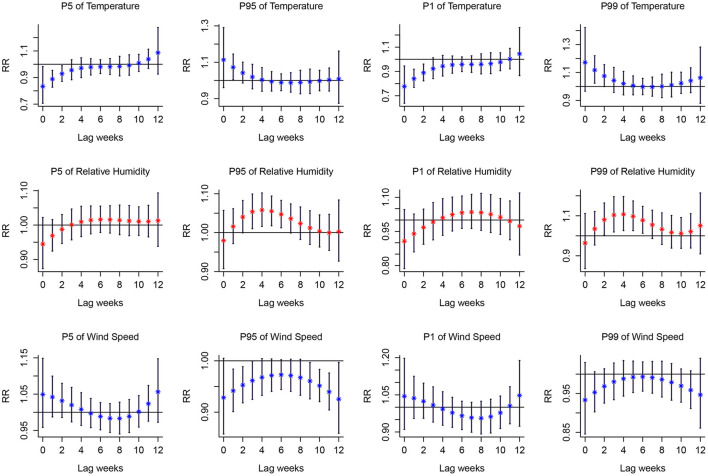
Results: A total of 16,793 newly diagnosed PTB cases were documented in Urumqi, China from 2013 to 2019. The median (interquartile range) temperature, relative humidity, wind speed, and PTB cases were measured as 11.3°C (-5.0-20.5), 57.7% (50.7-64.2), 4.1m/s (3.4-4.7), and 47 (37-56), respectively. The effects of temperature, relative humidity and wind speed on PTB were non-linear, which were found with the "N"-shaped, "L"-shaped, "N"-shaped distribution, respectively. With the median meteorological factor as a reference, extreme low temperature was found to have a protective effect on PTB. However, extreme high temperature, extreme high relative humidity, and extreme high wind speed were found to increase the risk of PTB and peaked at 31.8°C, 83.2%, and 7.6 m/s respectively. According to the existing monitoring data, no obvious interaction between meteorological factors was found, but low temperature and low humidity (RR = 1.149, 95%CI: 1.003-1.315), low temperature and low wind speed (RR = 1.273, 95%CI: 1.146-1.415) were more likely to cause the high incidence of PTB.
Conclusion: Temperature, relative humidity and wind speed were found to play vital roles in PTB incidence with delayed and non-linear effects. Extreme high temperature, extreme high relative humidity, and extreme high wind speed could increase the risk of PTB. Moreover, low temperature and low humidity, low temperature and low wind speed may increase the incidence of PTB.
Keywords: distributed lag non-linear model (DLNM); interaction; meteorological; pulmonary tuberculosis (PTB); seasonally.
Copyright © 2022 Nie, Lu, Wang, Yang, Sun, Zhang, Tian, Rifhat and Zhang.
Conflict of interest statement
The authors declare that the research was conducted in the absence of any commercial or financial relationships that could be construed as a potential conflict of interest.
Figures

Similar articles
-
Meteorological factors contribute to the risk of pulmonary tuberculosis: A multicenter study in eastern China.Sci Total Environ. 2021 Nov 1;793:148621. doi: 10.1016/j.scitotenv.2021.148621. Epub 2021 Jun 24. Sci Total Environ. 2021. PMID: 34328976
-
Interaction between air pollutants and meteorological factors on pulmonary tuberculosis in northwest China: A case study of eight districts in Urumqi.Int J Biometeorol. 2024 Apr;68(4):691-700. doi: 10.1007/s00484-023-02615-z. Epub 2024 Jan 6. Int J Biometeorol. 2024. PMID: 38182774
-
Short-term effects of extreme meteorological factors on childhood hand, foot, and mouth disease reinfection in Hefei, China: A distributed lag non-linear analysis.Sci Total Environ. 2019 Feb 25;653:839-848. doi: 10.1016/j.scitotenv.2018.10.349. Epub 2018 Oct 28. Sci Total Environ. 2019. PMID: 30759610
-
Association of sudden sensorineural hearing loss with meteorological factors: a time series study in Hefei, China, and a literature review.Environ Sci Pollut Res Int. 2024 Jun;31(30):42970-42990. doi: 10.1007/s11356-024-33943-1. Epub 2024 Jun 17. Environ Sci Pollut Res Int. 2024. PMID: 38886269 Free PMC article. Review.
-
Association of Short-Term Exposure to Meteorological Factors and Risk of Hand, Foot, and Mouth Disease: A Systematic Review and Meta-Analysis.Int J Environ Res Public Health. 2020 Oct 30;17(21):8017. doi: 10.3390/ijerph17218017. Int J Environ Res Public Health. 2020. PMID: 33143315 Free PMC article.
Cited by
-
Effects of the interaction between cold spells and fine particulate matter on mortality risk in Xining: a case-crossover study at high altitude.Front Public Health. 2024 May 15;12:1414945. doi: 10.3389/fpubh.2024.1414945. eCollection 2024. Front Public Health. 2024. PMID: 38813422 Free PMC article.
-
Association Between Climatic Factors and Varicella Incidence in Wuxi, East China, 2010-2019: Surveillance Study.JMIR Public Health Surveill. 2024 Oct 2;10:e62863. doi: 10.2196/62863. JMIR Public Health Surveill. 2024. PMID: 39228304 Free PMC article.
-
Epidemiological Characteristics and Spatial-Temporal Analysis of Tuberculosis at the County-Level in Shandong Province, China, 2016-2020.Trop Med Infect Dis. 2022 Nov 1;7(11):346. doi: 10.3390/tropicalmed7110346. Trop Med Infect Dis. 2022. PMID: 36355888 Free PMC article.
-
Assessing the 1918/19 Pandemic Influenza and Respiratory Tuberculosis Interaction in Malta: Operationalizing a Syndemic During a Crisis Event.Trop Med Infect Dis. 2025 May 24;10(6):149. doi: 10.3390/tropicalmed10060149. Trop Med Infect Dis. 2025. PMID: 40559716 Free PMC article.
-
Ecological-level factors associated with tuberculosis incidence and mortality: A systematic review and meta-analysis.PLOS Glob Public Health. 2024 Oct 15;4(10):e0003425. doi: 10.1371/journal.pgph.0003425. eCollection 2024. PLOS Glob Public Health. 2024. PMID: 39405319 Free PMC article.
References
-
- WHO . Global tuberculosis report 2021. Geneva, World Health Organization (2021).
-
- Abudula Z, Xinqi W, Zhen Z, Le W, Senlu W, Nianqiang L, et al. . Epidemiological characteristics of pulmonary tuberculosis in Xinjiang, 2015–2019. Dis Surveil. (2021) 36:1138–41.1
Publication types
MeSH terms
LinkOut - more resources
Full Text Sources