. 2022 Jul 27;9(7):220275.
doi: 10.1098/rsos.220275. eCollection 2022 Jul.

Volcanic hazard exacerbated by future global warming-driven increase in heavy rainfall

Affiliations

Volcanic hazard exacerbated by future global warming-driven increase in heavy rainfall

Jamie I Farquharson et al. R Soc Open Sci. .

Abstract

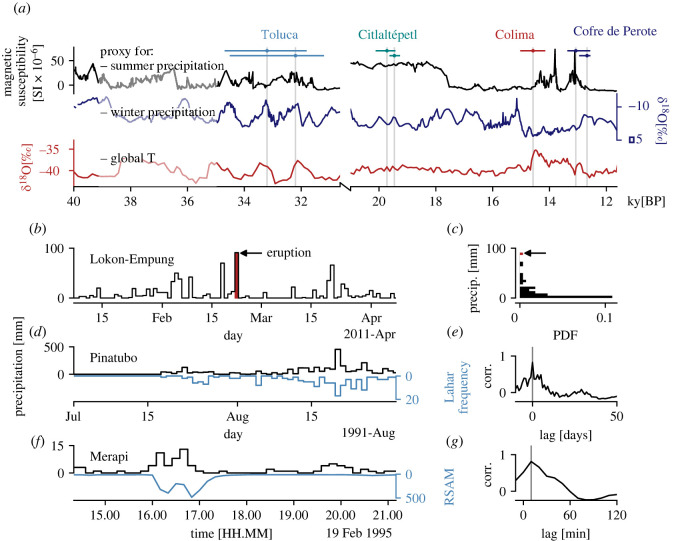
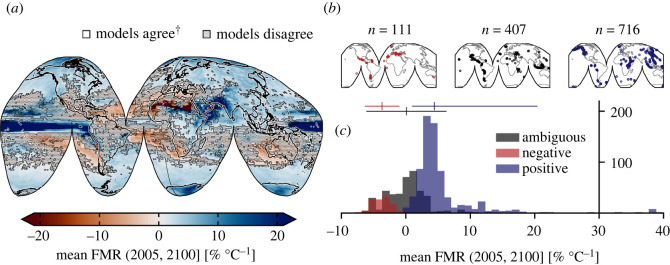
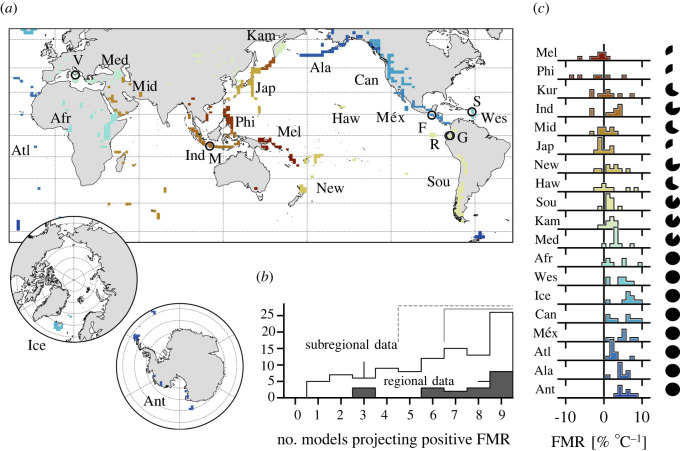
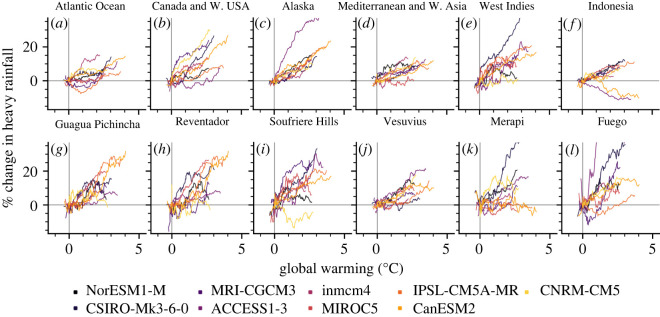
Heavy rainfall drives a range of eruptive and non-eruptive volcanic hazards. Over the Holocene, the incidence of many such hazards has increased due to rapid climate change. Here, we show that extreme heavy rainfall is projected to increase with continued global warming throughout the twenty-first century in most subaerial volcanic regions, increasing the potential for rainfall-induced volcanic hazards. This result is based on a comparative analysis of nine general circulation models, and is prevalent across a wide range of spatial scales, from countries and volcanic arcs down to individual volcanic systems. Our results suggest that if global warming continues unchecked, the incidence of primary and secondary rainfall-related volcanic activity-such as dome explosions or flank collapse-will increase at more than 700 volcanoes around the globe. Improved coupling between scientific observations-in particular, of local and regional precipitation-and policy decisions may go some way towards mitigating the increased risk throughout the next 80 years.

Keywords: climate change; climate forcing; general circulation model; geosphere–hydrosphere interaction; precipitation; volcanism.


Conflict of interest statement

We have no competing interests.

Figures

Figure 1.
Figure 1.
Extreme rainfall as a driver of volcanic hazards. (a) Pleistocene volcanic sector collapses of Volcán de Colima, Nevado de Toluca, Citlaltépetl and Cofre de Perote (Mexico), reproduced after Capra et al. [39]. Climate proxy data are described in the Material and methods. For each of the seven collapses, horizontal date ranges are indicated, as well as a vertical line highlighting the maximum probability collapse date. Note discontinuous x-axis. (b) The February 2011 eruption of Lokon-Empung is shown by a vertical line, alongside time series of local precipitation data. (c) Log-normal distribution of precipitation data from (b), with outlying value (corresponding to date of eruption) indicated. (d) Daily precipitation data (black) is plotted against the number of lahars per day (blue) observed at Pinatubo between July and September 1991. (e) Result of cross-correlation analysis of Pinatubo data shown in (d), shown as correlation coefficient (corr.) between daily precipitation and lahar frequency versus lag. (f) Precipitation in ten-minute bins at Merapi volcano, alongside the RSAM value at the same temporal resolution. RSAM maxima reflect peak lahar surges. (g) Result of cross-correlation analysis of Merapi data shown in (f), shown as correlation coefficient between ten-minute precipitation and RSAM value versus lag. Refer to Material and methods for all data sources.
Figure 2.
Figure 2.
Breakdown of mean forced model response. (a) Global mean forced model response (FMR) calculated from all models. Shaded area indicates those regions where fewer than seven of nine models agreed on the sign of change (26.55%). At least seven of nine models agree on the sign of change. (b) Subaerial volcano geolocations separated according to whether models agree on a decrease in heavy precipitation with increased warming (red: ‘negative’; n = 111); the precipitation response is ambiguous due to lack of model agreement (black: ‘ambiguous’; n = 407); models agree on an increase in heavy precipitation with increased warming (blue: ‘positive’; n = 716). n indicates the number of discrete Holocene-active volcanic systems in each category. (c) Histogram of mean FMR for each group of volcanoes (as in (b)). Mean and two standard deviation range are indicated by the vertical and horizontal lines, respectively (Material and methods).
Figure 3.
Figure 3.
Regional and sub regional spatial averages. (a) Map indicating the non-contiguous spatial extent over which regional data are averaged. Circle markers indicate individual volcanoes shown in figure 4. V, Vesuvius; M, Merapi; F, Fuego; R, Reventador; G, Guagua Pichincha; S, Soufrière Hills Volcano. [Inset] polar regions. Regions are represented by discrete coloured rectilinear polygons. Ant, Antarctica; Atl, Atlantic Ocean; Sou, South America; Ala, Alaska; Kur, Kuril Islands; Ind, Indonesia; Mid, Middle East and Indian Ocean; Phi, Philippines and SE Asia; Méx, México and Central America; Jap, Japan, Taiwan and Marianas; Kam, Kamchatka and Mainland Asia; Med, Mediterranean and Western Asia; New, New Zealand to Fiji; Haw, Hawai`i and Pacific Ocean; Ice, Iceland and Arctic Ocean; Afr, Africa and Red Sea; Wes, West Indies; Mel, Melanesia and Australia; Can, Canada and Western USA. (b) Bar chart of the number of regions and subregions where x number of models project a spatially averaged forced model response (FMR) > 0 (i.e. a concomitant increase in heavy precipitation and global mean temperature). Dashed bracket indicates the majority of models, solid bracket indicates seven or more out of nine models. (c) Inter-model distributions of calculated FMR for each region. Marginal pie charts indicate the proportion of models that project a positive FMR per region (out of maximum of nine).
Figure 4.
Figure 4.
Forced model responses at different spatial scales. (a–f) Per cent change in modelled heavy rainfall per degree of global warming. Data are shown as a 30-year rolling mean, normalized to January 2021. Data are areal averages (figure 3 for areal extent of each region). (g–l) As (a–f), for individual volcanic systems. Data correspond to the bounding pixel for each model (see Material and methods). Volcano locations are shown in figure 3.

Similar articles

References

    1. Brönnimann S, et al. . 2019. Last phase of the Little Ice Age forced by volcanic eruptions. Nat. Geosci. 12, 650-656. (10.1038/s41561-019-0402-y) - DOI
    1. Robock A. 2000. Volcanic eruptions and climate. Rev. Geophys. 38, 191-219. (10.1029/1998RG000054) - DOI
    1. Hyde WT, Crowley TJ. 2000. Probability of future climatically significant volcanic eruptions. J. Clim. 13, 1445-1450. (10.1175/1520-0442(2000)013<1445:LOFCSV>2.0.CO;2) - DOI
    1. Bethke I, Outten S, Otterå OH, Hawkins E, Wagner S, Sigl M, Thorne P. 2017. Potential volcanic impacts on future climate variability. Nat. Clim. Change 7, 799-805. (10.1038/nclimate3394) - DOI
    1. Aubry TJ, et al. . 2022. Impact of climate change on volcanic processes: current understanding and future challenges. Bull. Volcanol. 84, 58. (10.1007/s00445-022-01562-8) - DOI

LinkOut - more resources