. 2022 Jul 15:9:928516.
doi: 10.3389/fmed.2022.928516. eCollection 2022.

Urinary CD8+HLA-DR+ T Cell Abundance Non-invasively Predicts Kidney Transplant Rejection

Affiliations

Urinary CD8+HLA-DR+ T Cell Abundance Non-invasively Predicts Kidney Transplant Rejection

Emil Grothgar et al. Front Med (Lausanne). .

Abstract

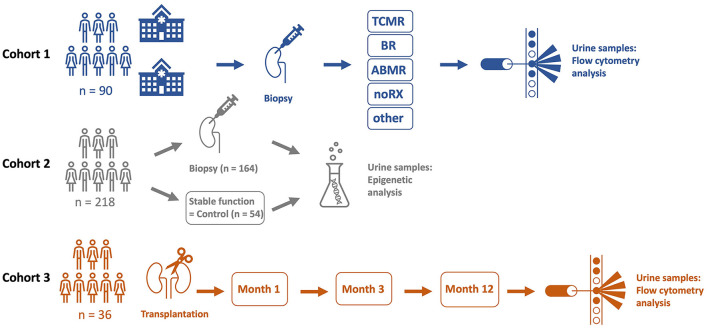
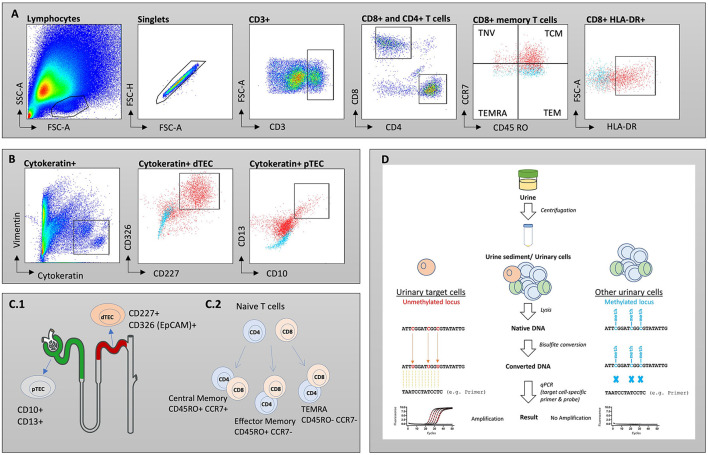
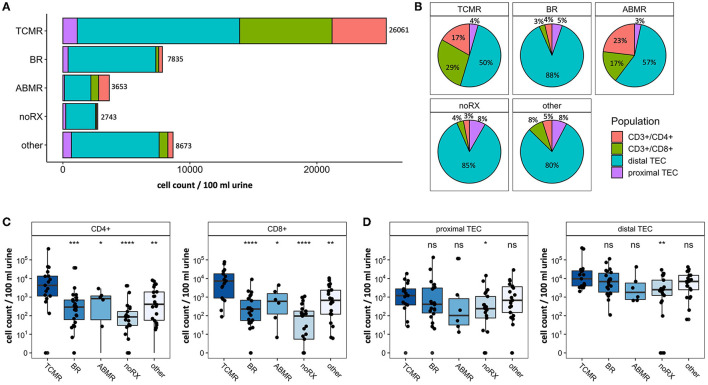
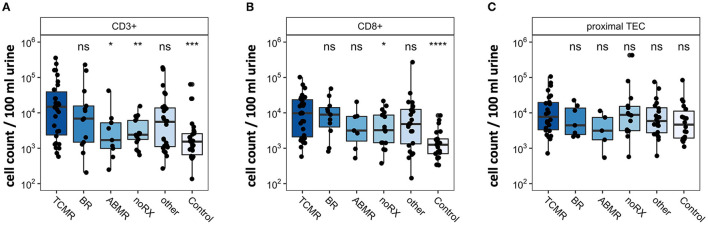
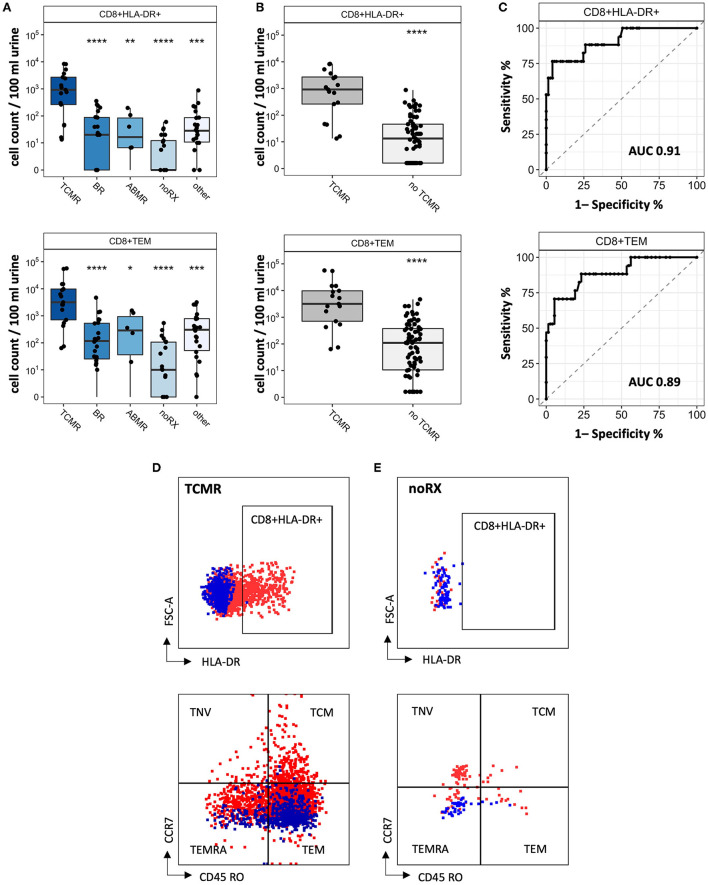
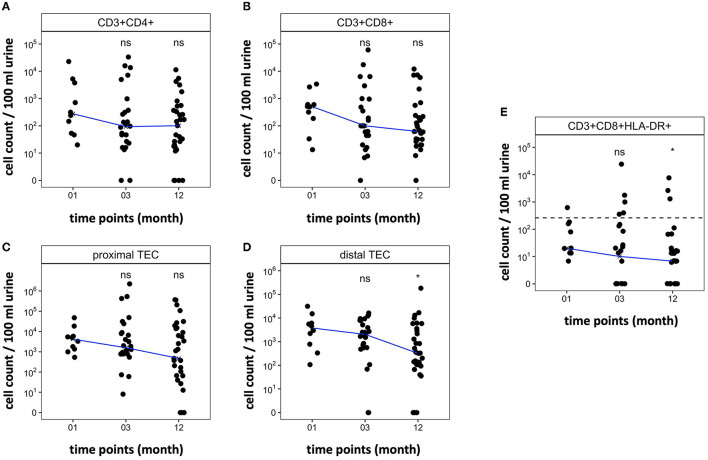
Early detection of kidney transplant (KT) rejection remains a challenge in patient care. Non-invasive biomarkers hold high potential to detect rejection, adjust immunosuppression, and monitor KT patients. So far, no approach has fully satisfied requirements to innovate routine monitoring of KT patients. In this two-center study we analyzed a total of 380 urine samples. T cells and tubular epithelial cells were quantified in KT patients with graft deterioration using flow cytometry. Epigenetic urine cell quantification was used to confirm flow cytometric results. Moreover, a cohort of KT patients was followed up during the first year after transplantation, tracking cell subsets over time. Abundance of urinary cell counts differed in patients with and without rejection. Most strikingly, various T cell subsets were enriched in patients with T cell-mediated rejection (TCMR) compared to patients without TCMR. Among T cell subsets, CD8+HLA-DR+ T cells were most distinctive (AUC = 0.91, Spec.: 95.9%, Sens.: 76.5%). Epigenetic analysis confirmed T cell and tubular epithelial cell quantities as determined by flow cytometry. Urinary T cell abundance in new KT patients decreased during their first year after transplantation. In conclusion urinary T cells reflect intrarenal inflammation in TCMR. T cell subsets yield high potential to monitor KT patients and detect rejection. Hereby we present a promising biomarker to non-invasively diagnose TCMR.

Keywords: CD8+HLA-DR+; T cell; allograft acute rejection; biomarker; kidney; transplantation; tubular epithelial cell; urine.


Conflict of interest statement

BS and SO are employed by Precision for Medicine GmbH. The remaining authors declare that the research was conducted in the absence of any commercial or financial relationships that could be construed as a potential conflict of interest.

Figures

Figure 1
Figure 1
A total of three different cohorts were analyzed in this trial. Cohort 1 included 90 kidney transplant (KT) patients from two hospitals (Charité University Hospital, Berlin, Germany and Carl Gustav Carus University Hospital, Dresden, Germany) who underwent kidney biopsy due to graft deterioration. Patients were categorized by histopathological diagnosis and urine samples were analyzed by flow cytometry. In cohort 2, urine samples of 218 KT patients were subject to epigenetic qPCR analysis. 164 patients of cohort 2 underwent kidney biopsy because of graft deterioration, 54 stable KT patients served as a control group. Cohort 3 included 36 KT patients. Urine samples were analyzed on three scheduled visits by flow cytometry in a follow-up setting during the first year after transplantation.
Figure 2
Figure 2
Gating strategies for T cell subsets (A) and tubular epithelial cells (TEC) (B). Isotype controls are displayed as blue, while full stains are represented in red. (C.1) Schematic overview of investigated subsets. Proximal TECs were defined CD10+ and CD13+, while distal TECs were characterized being CD227+ and CD326(EpCAM)+. (C.2) Maturation of naïve T cells into memory T cells. (D) Workflow for epigenetic analysis of urine samples. SSC, side scatter; FSC, forward scatter; TNV, naïve T cells; TEM, T effector memory cells; TCM, T central memory cells; TEMRA, T effector memory cells re-expressing CD45RA.
Figure 3
Figure 3
Absolute cell counts recorded by flow cytometry in patients undergoing renal biopsy due to graft deterioration. Patients are subdivided into five groups based on histopathological results from biopsy. (A) Stack plot for population proportions. Each stack illustrates the mean absolute cell count per population in each group. (B) Pie charts representing composition of urinary cells (selected populations) per group. (C) CD4+ and CD8+ T cell counts per 100 ml urine shown for different biopsy groups. (D) Proximal and distal TEC counts per 100 ml urine shown for different biopsy groups. Significance levels indicate comparison with TCMR; ns, no significance; *p < 0.05; **p < 0.01; ***p < 0.001; ****p < 0.0001. TCMR, T cell-mediated rejection; BR, Borderline rejection; ABMR, antibody-mediated rejection; noRX, no rejection; other, other pathologies; TEC, tubular epithelial cell.
Figure 4
Figure 4
Epigenetic quantification of cell populations in patients with renal biopsy due to graft deterioration. Patients are subdivided into five groups based on histopathological results from biopsy. The sixth group, Control, includes transplant patients with stable graft function. Counts per 100 ml urine were analyzed in (A) CD3+ T cells, (B) CD8+T cells, and (C) proximal TEC. Significance levels indicate comparison with TCMR; ns, no significance; *p < 0.05; **p < 0.01; ***p < 0.001; ****p < 0.0001. TCMR, T cell-mediated rejection; BR, Borderline rejection; ABMR, antibody-mediated rejection; noRX, no rejection; other, other pathologies; TEC, tubular epithelial cell.
Figure 5
Figure 5
CD8+ T cell subsets as biomarker for detection of KT rejection. (A) Cell counts for CD8+HLA-DR+ and CD8+TEM per biopsy group. (B) Cell counts from patients with TCMR compared to all other patients (= no TCMR). (C) ROC curves to distinguish TCMR from no TCMR. Representative FC gating for CD8+HLA-DR+ and CD8+TEM in (D) TCMR patients and (E) noRX patients. Isotype controls are displayed as blue, while full stains are represented in red. Significance levels indicate comparison with TCMR; ns, no significance; *P < 0.05; **P < 0.01; ***P < 0.001; ****P < 0.0001. TCMR, T cell-mediated rejection; BR, Borderline rejection; ABMR, antibody-mediated rejection; noRX, no rejection; other, other pathologies; no TCMR, no T cell-mediated rejection; AUC, area under the curve; TNV, naïve T cells; TEM, T effector memory cells; TCM, T central memory cells; TEMRA, T effector memory cells re-expressing CD45RA.
Figure 6
Figure 6
Trajectory of cell counts in patients within the first year after kidney transplantation without rejection. Samples were collected 1, 3, and 12 months post-surgery. Median cell count per time point displayed as line. Cell abundance at different time points was compared. (A,B) CD4+ and CD8+ T cell counts decrease within the first year after transplantation. (C,D) Cell counts of TEC decrease during the first year after transplantation. (E) CD8+ HLA-DR+ T cell populations decrease during the first year after transplantation. Dashed line marks CD8+HLA-DR+ T cell cut-off at 262.5 CD8+HLA-DR+/100 ml urine that showed a sensitivity of 76.47% and specificity of 95.89% to diagnose TCMR in cohort 1. *P < 0.05, ns, no significance; TEC, tubular epithelial cell.

Similar articles

Cited by

References

    1. Lv JC, Zhang LX. Prevalence and disease burden of chronic kidney disease. Adv Exp Med Biol. (2019) 1165:3–15. 10.1007/978-981-13-8871-2_1 - DOI - PubMed
    1. Thurlow JS, Joshi M, Yan G, Norris KC, Agodoa LY, Yuan CM, et al. Global epidemiology of end-stage kidney disease and disparities in kidney replacement therapy. Am J Nephrol. (2021) 52:98–107. 10.1159/000514550 - DOI - PMC - PubMed
    1. Tonelli M, Wiebe N, Knoll G, Bello A, Browne S, Jadhav D, et al. Systematic review: kidney transplantation compared with dialysis in clinically relevant outcomes. Am J Transplant. (2011) 11:2093–109. 10.1111/j.1600-6143.2011.03686.x - DOI - PubMed
    1. Hart A, Smith JM, Skeans MA, Gustafson SK, Wilk AR, Castro S, et al. OPTN/SRTR 2018 annual data report: kidney. Am J Transplant. (2020) 20:20–130. 10.1111/ajt.15672 - DOI - PubMed
    1. COPE. Official Journal of the international Society of Nephrology KDIGO 2012 Clinical Practice Guideline for the Evaluation and Management of Chronic Kidney Disease. Available online at: www.publicationethics.org (accessed April 23, 2022).