Review
. 2022 Jul 6;2(7):1561-1587.
doi: 10.1021/jacsau.2c00309. eCollection 2022 Jul 25.

Synthesis and Application of Trehalose Materials

Affiliations
Review

Synthesis and Application of Trehalose Materials

Daniele Vinciguerra et al. JACS Au. .

Abstract

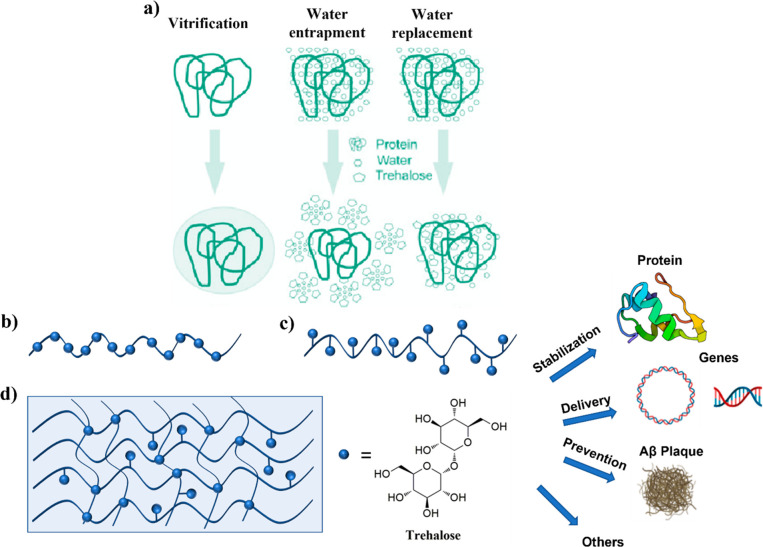
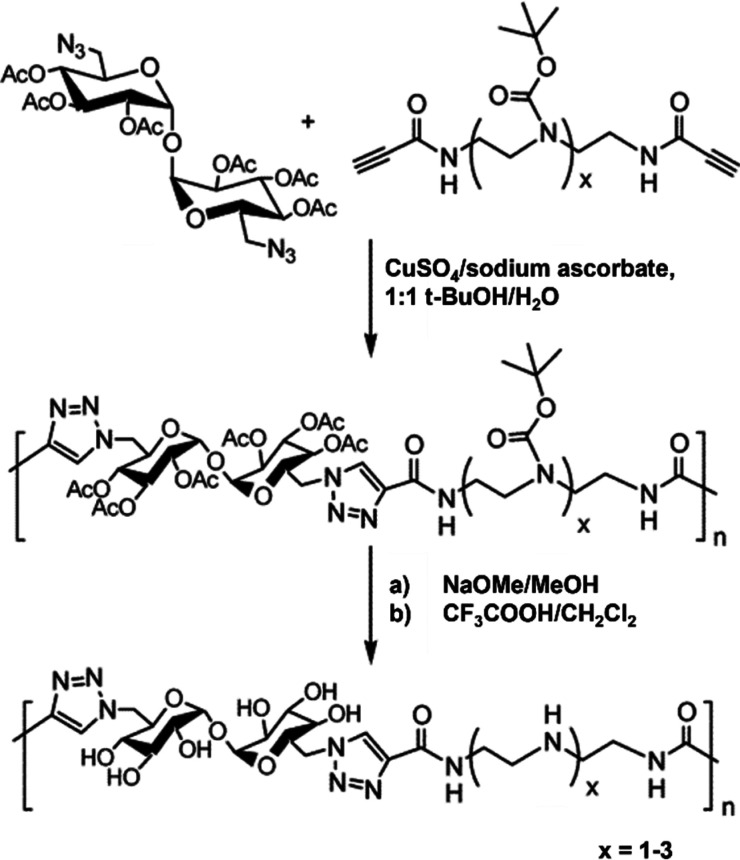
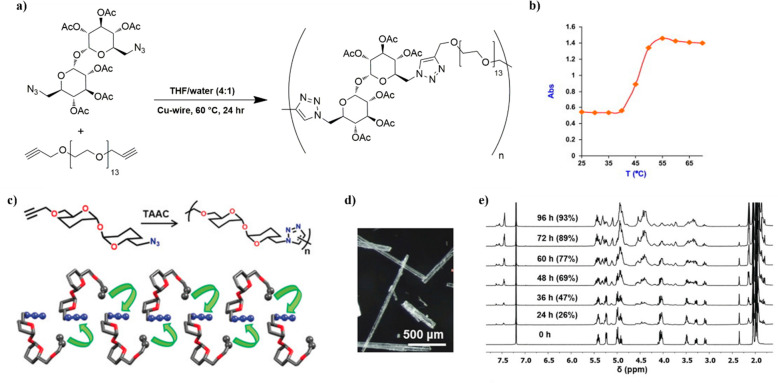
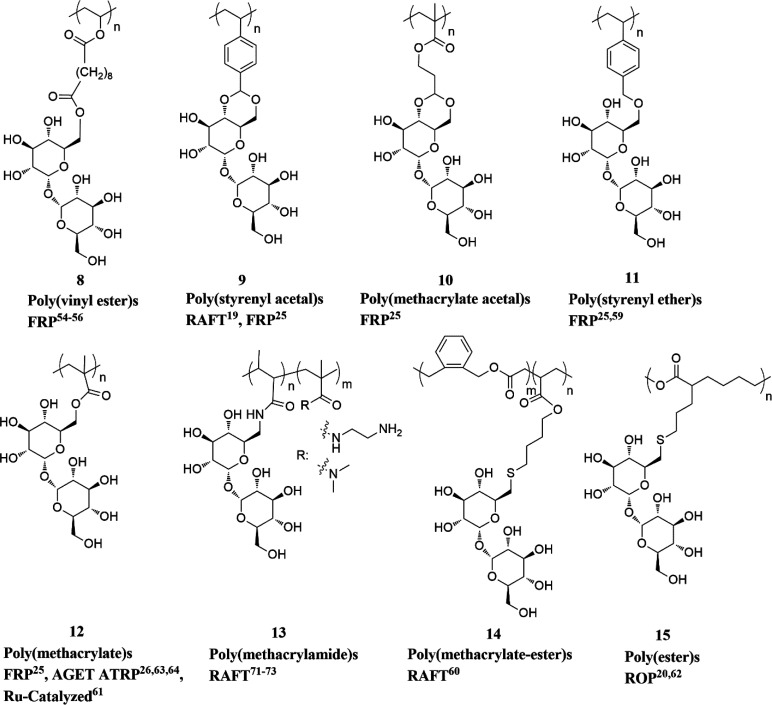
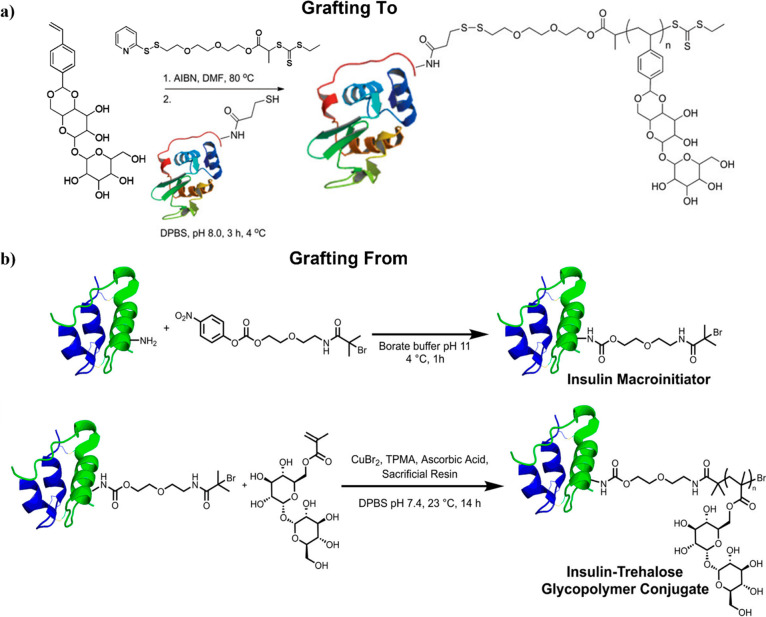
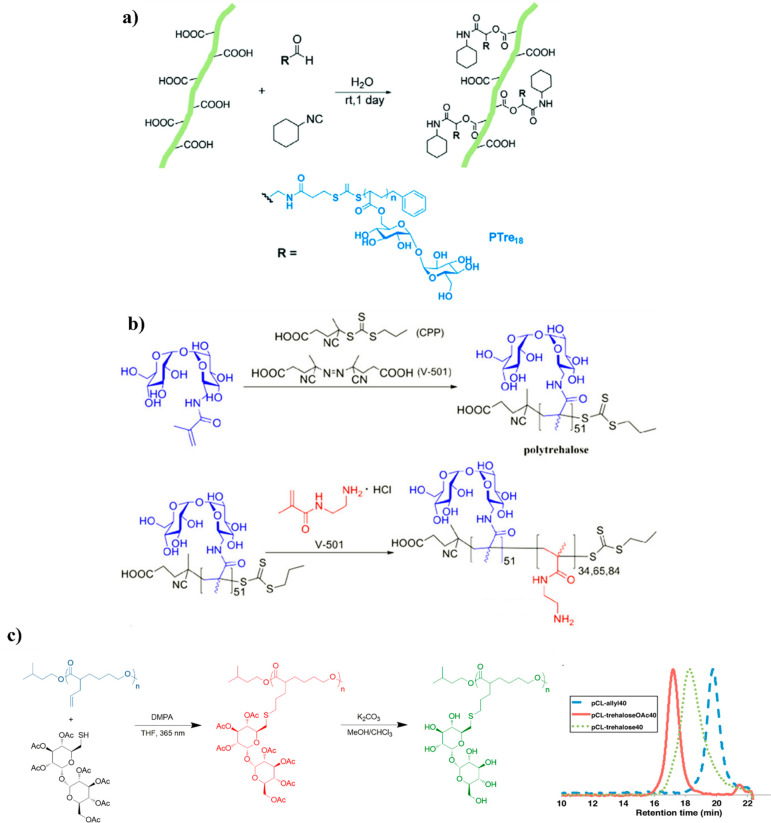
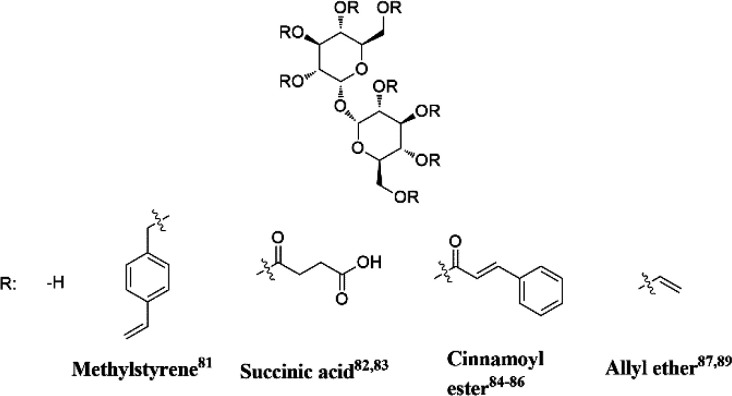
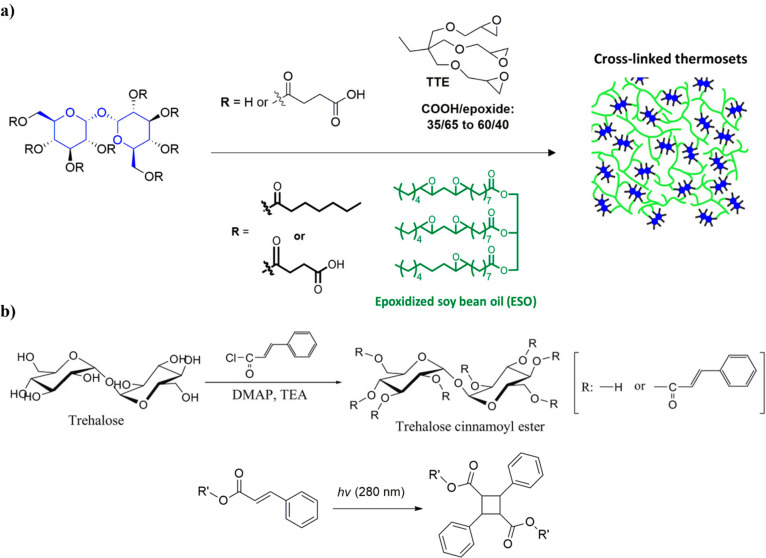
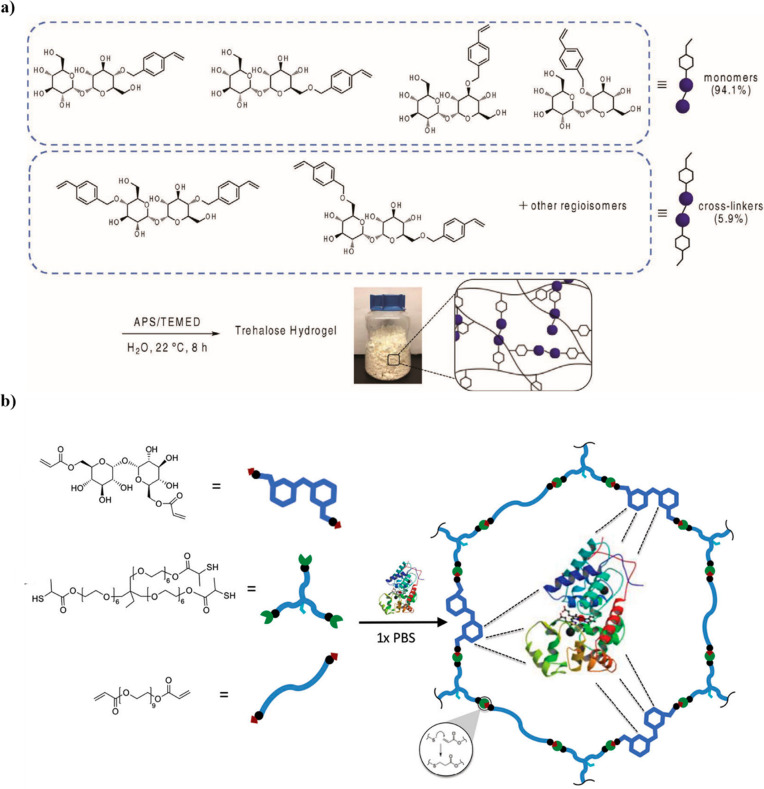
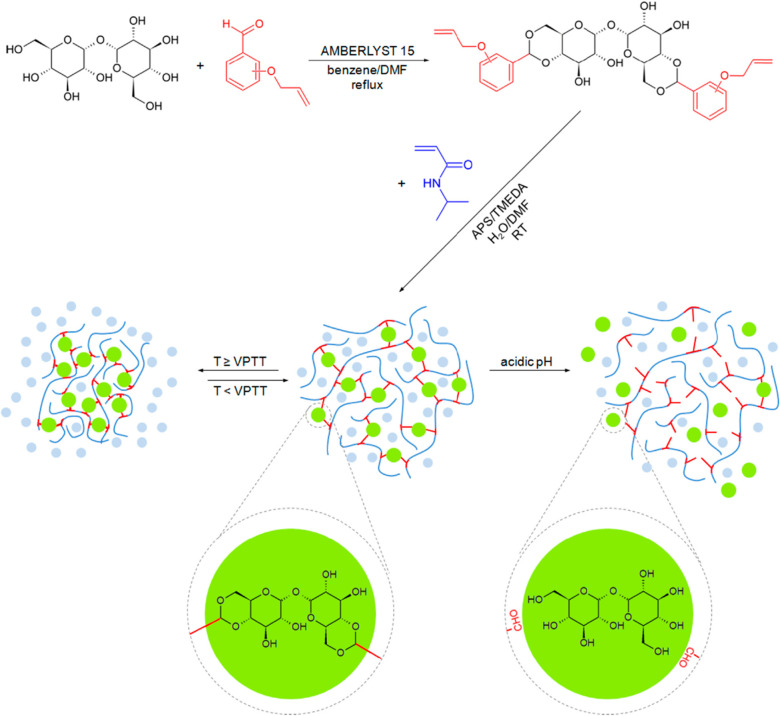
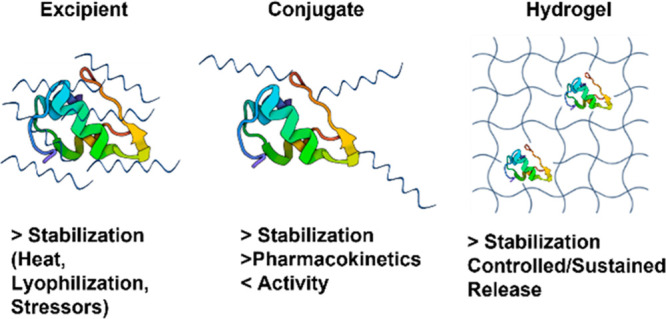
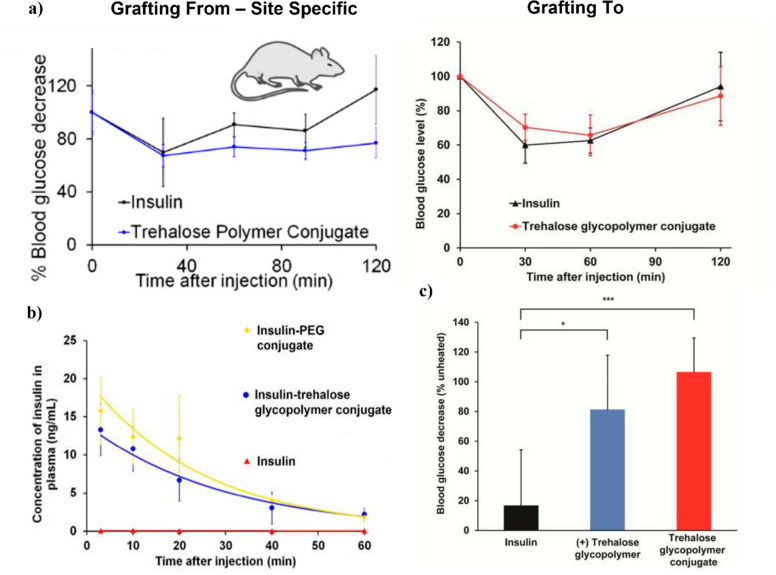
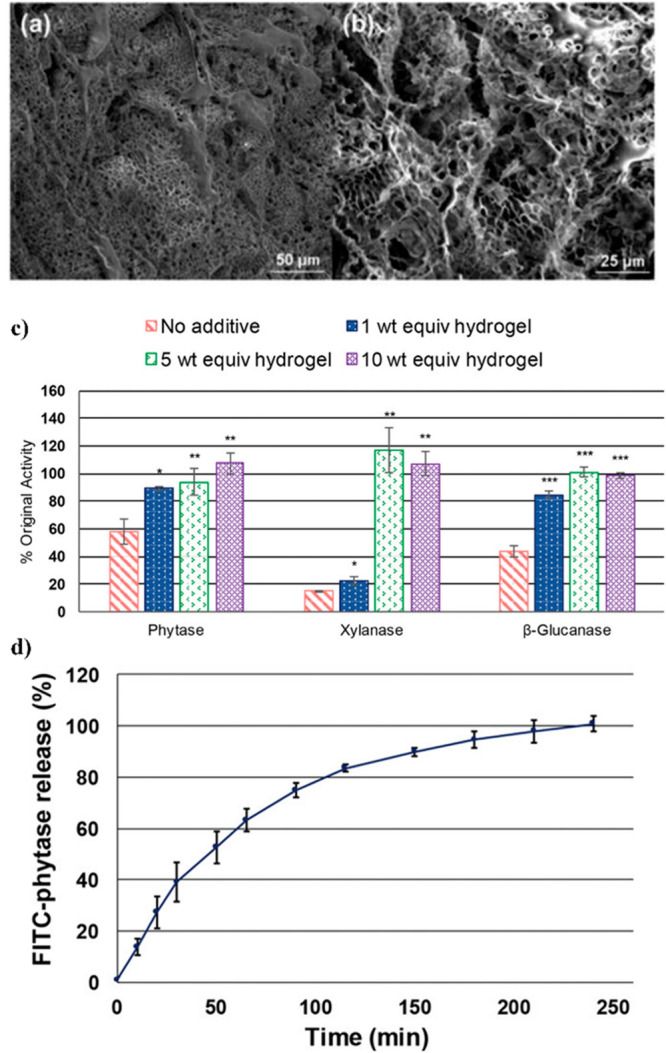
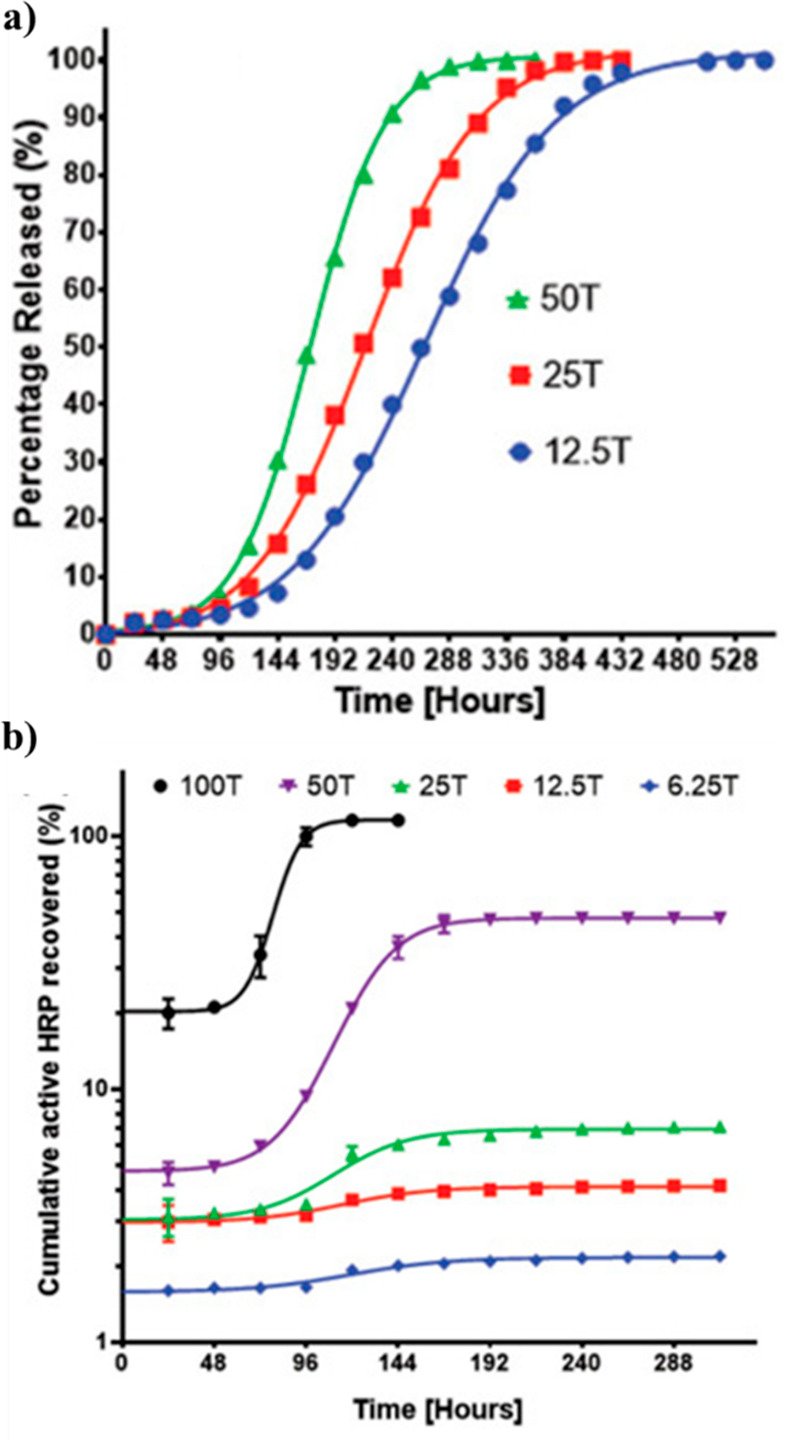
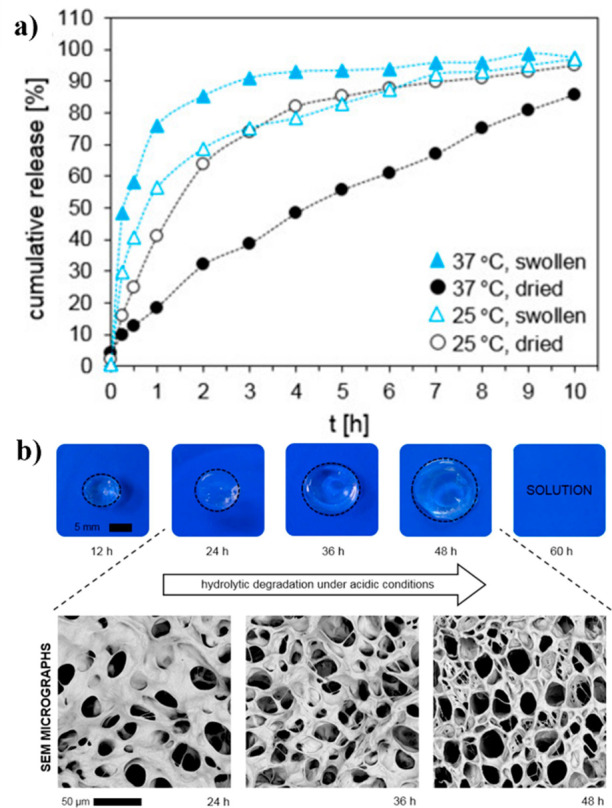
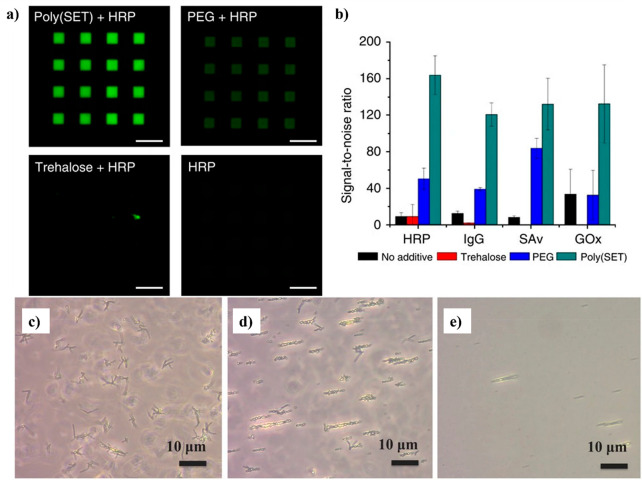
Trehalose is a naturally occurring, nonreducing disaccharide that is widely used in the biopharmaceutical, food, and cosmetic industries due to its stabilizing and cryoprotective properties. Over the years, scientists have developed methodologies to synthesize linear polymers with trehalose units either in the polymer backbone or as pendant groups. These macromolecules provide unique properties and characteristics, which often outperform trehalose itself. Additionally, numerous reports have focused on the synthesis and formulation of materials based on trehalose, such as nanoparticles, hydrogels, and thermoset networks. Among many applications, these polymers and materials have been used as protein stabilizers, as gene delivery systems, and to prevent amyloid aggregate formation. In this Perspective, recent developments in the synthesis and application of trehalose-based linear polymers, hydrogels, and nanomaterials are discussed, with a focus on utilization in the biomedical field.


Conflict of interest statement

The authors declare no competing financial interest.

Figures

Figure 1
Figure 1
Structures of trehalose and other common sugars.
Figure 2
Figure 2
Schematic representation of (a) trehalose proposed stabilization mechanisms. Adapted with permission from ref (4). Copyright 2009 Wiley. Schematic representation of (b) polymer with trehalose in the backbone, (c) polymer carrying trehalose in the side chains, and (d) thermoset or hydrogel network with trehalose as cross-linker or in the side chain and examples of their applications.
Figure 3
Figure 3
Representative selection of a (a) linear polymer with trehalose in the backbone, (b) linear polymer with trehalose on the side chain, and (c) hydrogel with trehalose as cross-linker.
Figure 4
Figure 4
Representative selection of polymers and reaction classes with trehalose in the backbone.
Figure 5
Figure 5
Schematic representation of click polymerization and polymer deprotection. Adapted from ref (42). Copyright 2006 American Chemical Society.
Figure 6
Figure 6
(a) Polymerization scheme to obtain a thermoresponsive trehalose-PEG copolymer by CuAAC, (b) cloud point measurements of an aqueous solution of trehalose-PEG copolymer. Adapted from ref (52) with permission. Copyright 2011 Elsevier. (c) Schematic representation of topochemical azide–alkyne cycloaddition (TAAC) of a trehalose-based monomer. (d) Photographs of the crystals obtained from ethyl acetate/n-hexane. (e) Time-dependent 1H NMR (CDCl3) showing a TAAC reaction in the crystals at 90 °C. Reprinted from ref (53) with permission. Copyright 2020 Wiley.
Figure 7
Figure 7
Representative selection of polymers and reaction classes with trehalose in the side chain.
Figure 8
Figure 8
Example of the synthesis of polymer–protein conjugates with trehalose in the side chains using (a) RAFT polymerization of styrenyl acetaltrehalose monomer and conjugation of lysozyme via a “grafting to” approach. Adapted from ref (19). Copyright 2012 American Chemical Society. (b) Insulin macroinitiator synthesis and AGET ATRP of trehalose methacrylate via a “grating from” approach. Adapted from ref (63). Copyright 2018 American Chemical Society.
Figure 9
Figure 9
Schematic illustration of (a) surface modification of CNFs with poly(trehalose acrylate) via Passerini reaction. Reproduced from ref (70) with permission from the Royal Society of Chemistry. (b) Synthesis of block copolymers via RAFT polymerization chain extension. Adapted from ref (71). Copyright 2013 American Chemical Society. (c) Synthetic scheme of thiol–ene postmodification of pCL-allyl polymers with acetyl-trehalose and deprotection with GPC characterization of each step. Adapted from ref (20). Copyright 2017 American Chemical Society.
Figure 10
Figure 10
Representative trehalose monomers with different DS for curing and preparation of thermoset resins.
Figure 11
Figure 11
Schematic illustration of (a) trehalose functionalized with succinic anhydride or/and heptanoyl chloride and epoxy resin thermoset synthesis by reaction with TTE or ESO. Adapted from refs (82) and (83). Copyright 2016 and 2018, respectively, American Chemical Society. (b) Synthesis of TCs and photodimerization of cinnamoyl groups. Adapted with permission from ref (84). Copyright 2015 SAGE Publications.
Figure 12
Figure 12
(a) Large scale trehalose hydrogel synthesis using styrenyl ether trehalose monomers and cross-linkers. Reproduced with permission from ref (24). Copyright 2019 Wiley. (b) Trehalose hydrogel for protein delivery prepared by thiol–ene reaction. Reproduced with permission from ref (98). Copyright 2015 Wiley.
Figure 13
Figure 13
Synthesis of acid-cleavable acetal trehalose hydrogels and their thermoresponsive behavior based on the volume phase transition temperature (VPTT). Reproduced with permission from ref (91). Copyright 2014 Elsevier.
Figure 14
Figure 14
Properties of trehalose polymers as excipients, conjugates, or hydrogels for protein stabilization.
Figure 15
Figure 15
(a) Trehalose polymers and activity of stabilized HRP incubated at 70 °C for 30 min. (b) Cytotoxicity assay of P1–P3 and 20 kDa PEG with cell lines: NIH 3T3, RAW 264.7, HDF, and HUVEC. Reproduced from ref (25). Copyright 2013 American Chemical Society.
Figure 16
Figure 16
Percentage of intact insulin stabilized with poly(trehalose methacrylate) (pTrMA) with different MWs and concentrations incubated at 37 °C for 3 h. Reproduced with permission from ref (26). Copyright 2021 Wiley.
Figure 17
Figure 17
(a) Blood glucose levels in fasted mice after i.v. injection with unmodified insulin, grafting from and grafting to an insulin trehalose polymer conjugate. (b) Pharmacokinetics study of insulin and polymer conjugates. (c) Activity of heated insulin, insulin with trehalose glycopolymer excipient (2 mol equiv), and insulin-trehalose polymer conjugate (90 °C, 30 min) relative to unheated samples during ITT in mice. Reproduced from refs (63) and (67). Copyright 2018 and 2017, respectively, American Chemical Society.
Figure 18
Figure 18
SEM images of trehalose hydrogel at (a) 500× magnification and (b) 1000× magnification. Reproduced from ref (65) with permission from the Royal Society of Chemistry. (c) Activity of phytase, xylanase, and β-glucanase loaded in trehalose hydrogels at various concentrations after incubation for 1 min at 90 °C. (d) Percent cumulative release of loaded fluorescein isothiocyanate (FITC)-labeled phytase from trehalose hydrogels. Reproduced with permission from ref (24). Copyright 2019 Wiley.
Figure 19
Figure 19
(a) Cumulative FITC-ovalbumin release profiles from various percentage compositions of trehalose within hydrogels. (b) Cumulative HRP recovery for hydrogels with various percentage compositions of trehalose. Time axis represent the amount of hours the loaded hydrogel was heated at 37 °C before HRP was recovered. Reproduced with permission from ref (98). Copyright 2015 Wiley.
Figure 20
Figure 20
(a) Release profiles of BSA into PBS medium (pH = 7.4) from swollen and dried hydrogels at 37 and 25 °C. (b) Physical and morphological (SEM) appearance of a hydrogel during ongoing hydrolytic degradation in PBS pH 5.0 at 37 °C. Reproduced with permission from refs (95) and (94). Copyright 2017 and 2019, respectively, Elsevier.
Figure 21
Figure 21
TEM images of glucagon nanogels in HEPES buffer at (a) day 7, (b) day 21, and (c) 3 days after TECP reduction. (d) Dose–response curves of glucagon nanogel before and after reduction, and PEG nanogel using Chem-1 cells expressing human glucagon receptor. Reproduced with permission from ref (58). Copyright 2018 Wiley.
Figure 22
Figure 22
(a) Schematic representation of Tr1–6 and polyplex formation after complexation with pDNA. (b) Luciferase reporter gene expression in DMEM containing 10% serum. (c) Fraction of cell survival in DMEM containing 10% serum. Adapted from ref (42). Copyright 2006 American Chemical Society. (d) Optimum luciferase gene expression RLU/mg (bars) and the fraction of cell survival at optimum gene expression (lines) with HeLa cells. Reproduced with permission from ref (43). Copyright 2007 Elsevier. (e) Manders coefficient for colocalization of polyplexes with clathrin and caveolae and colocalization of polyplexes with Rab 5 proteins at 4 h for Tr455 showing perinuclear localization of polyplexes. Reproduced from ref (47). Copyright 2013 American Chemical Society.
Figure 23
Figure 23
(a) Schematic representation of RAFT side chain trehalose-cation block copolymers. (b–e) TEM images of p(trehalose-b-cation) with increasing cation block MW (a,d: DP = 21; b,e: DP = 44), (b, d) fresh polyplexes and (c, e) after lyophilization and reconstitution. Scale bar: 100 nm. (f) Luciferase expression in U87 cells following transfection with lyophilized polyplexes (AEMA: cationic block; pMAT: trehalose block). Adapted from ref (110). Copyright 2015 American Chemical Society.
Figure 24
Figure 24
Thioflavin T assay for Aβ fibril detection over time at pH 7.4, 37 °C. (a) Green: no additives; pink: molecular trehalose; red: p(trehalose). (b) Green: no additives; gray: p(maltose); blue: p(lactose); red: p(trehalose). Adapted from ref (57) with permission from the Royal Society of Chemistry.
Figure 25
Figure 25
(a) Fluorescence micrographs of HRP patterned with poly(SET), PEG, trehalose or without an additive after staining with AlexaFluor 488 goat anti-HRP. Scale bars, 25 μm. (b) Signal to noise ratios calculated for different proteins patterned with different excipients. Reproduced with permission from ref (119). Copyright 2015 Springer Nature. (c–e) Optical images of magnetic micelles treated with M. smegmatis mc2 155 (108 CFU mL–1) (c) before and (d) after placing a magnet to the left of the sample. (e) M. smegmatis mc2 155 (104 CFU mL–1) after applying a magnet. Reproduced with permission from ref (121). Copyright 2016 Wiley

References

    1. Liu Q.; Schmidt R. K.; Teo B.; Karplus P. A.; Brady J. W. Molecular Dynamics Studies of the Hydration of α,α-Trehalose. J. Am. Chem. Soc. 1997, 119 (33), 7851–7862. 10.1021/ja970798v. - DOI
    1. Choi Y.; Cho K. W.; Jeong K.; Jung S. Molecular Dynamics Simulations of Trehalose as a ‘Dynamic Reducer’ for Solvent Water Molecules in the Hydration Shell. Carbohydr. Res. 2006, 341 (8), 1020–1028. 10.1016/j.carres.2006.02.032. - DOI - PubMed
    1. Crowe L. M.; Reid D. S.; Crowe J. H. Is Trehalose Special for Preserving Dry Biomaterials?. Biophys. J. 1996, 71 (4), 2087–2093. 10.1016/S0006-3495(96)79407-9. - DOI - PMC - PubMed
    1. Jain N. K.; Roy I. Effect of Trehalose on Protein Structure. Protein Sci. 2009, 18 (1), 24–36. 10.1002/pro.3. - DOI - PMC - PubMed
    1. Donnamaria M. C.; Howard E. I.; Grigera J. R. Interaction of Water with α,α-Trehalose in Solution: Molecular Dynamics Simulation Approach. J. Chem. Soc., Faraday Trans. 1994, 90 (18), 2731–2735. 10.1039/FT9949002731. - DOI