Specific intracellular signature of SARS-CoV-2 infection using confocal Raman microscopy
- PMID: 35911504
- PMCID: PMC9311350
- DOI: 10.1038/s42004-022-00702-7
Specific intracellular signature of SARS-CoV-2 infection using confocal Raman microscopy
Abstract
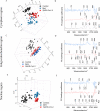
SARS-CoV-2 infection remains spread worldwide and requires a better understanding of virus-host interactions. Here, we analyzed biochemical modifications due to SARS-CoV-2 infection in cells by confocal Raman microscopy. Obtained results were compared with the infection with another RNA virus, the measles virus. Our results have demonstrated a virus-specific Raman molecular signature, reflecting intracellular modification during each infection. Advanced data analysis has been used to distinguish non-infected versus infected cells for two RNA viruses. Further, classification between non-infected and SARS-CoV-2 and measles virus-infected cells yielded an accuracy of 98.9 and 97.2 respectively, with a significant increase of the essential amino-acid tryptophan in SARS-CoV-2-infected cells. These results present proof of concept for the application of Raman spectroscopy to study virus-host interaction and to identify factors that contribute to the efficient SARS-CoV-2 infection and may thus provide novel insights on viral pathogenesis, targets of therapeutic intervention and development of new COVID-19 biomarkers.
Keywords: Bioanalytical chemistry; Biophysical chemistry; SARS-CoV-2.
© The Author(s) 2022.
Conflict of interest statement
Competing interestsThe authors declare no competing interests.
Figures


Similar articles
-
Therapeutic potential of green tea catechin, (-)-epigallocatechin-3-O-gallate (EGCG) in SARS-CoV-2 infection: Major interactions with host/virus proteases.Phytomed Plus. 2023 Feb;3(1):100402. doi: 10.1016/j.phyplu.2022.100402. Epub 2022 Dec 30. Phytomed Plus. 2023. PMID: 36597465 Free PMC article. Review.
-
RNA-Protein Interaction Analysis of SARS-CoV-2 5' and 3' Untranslated Regions Reveals a Role of Lysosome-Associated Membrane Protein-2a during Viral Infection.mSystems. 2021 Aug 31;6(4):e0064321. doi: 10.1128/mSystems.00643-21. Epub 2021 Jul 13. mSystems. 2021. PMID: 34254825 Free PMC article.
-
SARS-CoV-2 Evolutionary Adaptation toward Host Entry and Recognition of Receptor O-Acetyl Sialylation in Virus-Host Interaction.Int J Mol Sci. 2020 Jun 26;21(12):4549. doi: 10.3390/ijms21124549. Int J Mol Sci. 2020. PMID: 32604730 Free PMC article. Review.
-
A non-invasive ultrasensitive diagnostic approach for COVID-19 infection using salivary label-free SERS fingerprinting and artificial intelligence.J Photochem Photobiol B. 2022 Sep;234:112545. doi: 10.1016/j.jphotobiol.2022.112545. Epub 2022 Aug 19. J Photochem Photobiol B. 2022. PMID: 36049288 Free PMC article.
-
A Structurally Conserved RNA Element within SARS-CoV-2 ORF1a RNA and S mRNA Regulates Translation in Response to Viral S Protein-Induced Signaling in Human Lung Cells.J Virol. 2022 Jan 26;96(2):e0167821. doi: 10.1128/JVI.01678-21. Epub 2021 Nov 10. J Virol. 2022. PMID: 34757848 Free PMC article.
Cited by
-
Raman spectroscopic cellomics for the detection of SARS-CoV-2-associated neutrophil activation after TNF-α stimulation.Clin Transl Med. 2022 Dec;12(12):e1139. doi: 10.1002/ctm2.1139. Clin Transl Med. 2022. PMID: 36536489 Free PMC article. No abstract available.
-
Raman Multi-Omic Snapshot and Statistical Validation of Structural Differences between Herpes Simplex Type I and Epstein-Barr Viruses.Int J Mol Sci. 2023 Oct 25;24(21):15567. doi: 10.3390/ijms242115567. Int J Mol Sci. 2023. PMID: 37958551 Free PMC article.
-
Raman Spectroscopy Profiling of Splenic T-Cells in Sepsis and Endotoxemia in Mice.Int J Mol Sci. 2023 Jul 27;24(15):12027. doi: 10.3390/ijms241512027. Int J Mol Sci. 2023. PMID: 37569403 Free PMC article.
-
Raman analysis of lipids in cells: Current applications and future prospects.J Pharm Anal. 2025 Apr;15(4):101136. doi: 10.1016/j.jpha.2024.101136. Epub 2024 Nov 1. J Pharm Anal. 2025. PMID: 40242217 Free PMC article. Review.
References
LinkOut - more resources
Full Text Sources
Miscellaneous

