Different Impacts on the Heart After COVID-19 Infection and Vaccination: Insights From Cardiovascular Magnetic Resonance
- PMID: 35911510
- PMCID: PMC9329612
- DOI: 10.3389/fcvm.2022.916922
Different Impacts on the Heart After COVID-19 Infection and Vaccination: Insights From Cardiovascular Magnetic Resonance
Abstract
Introduction: Myocarditis-like findings after COVID-19 (coronavirus disease 2019) infection and vaccination were reported by applying cardiovascular magnetic resonance (CMR). These results are very heterogenous and dependent on several factors such as hospital admission or outpatient treatment, timing of CMR, and symptomatic load. This retrospective study aimed to identify differences in myocardial damage in patients with persistent symptoms both after COVID-19 infection and vaccine by applying CMR.
Materials and methods: This study entails a retrospective analysis of consecutive patients referred for CMR between August 2020 and November 2021 with persistent symptoms after COVID-19 infection or vaccination. Patients were compared to healthy controls (HC). All patients underwent a CMR examination in a 1.5-T scanner with a scan protocol including: cine imaging for biventricular function and strain assessment using feature tracking, T2 mapping for the quantification of edema, and T1 mapping for diffuse fibrosis and late gadolinium enhancement (LGE) for the detection and quantification of focal fibrosis. Patients were divided into a subacute COVID-19 (sCov) group with symptoms lasting < 12 weeks, post-COVID-19 (pCov) group with symptoms > 12 weeks, and patients after COVID-19 vaccination (CovVac).
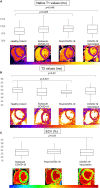
Results: A total of 162 patients were recruited of whom 141 were included for analysis. The median age in years (interquartile range (IQR)) of the entire cohort was 45 (37-56) which included 83 women and 58 men. Subgroups were as follows (total patients per subgroup, median age in years (IQR), main gender): 34 sCov, 43 (37-52), 19 women; 63 pCov, 52 (39-58), 43 women; 44 CovVac, 43 (32-56), 23 men; 44 HC (41 (28-52), 24 women). The biventricular function was preserved and revealed no differences between the groups. No active inflammation was detected by T2 mapping. Global T1 values were higher in pCov in comparison with HC (median (IQR) in ms: pCov 1002ms (981-1023) vs. HC 987ms (963-1009; p = 0.005) with other parings revealing no differences. In 49/141 (34.6%) of patients, focal fibrosis was detectable with the majority having a non-ischemic pattern (43/141; 30.4%; patients) with the subgroups after infection having more often a subepicardial pattern compared with CovVac (total (% of group): sCov: 7/34(21%); pCov 13/63(21%); CovVac 2/44(5%); p = 0.04).
Conclusion: Patients after COVID-19 infection showed more focal fibrosis in comparison with patients after COVID-19 vaccination without alterations in the biventricular function.
Keywords: COVID-19; cardiovascular magnetic resonance; fibrosis; late gadolinium enhancement; mapping; vaccination.
Copyright © 2022 Gröschel, Bhoyroo, Blaszczyk, Trauzeddel, Viezzer, Saad, Fenski and Schulz-Menger.
Conflict of interest statement
The authors declare that the research was conducted in the absence of any commercial or financial relationships that could be construed as a potential conflict of interest.
Figures


References
-
- Raman B, Cassar MP, Tunnicliffe EM, Filippini N, Griffanti L, Alfaro-Almagro F, et al. Medium-term effects of SARS-CoV-2 infection on multiple vital organs, exercise capacity, cognition, quality of life and mental health, post-hospital discharge. EClinicalMedicine. (2021) 31:100683. 10.1016/j.eclinm.2020.100683 - DOI - PMC - PubMed
LinkOut - more resources
Full Text Sources

