

Deep learning super-resolution magnetic resonance spectroscopic imaging of brain metabolism and mutant isocitrate dehydrogenase glioma
- PMID: 35911635
- PMCID: PMC9332900
- DOI: 10.1093/noajnl/vdac071
Deep learning super-resolution magnetic resonance spectroscopic imaging of brain metabolism and mutant isocitrate dehydrogenase glioma
Abstract
Background: Magnetic resonance spectroscopic imaging (MRSI) can be used in glioma patients to map the metabolic alterations associated with IDH1,2 mutations that are central criteria for glioma diagnosis. The aim of this study was to achieve super-resolution (SR) MRSI using deep learning to image tumor metabolism in patients with mutant IDH glioma.
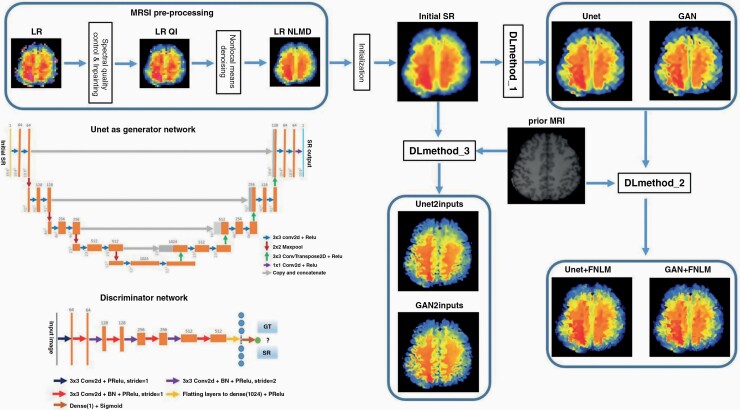
Methods: We developed a deep learning method based on generative adversarial network (GAN) using Unet as generator network to upsample MRSI by a factor of 4. Neural networks were trained on simulated metabolic images from 75 glioma patients. The performance of deep neuronal networks was evaluated on MRSI data measured in 20 glioma patients and 10 healthy controls at 3T with a whole-brain 3D MRSI protocol optimized for detection of d-2-hydroxyglutarate (2HG). To further enhance structural details of metabolic maps we used prior information from high-resolution anatomical MR imaging. SR MRSI was compared to ground truth by Mann-Whitney U-test of peak signal-to-noise ratio (PSNR), structure similarity index measure (SSIM), feature-based similarity index measure (FSIM), and mean opinion score (MOS).
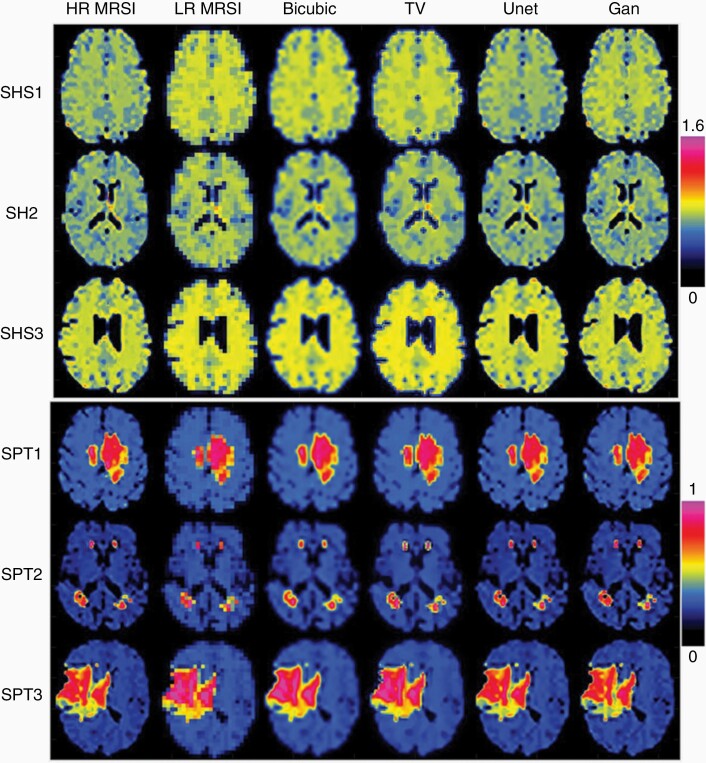
Results: Deep learning SR improved PSNR by 17%, SSIM by 5%, FSIM by 7%, and MOS by 30% compared to conventional interpolation methods. In mutant IDH glioma patients proposed method provided the highest resolution for 2HG maps to clearly delineate tumor margins and tumor heterogeneity.
Conclusions: Our results indicate that proposed deep learning methods are effective in enhancing spatial resolution of metabolite maps. Patient results suggest that this may have great clinical potential for image guided precision oncology therapy.
Keywords: D-2-hydroxyglutarate; deep learning; glioma; isocitrate dehydrogenase; magnetic resonance spectroscopic imaging; super-resolution.
© The Author(s) 2022. Published by Oxford University Press, the Society for Neuro-Oncology and the European Association of Neuro-Oncology.
Figures


Similar articles
-
Super-Resolution Whole-Brain 3D MR Spectroscopic Imaging for Mapping D-2-Hydroxyglutarate and Tumor Metabolism in Isocitrate Dehydrogenase 1-mutated Human Gliomas.Radiology. 2020 Mar;294(3):589-597. doi: 10.1148/radiol.2020191529. Epub 2020 Jan 7. Radiology. 2020. PMID: 31909698 Free PMC article.
-
Super-Resolution MR Spectroscopic Imaging via Diffusion Models for Tumor Metabolism Mapping.J Imaging Inform Med. 2025 Sep 2. doi: 10.1007/s10278-025-01652-x. Online ahead of print. J Imaging Inform Med. 2025. PMID: 40897835
-
Unsupervised arterial spin labeling image superresolution via multiscale generative adversarial network.Med Phys. 2022 Apr;49(4):2373-2385. doi: 10.1002/mp.15468. Epub 2022 Mar 7. Med Phys. 2022. PMID: 35048390
-
2-Hydroxyglutarate MR spectroscopy for prediction of isocitrate dehydrogenase mutant glioma: a systemic review and meta-analysis using individual patient data.Neuro Oncol. 2018 Nov 12;20(12):1573-1583. doi: 10.1093/neuonc/noy113. Neuro Oncol. 2018. PMID: 30020513 Free PMC article.
-
Detection of oncogenic IDH1 mutations using magnetic resonance spectroscopy of 2-hydroxyglutarate.J Clin Invest. 2013 Sep;123(9):3659-63. doi: 10.1172/JCI67229. Epub 2013 Sep 3. J Clin Invest. 2013. PMID: 23999439 Free PMC article. Review.
Cited by
-
Moving towards a unified classification of glioblastomas utilizing artificial intelligence and deep machine learning integration.Front Oncol. 2023 Jun 23;13:1063937. doi: 10.3389/fonc.2023.1063937. eCollection 2023. Front Oncol. 2023. PMID: 37427111 Free PMC article.
-
A Flow-based Truncated Denoising Diffusion Model for super-resolution Magnetic Resonance Spectroscopic Imaging.Med Image Anal. 2025 Jan;99:103358. doi: 10.1016/j.media.2024.103358. Epub 2024 Sep 27. Med Image Anal. 2025. PMID: 39353335
-
AI-Driven Innovations in Neuroradiology and Neurosurgery: Scoping Review of Current Evidence and Future Directions.Cancers (Basel). 2025 Aug 11;17(16):2625. doi: 10.3390/cancers17162625. Cancers (Basel). 2025. PMID: 40867254 Free PMC article. Review.
-
MR Spatiospectral Reconstruction Integrating Subspace Modeling and Self-Supervised Spatiotemporal Denoising.IEEE Trans Med Imaging. 2025 Jul;44(7):3002-3011. doi: 10.1109/TMI.2025.3555928. IEEE Trans Med Imaging. 2025. PMID: 40153290 Free PMC article.
-
Value of artificial intelligence in neuro-oncology.Lancet Digit Health. 2025 Aug 8:100876. doi: 10.1016/j.landig.2025.100876. Online ahead of print. Lancet Digit Health. 2025. PMID: 40783350 Review.
References
-
- Bunse L, Pusch S, Bunse T, et al. . Suppression of antitumor T cell immunity by the oncometabolite (R)-2-hydroxyglutarate. Nat Med. 2018;24(8):1192–1203. - PubMed
Grants and funding
LinkOut - more resources
Full Text Sources
Research Materials
Miscellaneous