

Quantity as a Fish Views It: Behavior and Neurobiology
- PMID: 35911657
- PMCID: PMC9334151
- DOI: 10.3389/fnana.2022.943504
Quantity as a Fish Views It: Behavior and Neurobiology
Abstract
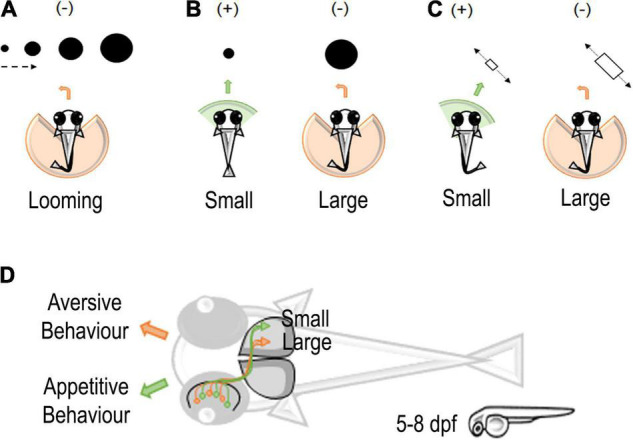
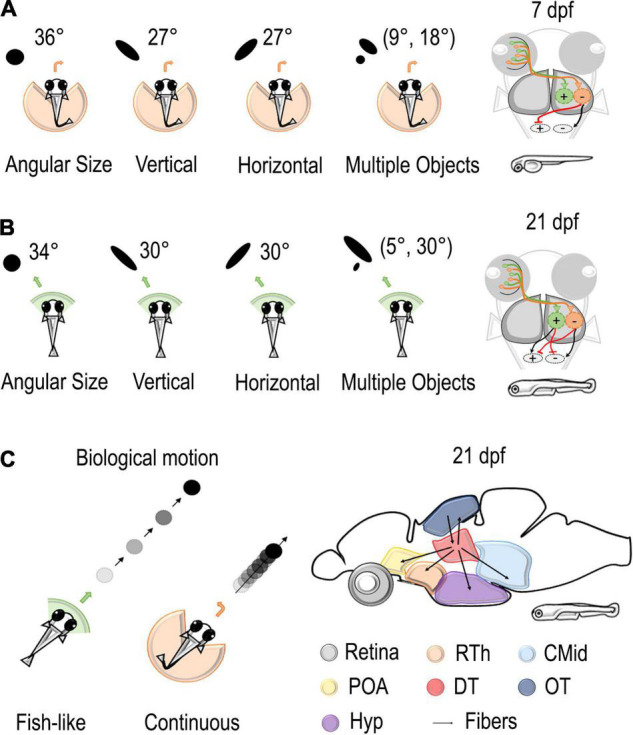
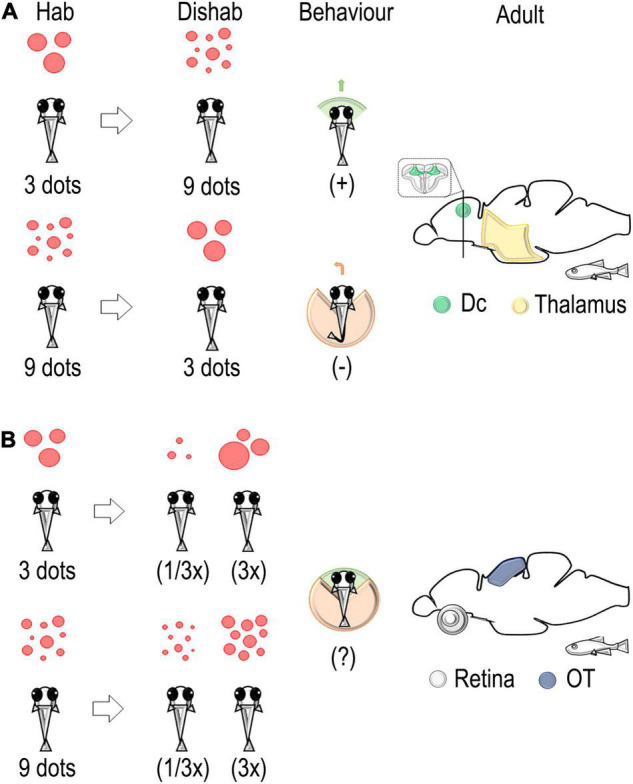
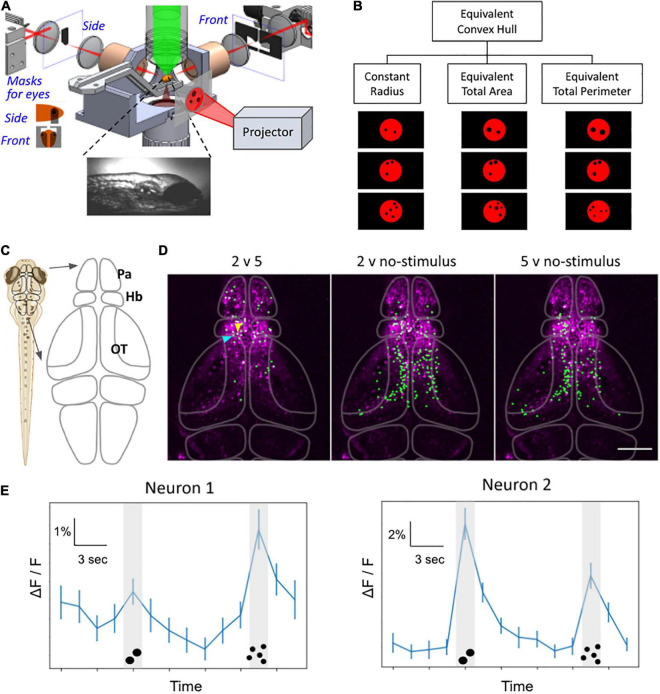
An ability to estimate quantities, such as the number of conspecifics or the size of a predator, has been reported in vertebrates. Fish, in particular zebrafish, may be instrumental in advancing the understanding of magnitude cognition. We review here the behavioral studies that have described the ecological relevance of quantity estimation in fish and the current status of the research aimed at investigating the neurobiological bases of these abilities. By combining behavioral methods with molecular genetics and calcium imaging, the involvement of the retina and the optic tectum has been documented for the estimation of continuous quantities in the larval and adult zebrafish brain, and the contributions of the thalamus and the dorsal-central pallium for discrete magnitude estimation in the adult zebrafish brain. Evidence for basic circuitry can now be complemented and extended to research that make use of transgenic lines to deepen our understanding of quantity cognition at genetic and molecular levels.
Keywords: fish cognition; imaging; pallium; quantity discrimination; retina; tectum; visual system; zebrafish.
Copyright © 2022 Messina, Potrich, Perrino, Sheardown, Miletto Petrazzini, Luu, Nadtochiy, Truong, Sovrano, Fraser, Brennan and Vallortigara.
Conflict of interest statement
The authors declare that the research was conducted in the absence of any commercial or financial relationships that could be construed as a potential conflict of interest.
Figures
Similar articles
-
The Sense of Number in Fish, with Particular Reference to Its Neurobiological Bases.Animals (Basel). 2021 Oct 27;11(11):3072. doi: 10.3390/ani11113072. Animals (Basel). 2021. PMID: 34827804 Free PMC article. Review.
-
Retinotectal circuitry of larval zebrafish is adapted to detection and pursuit of prey.Elife. 2020 Oct 12;9:e58596. doi: 10.7554/eLife.58596. Elife. 2020. PMID: 33044168 Free PMC article.
-
Characterizing ontogeny of quantity discrimination in zebrafish.Proc Biol Sci. 2022 Feb 9;289(1968):20212544. doi: 10.1098/rspb.2021.2544. Epub 2022 Feb 9. Proc Biol Sci. 2022. PMID: 35135351 Free PMC article.
-
Response to change in the number of visual stimuli in zebrafish:A behavioural and molecular study.Sci Rep. 2020 Apr 1;10(1):5769. doi: 10.1038/s41598-020-62608-5. Sci Rep. 2020. PMID: 32238844 Free PMC article.
-
Anatomy and function of retinorecipient arborization fields in zebrafish.J Comp Neurol. 2021 Oct;529(15):3454-3476. doi: 10.1002/cne.25204. Epub 2021 Jul 14. J Comp Neurol. 2021. PMID: 34180059 Review.
Cited by
-
Neural Basis of Number Sense in Larval Zebrafish.bioRxiv [Preprint]. 2024 Sep 5:2024.08.30.610552. doi: 10.1101/2024.08.30.610552. bioRxiv. 2024. PMID: 39290349 Free PMC article. Preprint.
-
The interplay of motor adaptation and groupitizing in numerosity perception: Insights from visual motion adaptation and proprioceptive motor adaptation.PeerJ. 2024 Feb 27;12:e16887. doi: 10.7717/peerj.16887. eCollection 2024. PeerJ. 2024. PMID: 38436019 Free PMC article.
-
Looks like home: numerosity, but not spatial frequency guides preference in zebrafish larvae (Danio rerio).Anim Cogn. 2024 Jul 27;27(1):53. doi: 10.1007/s10071-024-01888-0. Anim Cogn. 2024. PMID: 39066805 Free PMC article.
-
More than double the fun with two-photon excitation microscopy.Commun Biol. 2024 Mar 26;7(1):364. doi: 10.1038/s42003-024-06057-0. Commun Biol. 2024. PMID: 38531976 Free PMC article. Review.
-
Proto-arithmetic abilities in zebrafish (Danio rerio).Heliyon. 2024 Nov 20;10(23):e40585. doi: 10.1016/j.heliyon.2024.e40585. eCollection 2024 Dec 15. Heliyon. 2024. PMID: 39669161 Free PMC article.
References
-
- Agrillo C., Dadda M. (2007). Discrimination of the larger shoal in the poeciliid fish Girardinus falcatus. Ethol. Ecol. Evol. 19 145–157. 10.1080/08927014.2007.9522574 - DOI
Publication types
LinkOut - more resources
Full Text Sources