. 2022 Jul 14:13:922318.
doi: 10.3389/fimmu.2022.922318. eCollection 2022.

Investigating the Mechanism of Germinal Center Shutdown

Affiliations

Investigating the Mechanism of Germinal Center Shutdown

Theinmozhi Arulraj et al. Front Immunol. .

Abstract

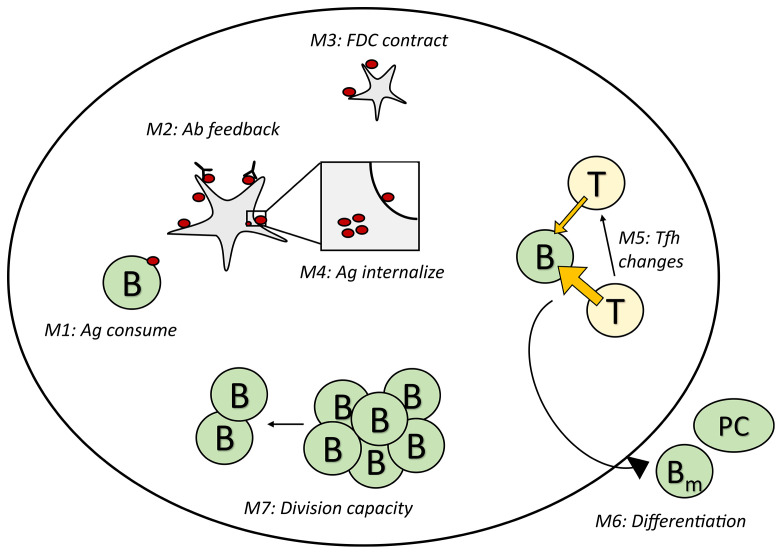
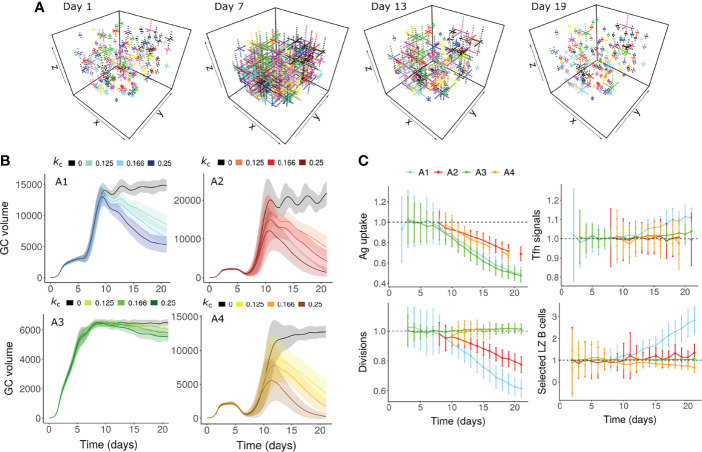
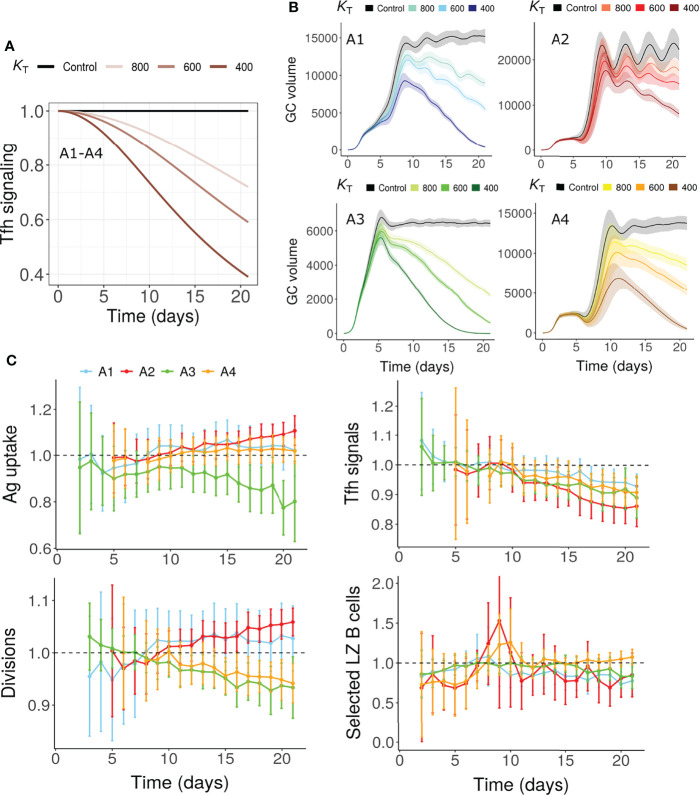
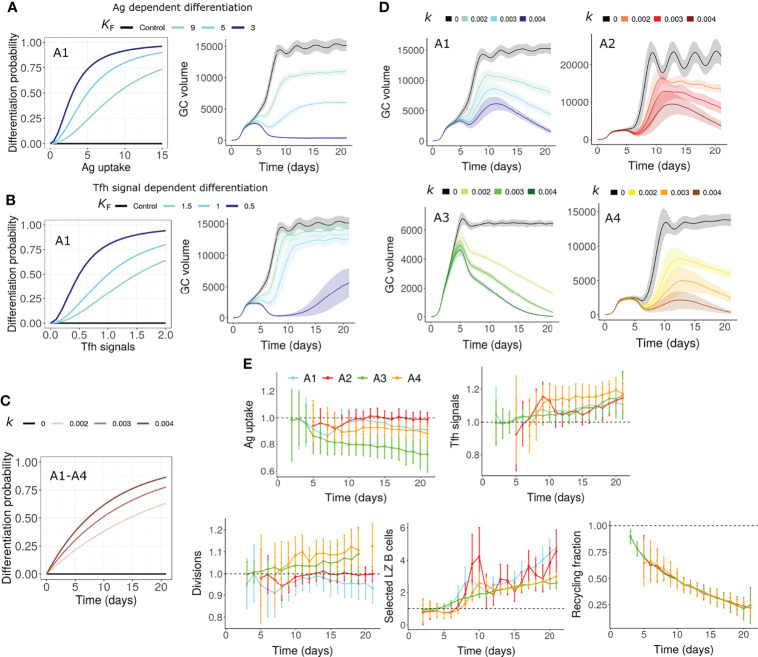
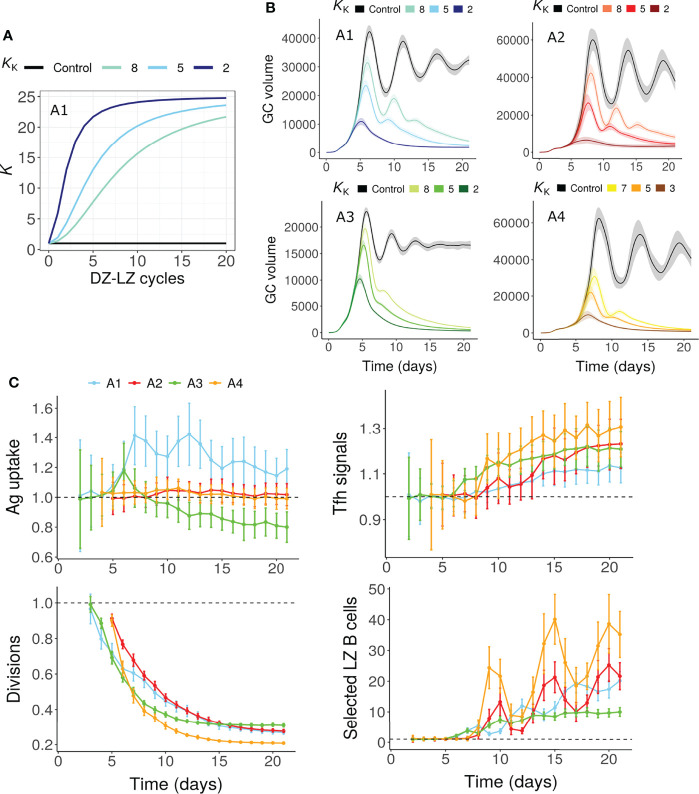
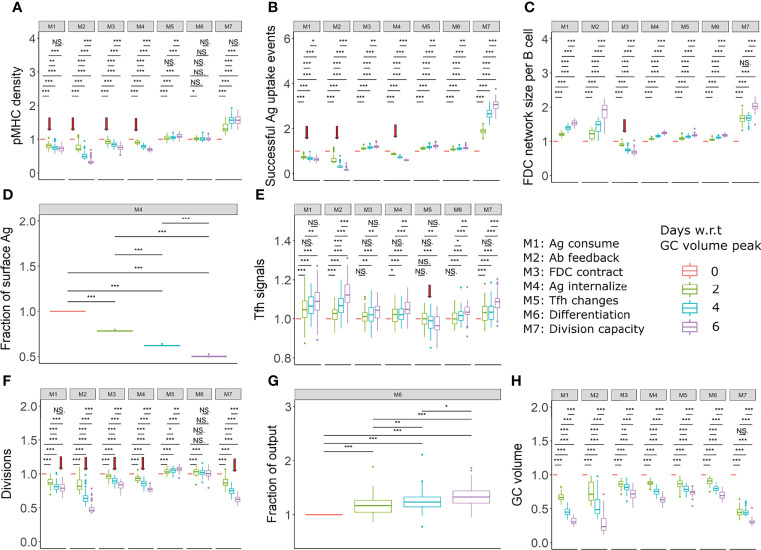
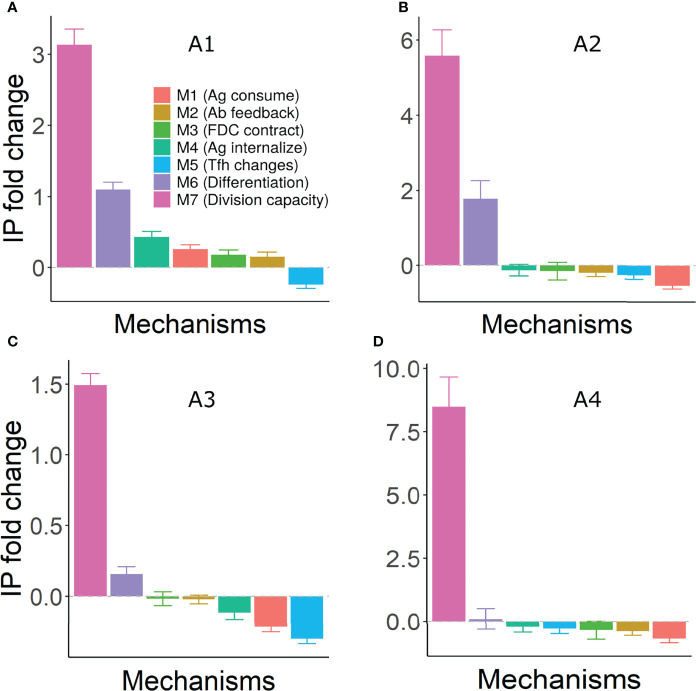
Germinal centers (GCs) are transient structures where affinity maturation of B cells gives rise to high affinity plasma and memory cells. The mechanism of GC shutdown is unclear, despite being an important phenomenon maintaining immune homeostasis. In this study, we used a mathematical model to identify mechanisms that can independently promote contraction of GCs leading to shutdown. We show that GC shutdown can be promoted by antigen consumption by B cells, antigen masking by soluble antibodies, alterations in follicular dendritic cell (FDC) network area, modulation of immune complex cycling rate constants, alterations in T follicular helper signaling, increased terminal differentiation and reduced B cell division capacity. Proposed mechanisms promoted GC contraction by ultimately decreasing the number of B cell divisions and recycling cells. Based on the in-silico predictions, we suggest a combination of experiments that can be potentially employed by future studies to unravel the mechanistic basis of GC shutdown such as measurements of the density of pMHC presentation of B cells, FDC network size per B cell, fraction of cells expressing differentiation markers. We also show that the identified mechanisms differentially affect the efficiency of GC reaction estimated based on the quantity and quality of resulting antibodies.

Keywords: antibody responses; chronic germinal centers; germinal center shutdown; mathematical modeling; vaccination.


Conflict of interest statement

The authors declare that the research was conducted in the absence of any commercial or financial relationships that could be construed as a potential conflict of interest.

Figures

Figure 1
Figure 1
Schematic representation of the GC shutdown mechanisms. In mechanisms M1-M4, antigen limitation arises due to the consumption of antigen by B cells, masking of antigen by soluble antibodies (antibody feedback), contraction of FDC network and changes in antigen cycling rate constants leading to increased internalization of antigen, respectively. In M5, Tfh signaling intensity decreases leading to limiting T cell help. In M6, increased terminal differentiation of GC B cells into memory/plasma cells leads to increased exit from GCs. In M7, B cells have limited capacity to divide leading to decreased proliferation over time. GC, Germinal center; FDC, Follicular Dendritic Cell; T/Tfh, T follicular helper cell; Ab, Antibody; Ag, Antigen; PC, Plasma cell; Bm, Memory B cell; B, Germinal center B cell.
Figure 2
Figure 2
GC shutdown due to contraction of FDCs (Mechanism 3). (A) Visualization of the FDC network in a GC simulation at 4 different time points (Days 1, 7, 13 and 19). In this representative simulation, assumption A1 ( Table 1 ) was used with an FDC contraction rate k c of 0.166 µm per hour. Each lattice site occupied by the FDC is shown as a dot. Soma and dendrites belonging to the same FDC are shown in the same color. (B) GC dynamics with assumptions A1-A4. Black curves represent control simulations. Different colors represent different rates of FDC contraction k c as shown in the labels above panel (B) Solid lines and shaded regions represent mean and standard deviation of 50 simulations, respectively. (C) Average antigen uptake per B cell, Tfh signals acquired per B cell, number of divisions of recycling GC B cells and fraction of Tfh selected LZ B cells. Readouts were normalized with that of the control simulation. Colors represent the assumptions A1-A4. Error bars represent standard deviation of 50 simulations. An FDC contraction rate of 0.166 µm per hour was used in panel (C) In all the panels, FDC extension rate was 0.166 µm per hour. GC, Germinal center; FDC, Follicular Dendritic Cell; Tfh, T follicular helper cell; Ag, Antigen; LZ, Light Zone.
Figure 3
Figure 3
GC shutdown due to changes in Tfh signaling intensity (Mechanism 5). (A) Maximum Tfh signaling intensity T max vs time according to Equation 8 in assumptions A1-A4. Values were normalized to the maximum signaling intensity at the start of the simulation. Colors represent different values of K T and black curve labelled control represents the control simulation where no decrease in Tfh signaling intensity was considered. K T is the time point in hours where the maximum Tfh signaling intensity decreases to half of its initial value (see Equation 8, Methods sections). (B) GC dynamics in assumptions A1-A4. Black curves represent control simulations. Different colors represent value of K T used in Equation 8 and are shown in labels above panel (B) Solid lines and shaded regions represent mean and standard deviation of 50 simulations, respectively. (C) Average antigen uptake per B cell, Tfh signals acquired per B cell, average number of divisions per recycling GC B cell and fraction of Tfh selected centrocytes (with K T = 600). Readouts were normalized with that of the control simulation. Colors represent the assumptions A1-A4. Error bars represent standard deviation of 50 simulations. GC, Germinal center; Tfh, T follicular helper cell; Ag, Antigen; LZ, Light Zone.
Figure 4
Figure 4
GC shutdown due to terminal differentiation of B cells (Mechanism 6). (A, B) Differentiation probability in antigen dependent (A) and Tfh signal dependent (B) terminal differentiation and corresponding GC volume dynamics. Colors represent different values of K F in Equation 9. K F is the amount of Ag captured (in antigen dependent terminal differentiation) or Tfh signals received (in Tfh signal dependent terminal differentiation) for half-maximal differentiation probability (see Methods). Assumption A1 was considered in these simulations. (C, D) Terminal differentiation probability vs time according to Equation 10 in assumptions A1-A4 for time dependent terminal differentiation (C). Colors represent different values of k and corresponding GC dynamics (D). Black curves represent control simulations. Different colors represent value of k in Equation 10 and are shown in labels above (C, D) Value of k controls the increase in differentiation probability. Solid lines and shaded regions in panels A, B and D represent mean and standard deviation of 50 simulations, respectively. (E) Average antigen uptake per B cell, Tfh signals acquired per B cell, average number of divisions per recycling GC B cell and fraction of Tfh selected LZ B cells for time dependent terminal differentiation (k = 0.003). Readouts were normalized with that of the control simulation. Colors represent the assumptions A1-A4. Error bars represent standard deviation of 50 simulations. GC, Germinal center; Tfh, T follicular helper cell; Ag, Antigen; LZ, Light Zone.
Figure 5
Figure 5
GC shutdown due to limited B cell division capacity (Mechanism 7). (A, B) K vs number of DZ-LZ cycles according to Equation 11 (A) and GC dynamics (B) for assumptions A1-A4. Colors represent different values of K K as shown above the panels and black curves represent the control simulation. K K controls the increase in K with increasing number of DZ-LZ cycles. The value of K determines the dependence of the number of divisions on the amount of antigen captured in assumptions A1/A2 or Tfh signals acquired by B cells in A3/A4 (see Methods). Solid lines and shaded regions represent mean and standard deviation of 50 simulations, respectively. (C) Average antigen uptake per B cell, Tfh signals acquired per B cell, average number of divisions per recycling GC B cell and fraction of Tfh selected LZ B cells (with K K = 5). Readouts were normalized with that of the control simulation. Colors represent the assumptions A1-A4. Error bars represent standard deviation of 50 simulations. GC, Germinal center; Tfh, T follicular helper cell; Ag, Antigen; DZ, Dark zone; LZ, Light zone.
Figure 6
Figure 6
Proposed experiments to identify the existence of mechanisms (in assumption A1). (A) pMHC density of selected centrocytes, (B) Fraction of successful antigen uptake events among all FDC-B cell encounters, (C) FDC network size per B cell, (D) Fraction of Ag on FDC surface, (E) Tfh signals received by selected centrocytes, (F) Average number of divisions of recycling centrocytes, (G) Fraction of output cells among Tfh selected cells, (H) GC volume in all mechanisms. All readouts were normalized with respect to (w.r.t) the value at the peak of the GC reaction. Different colors represent the different time points with respect to GC reaction peak. The FDC network size per B cell was calculated by dividing the total number of lattice sites occupied by FDCs by the total number of GC B cells. Statistical tests were performed by Wilcoxon test. Error bars represent standard deviation of 50 simulations. Red arrows indicate a decreasing trend in readouts that differs from other mechanisms. Parameter values used in different mechanism: M1: 1 unit of Ag consumption per FDC-B cell interaction, M2: N=300, M3: FDC contraction rate = 0.166 µm per hour, M4: K ext =150, M5: K T = 600, M6: k = 0.003, M7: K K = 5. GC, Germinal center; Tfh, T follicular helper cell; Ag, Antigen; Ab, Antibody; FDC, Follicular dendritic cell. * = p < 0.05, ** = p < 0.01, *** = p < 0.001. NS, not significant.
Figure 7
Figure 7
Fold change in efficiency (IP) of GC reaction under different mechanisms of shutdown. Panels (A–D) represent assumptions A1-A4, respectively. IP was calculated using equation 13 at day 21 of the GC simulation and fold change was calculated with respect to the IP of the corresponding control simulation. Error bars represent standard deviation of 50 simulations. Positive and negative values represent an increase and decrease, respectively, compared to the control simulation. Parameter values used in different mechanism: M1: 1 unit of Ag consumption per FDC-B cell interaction, M2: N=300, M3: FDC contraction rate = 0.166 µm per hour, M4: K ext =150, 200, 80 and 250 in assumptions A1-A4, M5: K T = 600, M6: k = 0.003, M7: K K = 5. GC, Germinal center; Tfh, T follicular helper cell; Ag, Antigen; Ab, Antibody; FDC, Follicular dendritic cell; IP, Immune Power.

Similar articles

Cited by

References

    1. MacLennan ICM. Germinal Centers. Annu Rev Immunol (1994) 12:117–39. doi: 10.1146/annurev.iy.12.040194.001001 - DOI - PubMed
    1. Camacho SA, Kosco-Vilbois MH, Berek C. The Dynamic Structure of the Germinal Center. Immunol Today (1998) 19:511–4. doi: 10.1016/S0167-5699(98)01327-9 - DOI - PubMed
    1. Allen CDC, Ansel KM, Low C, Lesley R, Tamamura H, Fujii N, et al. . Germinal Center Dark and Light Zone Organization is Mediated by CXCR4 and CXCR5. Nat Immunol (2004) 5:943–52. doi: 10.1038/ni1100 - DOI - PubMed
    1. van Eijk M, Medema JP, de Groot C. Cutting Edge: Cellular Fas-Associated Death Domain-Like IL-1-Converting Enzyme-Inhibitory Protein Protects Germinal Center B Cells From Apoptosis During Germinal Center Reactions. J Immunol (2001) 166:6473–76. doi: 10.4049/jimmunol.166.11.6473 - DOI - PubMed
    1. Victora GD, Schwickert TA, Fooksman DR, Kamphorst AO, Meyer-Hermann M, Dustin ML, et al. . Germinal Center Dynamics Revealed by Multiphoton Microscopy With a Photoactivatable Fluorescent Reporter. Cell (2010) 143:592–605. doi: 10.1016/j.cell.2010.10.032 - DOI - PMC - PubMed

Publication types

Substances