. 2022 Jul 13:13:935394.
doi: 10.3389/fimmu.2022.935394. eCollection 2022.

IL-6-Driven pSTAT1 Response Is Linked to T Cell Features Implicated in Early Immune Dysregulation

Affiliations

IL-6-Driven pSTAT1 Response Is Linked to T Cell Features Implicated in Early Immune Dysregulation

Katharina Lambert et al. Front Immunol. .

Abstract

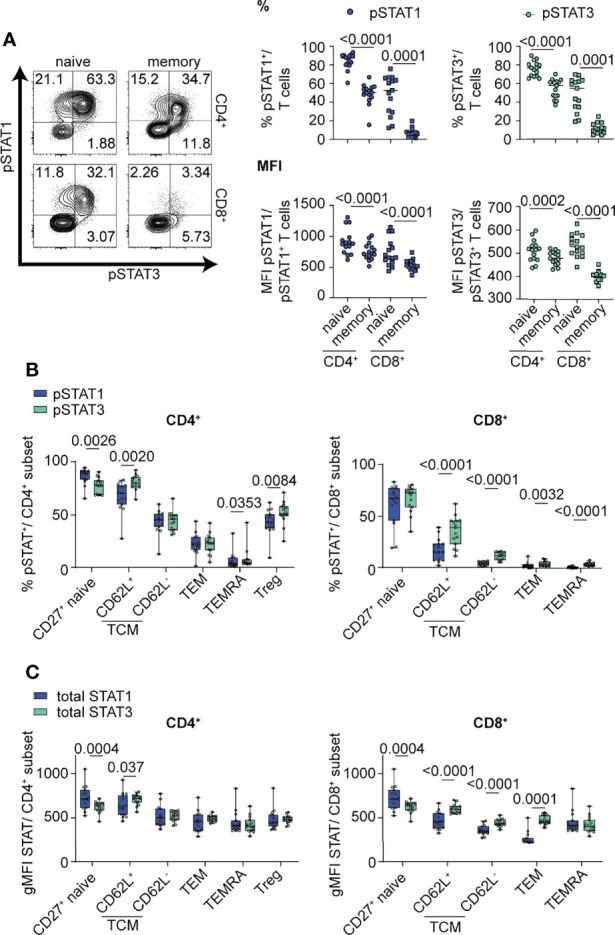
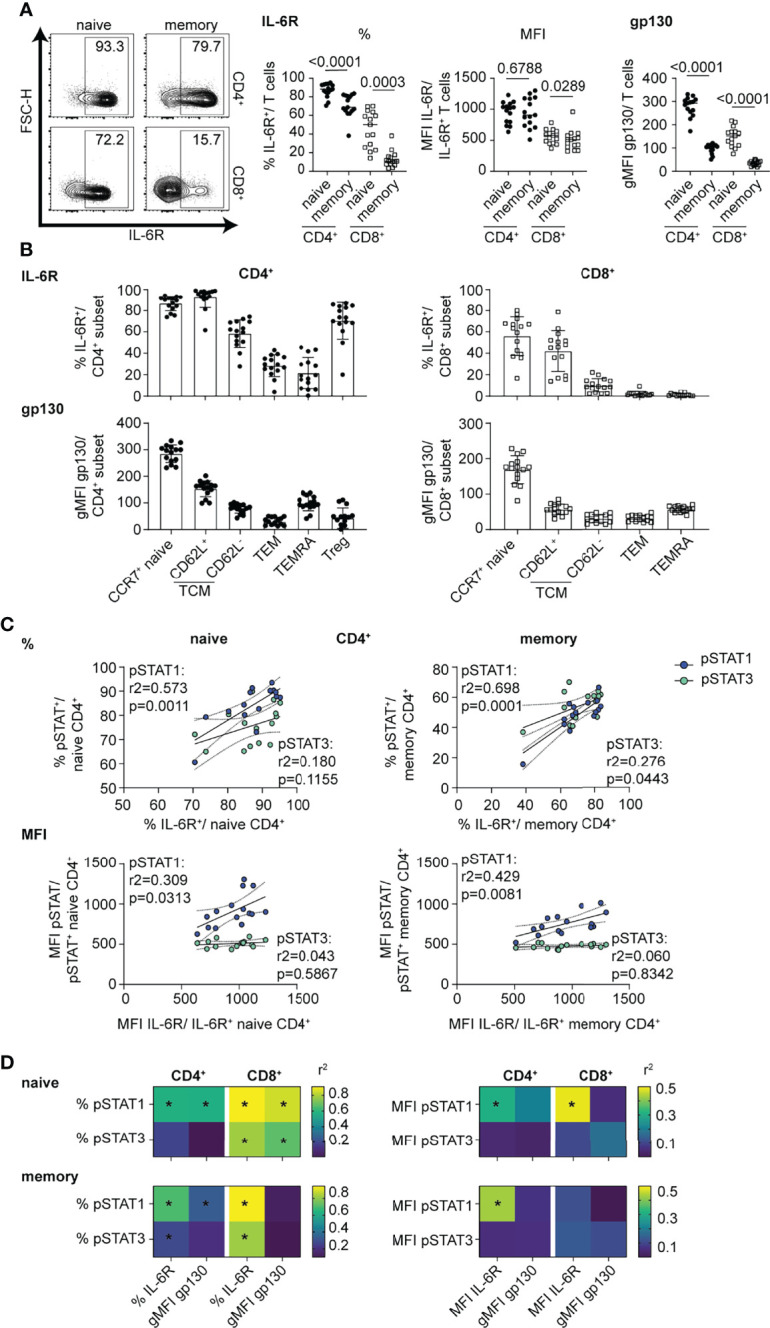
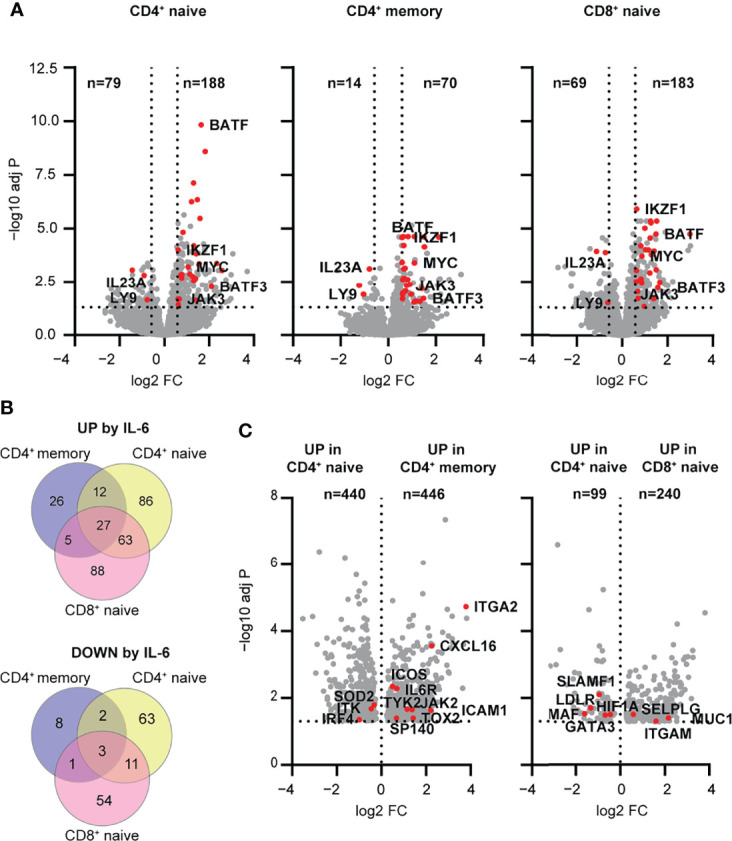
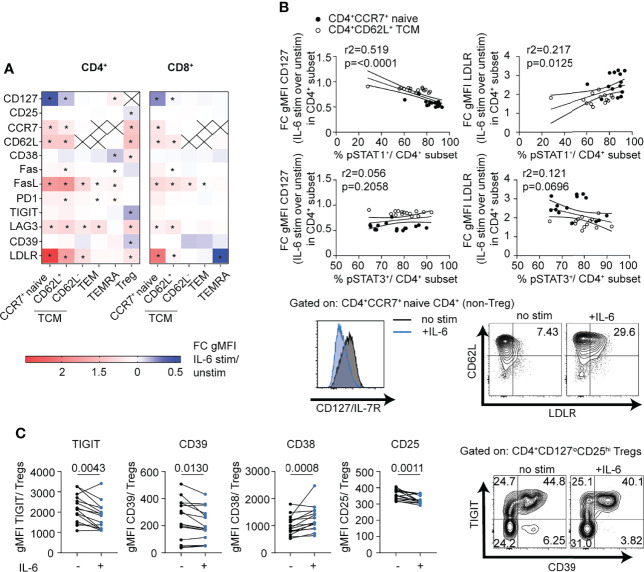
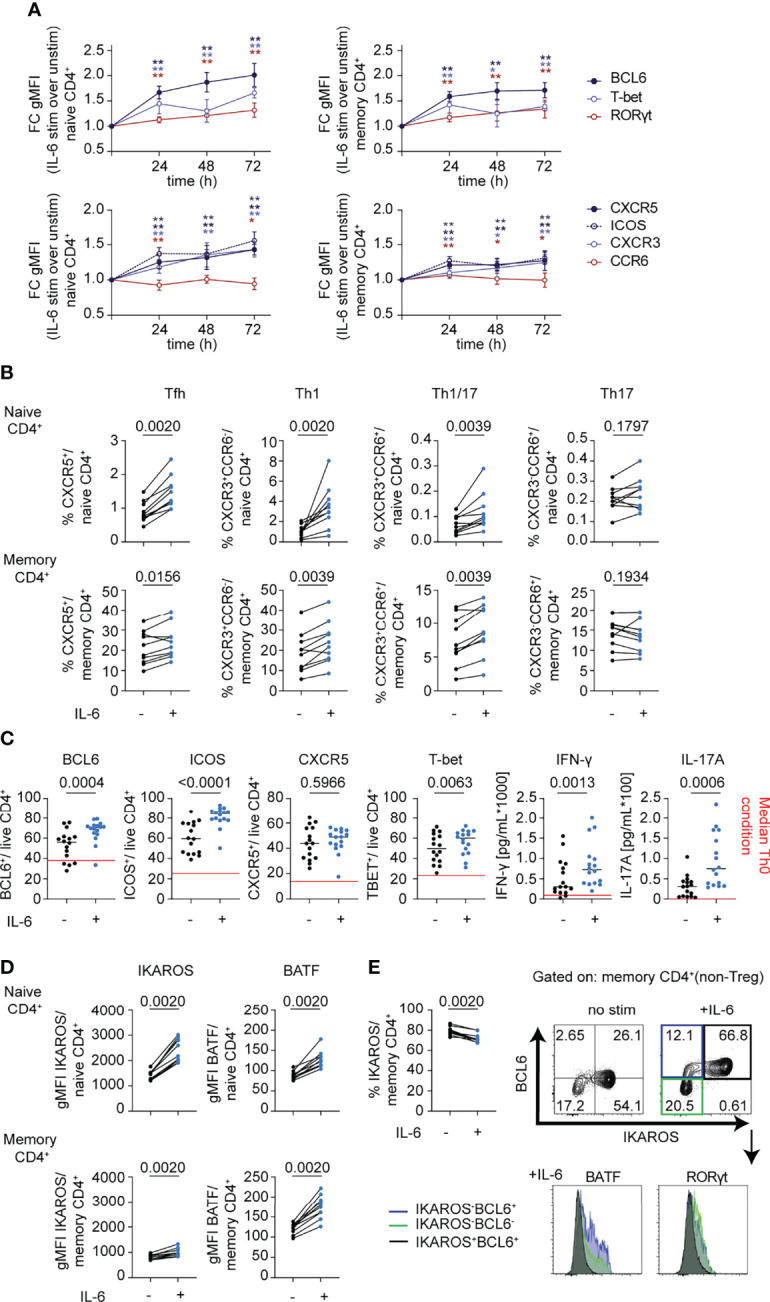
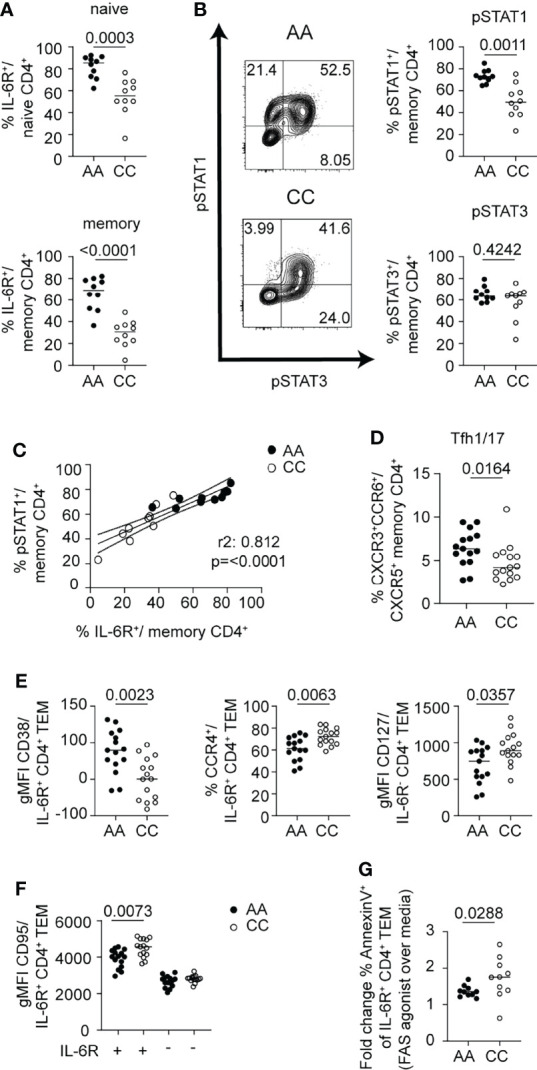
Elevated levels and enhanced sensing of the pro-inflammatory cytokine interleukin-6 (IL-6) are key features of many autoimmune and inflammatory diseases. To better understand how IL-6 signaling may influence human T cell fate, we investigated the relationships between levels of components of the IL-6R complex, pSTAT responses, and transcriptomic and translational changes in CD4+ and CD8+ T cell subsets from healthy individuals after exposure to IL-6. Our findings highlight the striking heterogeneity in mbIL-6R and gp130 expression and IL-6-driven pSTAT1/3 responses across T cell subsets. Increased mbIL-6R expression correlated with enhanced signaling via pSTAT1 with less impact on pSTAT3, most strikingly in CD4+ naïve T cells. Additionally, IL-6 rapidly induced expression of transcription factors and surface receptors expressed by T follicular helper cells and altered expression of markers of apoptosis. Importantly, many of the features associated with the level of mbIL-6R expression on T cells were recapitulated both in the setting of tocilizumab therapy and when comparing donor CD4+ T cells harboring the genetic variant, IL6R Asp358Ala (rs2228145), known to alter mbIL-6R expression on T cells. Collectively, these findings should be taken into account as we consider the role of IL-6 in disease pathogenesis and translating IL-6 biology into effective therapies for T cell-mediated autoimmune disease.

Keywords: STAT1; STAT3; T cells; apoptosis; autoimmunity; interleukin-6 (IL-6); interleukin-6 receptor (IL-6R).


Conflict of interest statement

JB is a Scientific Co-Founder and Scientific Advisory Board member of GentiBio, a consultant for Bristol-Myers Squibb and Hotspot Therapeutics, and has past and current research projects sponsored by Amgen, Bristol-Myers Squib, Janssen, Novo Nordisk, and Pfizer. She is a member of the Type 1 Diabetes TrialNet Study Group, a partner of the Allen Institute for Immunology, and a member of the Scientific Advisory Boards for the La Jolla Institute for Allergy and Immunology and BMS Immunology. The remaining authors declare that the research was conducted in the absence of any commercial or financial relationships that could be construed as a potential conflict of interest.

Figures

Figure 1
Figure 1
IL-6-driven pSTAT1 and pSTAT3 responses differ in CD4+ and CD8+ T cell subsets. (A, B) CD3-enriched T cells were stimulated with IL-6 (20 ng/mL) for 30 min or (C) left unstimulated and the pSTAT1 and pSTAT3 response or levels of total STAT1 and STAT3 protein were determined by flow cytometry. (A) Representative flow plot of pSTAT response (left) and frequencies and MFI of gated pSTAT1+ or pSTAT3+ cells among naïve (CD45RA+) or memory (CD45RA-) CD4+ (non-Treg) and CD8+ T cells (right) or (B) among CD4+ and CD8+ T cell subsets in the context of T cell maturation. (C) gMFI expression levels of total STAT1 and STAT3 protein were measured in CD4+ and CD8+ T cell subsets in the context of T cell maturation. (A–C) Wilcoxon matched-pairs signed rank test. n = 15.
Figure 2
Figure 2
mbIL-6R levels direct strength of pSTAT1 signaling response in CD4+ and CD8+ T cell subsets. (A-D) CD3-enriched T cells were left unstimulated or (C, D) stimulated with IL-6 (20 ng/mL) for 30 min or and mbIL-6R and gp130 levels or the pSTAT1 and pSTAT3 response were determined by flow cytometry. (A) Representative flow plot of mbIL-6R expression and frequencies and MFI of gated mbIL-6R+ cells (middle) or gMFI expression levels of gp130 (right) among naïve or memory CD4+ (non-Treg) and CD8+ T cells or (B) CD4+ and CD8+ T cell subsets in the context of T cell maturation. (C) Simple linear regression analysis of expression levels as frequencies (%, top) or MFI (bottom) of gated mbIL-6R+ and pSTAT1+ or pSTAT3+ cells in naïve or memory CD4+ (non-Treg) T cells. (D) Summary data of simple linear regression analysis of expression levels as frequencies (left) or MFI (right) of gated mbIL-6R+ or the gMFI of gp130 and pSTAT1+ or pSTAT3+ cells in naïve or memory CD4+ (non-Treg) and CD8+ T cells. (A) Wilcoxon matched pairs signed rank test. (C, D) Linear regression analysis with Pearson’s correlation coefficients. n = 15.
Figure 3
Figure 3
Early transcriptomic response to IL-6 stimulation highlights pathways regulated by mbIL-6R signaling in human T cell subsets. (A-C) Transcriptome profiling of total CD4+ naïve, memory, and CD8+ naïve T cell subsets stimulated with IL-6 (20 ng/mL) or left unstimulated for 4 h was performed using RNA-seq. (A) Volcano plots showing differentially expressed genes between IL-6 stimulated versus unstimulated T cells. Shared up- and downregulated genes between subsets are highlighted (red). (B) Venn diagram of IL-6 up- (top) or downregulated (bottom) genes unique to or shared between T cell subsets. (C) Genes upregulated following IL-6 stimulation but not at baseline comparing CD4+ naïve versus memory or CD4+ naïve versus CD8+ naïve T cells. (A, B) FC > 1.5, FDR adj. P < 0.05. (C) FDR adj. P < 0.05. n = 16.
Figure 4
Figure 4
mbIL-6R signaling induced pSTAT1 responses are linked to T cell subset specific phenotypic changes. CD3-enriched T cells were stimulated with IL-6 (20 ng/mL) or left unstimulated for 24 h, and then change in expression levels of selected surface markers was determined via flow cytometry. (A) Heatmap showing the fold change in surface gMFI expression levels of selected markers following IL-6 stimulation over the unstimulated control in distinct CD4+ and CD8+ T cell subsets. (B) Simple linear regression analysis of the fold change in CD127 (left) and LDLR (right) expression and the magnitude of the pSTAT1 (top) and pSTAT3 (bottom) responses following IL-6 stimulation in naïve CD4+ (black dots) or CD62L+ TCM (white dots) cells and representative flow plot of IL-6 driven changes in CD127 and LDLR expression on gated naïve CD4+ T cells (bottom). (C) Paired analysis of gMFI expression levels of TIGIT, CD39, CD38, and CD25 among gated CD127loCD25hi Treg cells in the presence (+) or absence (-) of IL-6 stimulation. (A) 2-way ANOVA and Bonferroni’s multiple comparisons test, * FDR p < 0.05. (B) Linear regression analysis with Pearson’s correlation coefficients. (C) Wilcoxon matched-pairs signed rank test. n = 14-15.
Figure 5
Figure 5
mbIL-6R signaling drives phenotypic changes consistent with features observed in autoimmunity. (A, B, D) CD3-enriched T cells were stimulated with IL-6 (20 ng/mL) or left unstimulated for up to 72 h and the change in expression levels of selected surface and intracellular markers was determined via flow cytometry. (A) Fold change in gMFI expression levels of BCL6, RORγt, and T-bet (top) or of Th-related surface receptors (bottom) in naïve (CD45RA+) or memory (CD45RA-) CD4+ (non-Treg) T cells following IL-6 stimulation compared to unstimulated controls over time. (B) Paired analysis of the frequency of gated Th subsets in total naïve (CD45RA+) or memory (CD45RA-) CD4+ (non-Treg) T cells in IL-6 stimulated (+) or unstimulated (-) cells after 72 h of culture. (C) Naïve (CD45RA+) CD4+ T cells were cultured in conditions used to differentiate both Tfh and Th17 cells (IL-1β, IL-2, IL-23, TGF-β, α-CD3/CD28) in the presence (+) or absence (-) of IL-6 (20 ng/mL) for 5 days and changes in surface (CXCR5, ICOS) or intracellular markers (BCL6, T-bet) were determined via flow cytometry on gated live CD4+ T cells. Changes in cytokines from culture supernatants were detected by Luminex assay. Red line indicates median levels measured in Th0 conditions. (D) gMFI expression levels of BATF and IKAROS in gated naïve (CD45RA+) or memory (CD45RA-) CD4+ (non-Treg) T cells in IL-6 stimulated (+) or unstimulated (-) cells after 72 h of culture. (E) Frequency of IKAROS+ in memory CD4+ T cells as in (D) and representative flow plot of BCL6 and IKAROS expression in memory CD4+ T cells (top) and histogram of expression levels of BATF and RORγt among gated subsets defined by IKAROS and BCL6 expression. (A) Wilcoxon matched-pairs signed rank test comparing IL-6 stimulation to unstimulated control condition for each sample and each time-point. *p < 0.05, **p < 0.01 (B–E) Wilcoxon matched-pairs signed rank test. (A, B, D, E) n = 10. (C). n = 16.
Figure 6
Figure 6
Tocilizumab treatment decreases the frequency of PD-1hiCXCR5+ Tfh cells and modulates FAS/CD95 expression on memory CD4+ T cells. (A, B) Individuals enrolled in the EXTEND study were treated with tocilizumab (red line) or assigned to the placebo group (black line) and changes in T cell phenotypes were assessed over time via flow cytometry. (A) Representative flow plot (left) of gating strategy to define PD-1hiCXCR5+ Tfh and PD-1hi CXCR5- Tph cells and (right) changes in frequencies of Tfh and Tph cells over time. Time frame of tocilizumab treatment during 24 weeks is indicated by gray shading. (B) Frequencies of CCR7+CD95+ and CCR7+CD95- memory CD4+ (non-Treg) T cells over time in the tocilizumab-treated versus placebo group. (A, B) Plots show mean values and error bars indicate the standard error of the mean (SEM). Significance between pre-treatment baseline (week 0) and respective visits was calculated through the Wilcoxon matched pairs signed rank test. (A) n = 23-26 (placebo group); n = 50-53 (tocilizumab group). (B) n = 24-26 (placebo group); n = 50-53 (tocilizumab group).
Figure 7
Figure 7
mbIL-6R rs2228145 genotype determines pSTAT1 response to IL-6 and is linked to ex vivo phenotypic differences in CD4+ T cells. CD3-enriched T cells from carriers of the mbIL-6Rhi/A or mbIL-6Rlo/C allele were (A, C–F) left unstimulated or (B, C) stimulated with IL-6 (20 ng/mL) for 30 min and surface markers or the pSTAT1 and pSTAT3 response were determined by flow cytometry. (A) Frequency of gated mbIL-6R+ cells at baseline in naïve (CD45RA+) or memory (CD45RA-) CD4+ (non-Treg) T cells. (B) Representative flow plots (left) and summary data (right) of the frequencies of pSTAT1+ (top) and pSTAT3+ (bottom) cells in memory (CD45RA-) CD4+ (non-Treg) T cells. (C) Simple linear regression analysis of the frequencies of mbIL-6R+ and pSTAT1+ memory CD4+ (non-Treg) T cells. (D) Frequency of Tfh1/17 cells among memory CD4+ (non-Treg) T cells or (E, F) gMFI expression levels of CD38, CCR4, CD127 and CD95/FAS in gated mbIL-6R+ or mbIL-6R- TEM cells after 24 h in culture in the absence of stimulation. (G) CD3-enriched T cells were treated with agonistic FAS antibody or left untreated for 24 h and the change in the frequency of Annexin V+ cells in gated CD4+CD45RA-CD27-CD62L-IL-6R+ TEM cells was determined by flow cytometry. (A, B, D–G) Mann-Whitney test. (C) Linear regression analysis with Pearson’s correlation coefficients. (A–C, G) Pooled data from 2 independent experiments. Data from one experiment. (A) n = 20, (B, C) n = 9-10, (D–F) n = 15, (G) n = 10.

Similar articles

References

    1. Jones BE, Maerz MD, Buckner JH. IL-6: A Cytokine at the Crossroads of Autoimmunity. Curr Opin Immunol (2018) 55:9–14. doi: 10.1016/j.coi.2018.09.002 - DOI - PMC - PubMed
    1. Korn T, Hiltensperger M. Role of IL-6 in the Commitment of T Cell Subsets. Cytokine (2021) 146:155654. doi: 10.1016/j.cyto.2021.155654 - DOI - PMC - PubMed
    1. Li B, Jones LL, Geiger TL. IL-6 Promotes T Cell Proliferation and Expansion Under Inflammatory Conditions in Association With Low-Level RORgammat Expression. J Immunol (2018) 201(10):2934–46. doi: 10.4049/jimmunol.1800016 - DOI - PMC - PubMed
    1. Rochman I, Paul WE, Ben-Sasson SZ. IL-6 Increases Primed Cell Expansion and Survival. J Immunol (2005) 174(8):4761–7. doi: 10.4049/jimmunol.174.8.4761 - DOI - PubMed
    1. Bettelli E, Carrier Y, Gao W, Korn T, Strom TB, Oukka M, et al. . Reciprocal Developmental Pathways for the Generation of Pathogenic Effector TH17 and Regulatory T Cells. Nature (2006) 441(7090):235–8. doi: 10.1038/nature04753 - DOI - PubMed

Publication types