. 2022 Jul 13:13:936918.
doi: 10.3389/fimmu.2022.936918. eCollection 2022.

Distinct Type I Interferon Subtypes Differentially Stimulate T Cell Responses in HIV-1-Infected Individuals

Affiliations

Distinct Type I Interferon Subtypes Differentially Stimulate T Cell Responses in HIV-1-Infected Individuals

Zehra Karakoese et al. Front Immunol. .

Abstract

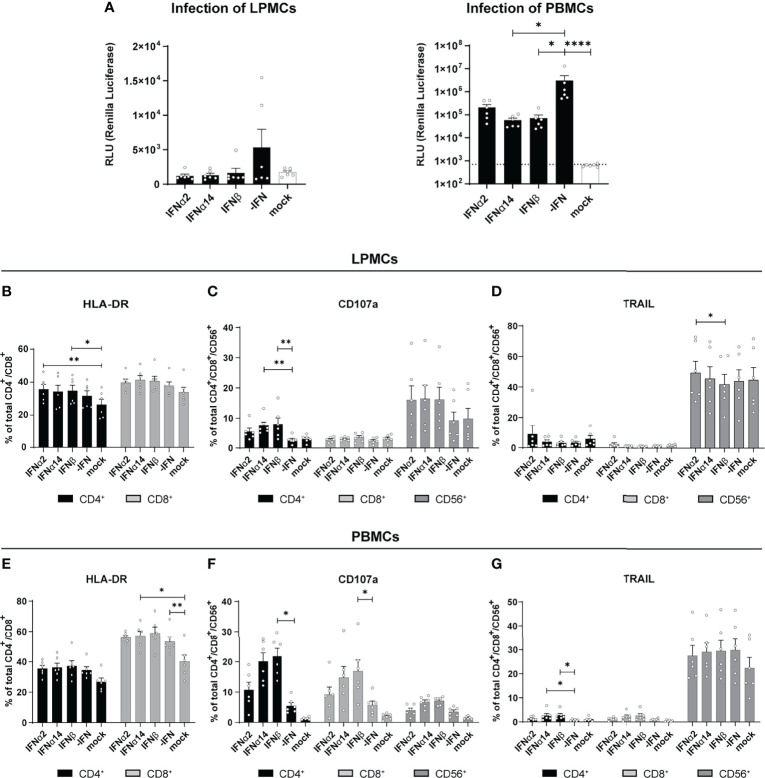
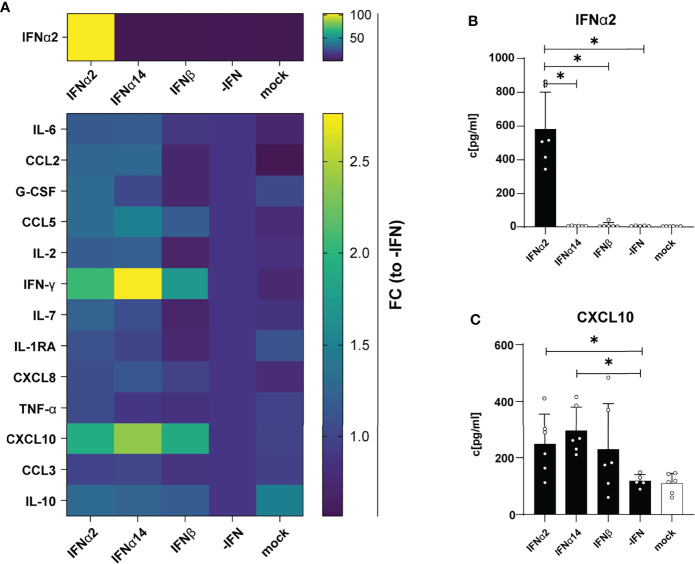
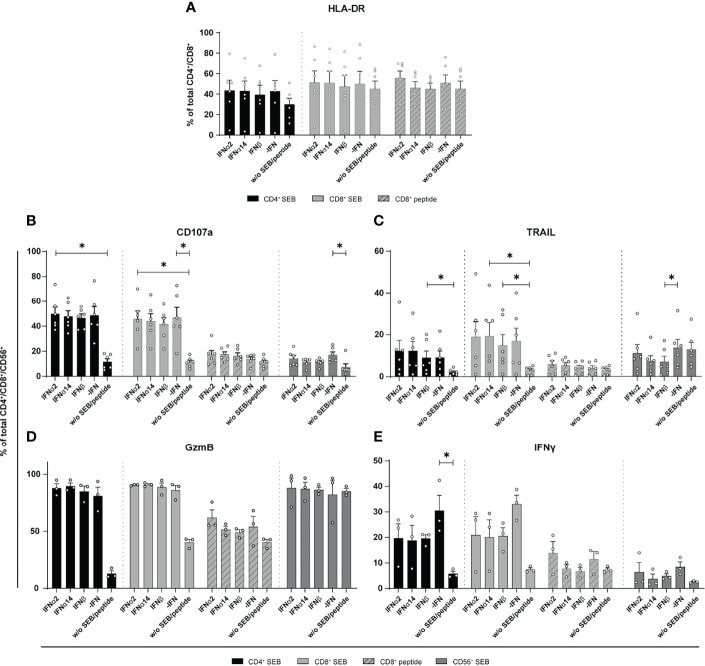
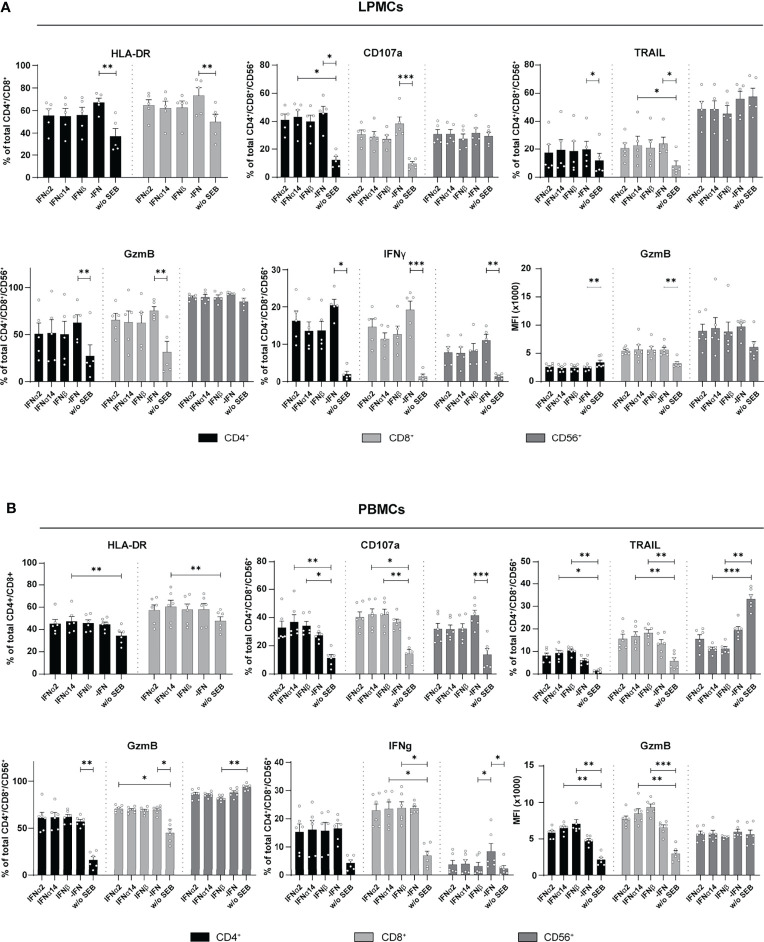
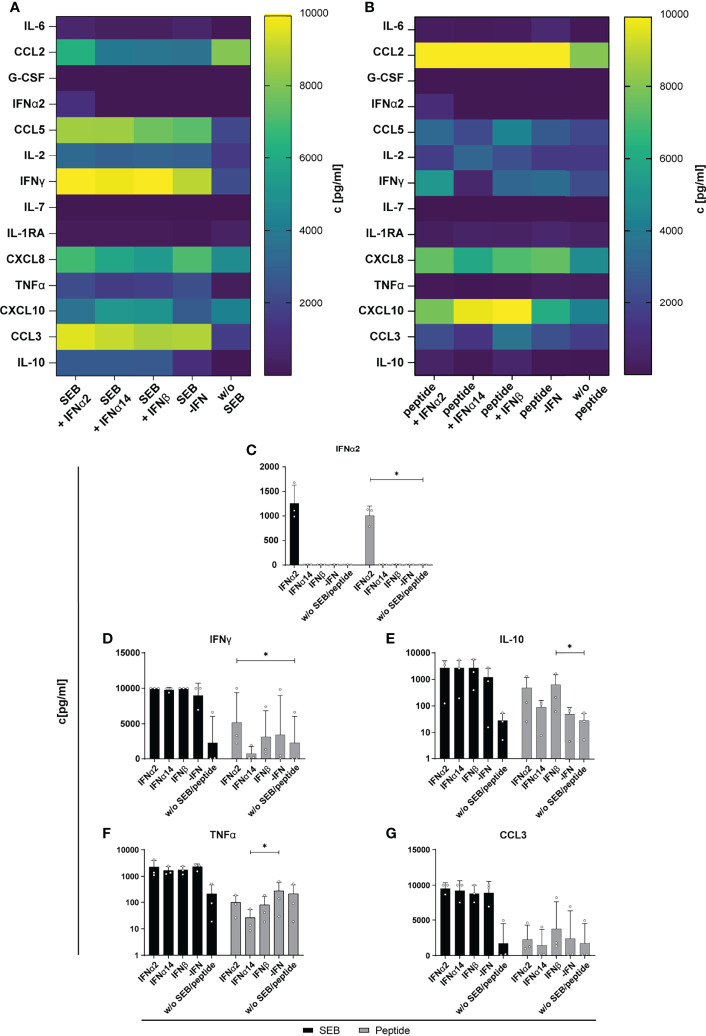
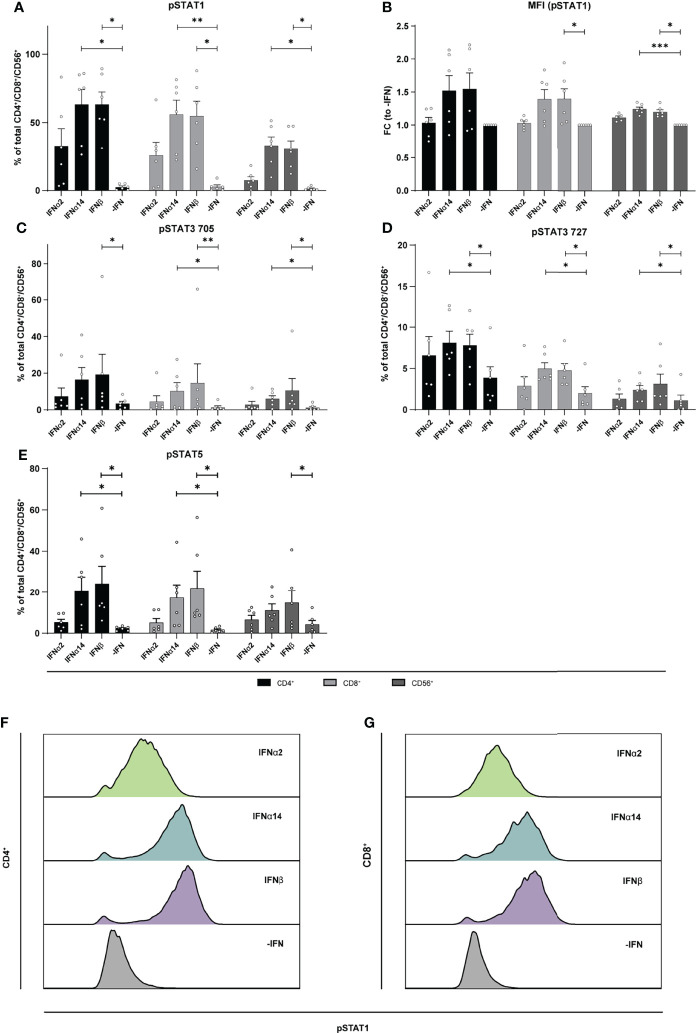
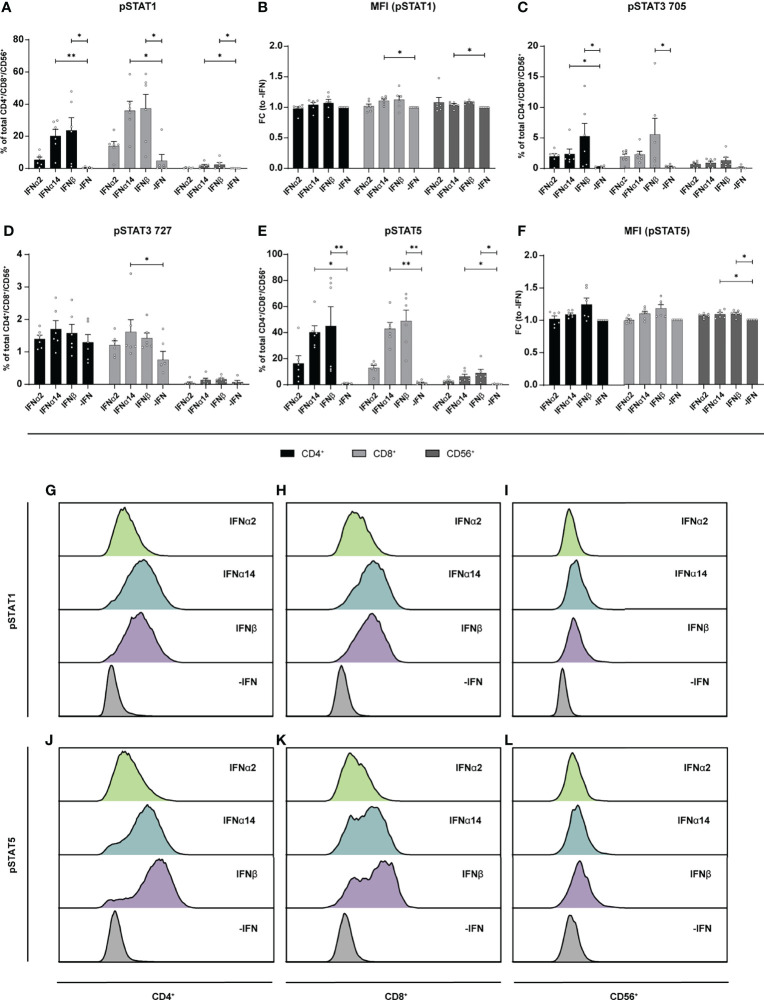
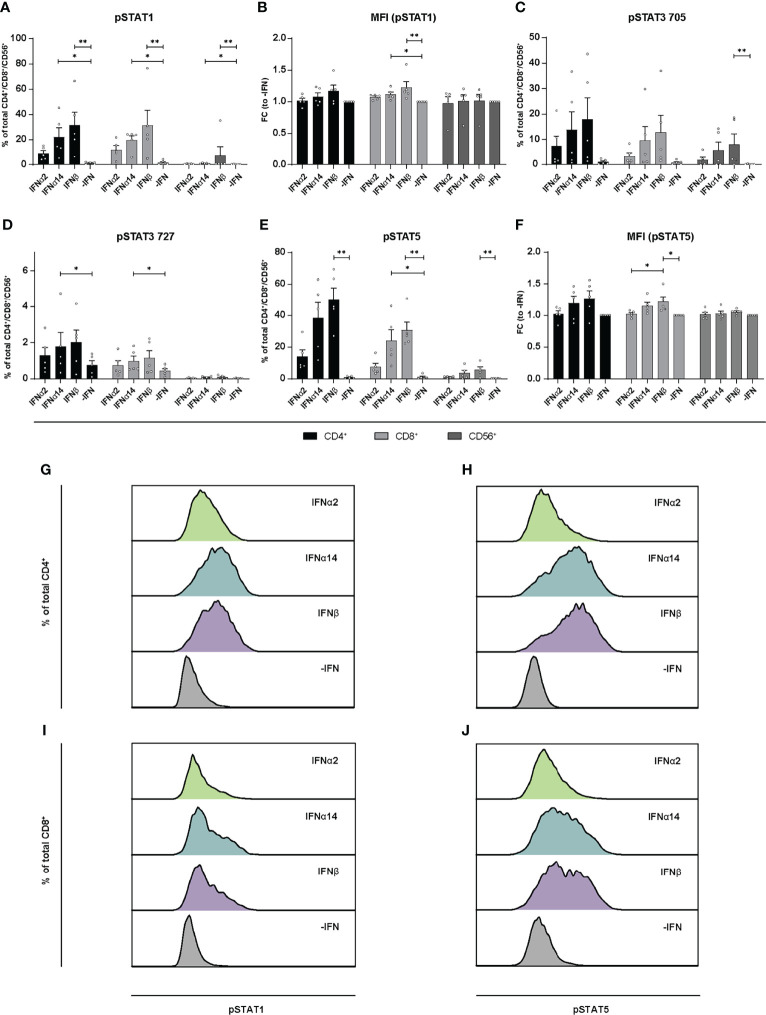
The expression of type I interferons (IFNs) is one of the immediate host responses during most viral infections. The type I IFN family consists of numerous highly conserved IFNα subtypes, IFNβ, and some others. Although these IFNα subtypes were initially believed to act interchangeably, their discrete biological properties are nowadays widely accepted. Subtype-specific antiviral, immunomodulatory, and anti-proliferative activities were reported explained by differences in receptor affinity, downstream signaling events, and individual IFN-stimulated gene expression patterns. Type I IFNs and increased IFN signatures potentially linked to hyperimmune activation of T cells are critically discussed for chronic HIV (human immunodeficiency virus) infection. Here, we aimed to analyze the broad immunological effects of specific type I IFN subtypes (IFNα2, IFNα14, and IFNβ) on T and NK cell subsets during HIV-1 infection in vitro and ex vivo. Stimulation with IFNα14 and IFNβ significantly increased frequencies of degranulating (CD107a+) gut-derived CD4+ T cells and blood-derived T and NK cells. However, frequencies of IFNγ-expressing T cells were strongly reduced after stimulation with IFNα14 and IFNβ. Phosphorylation of downstream molecules was not only IFN subtype-specific; also, significant differences in STAT5 phosphorylation were observed in both healthy peripheral blood mononuclear cells (PBMCs) and PBMCs of HIV-infected individuals, but this effect was less pronounced in healthy gut-derived lamina propria mononuclear cells (LPMCs), assuming cell and tissue specific discrepancies. In conclusion, we observed distinct type I IFN subtype-specific potencies in stimulating T and NK cell responses during HIV-1-infection.

Keywords: CD4+ T cells; CD8+ T cells; HIV; LPMCs; NK cells; type I IFNs.


Conflict of interest statement

The authors declare that the research was conducted in the absence of any commercial or financial relationships that could be construed as a potential conflict of interest.

Figures

Figure 1
Figure 1
Immune cell activation and cytokine expression after IFN treatment of in vitro infected LPMCs and PBMCs with HIV. LPMCs and PBMCs from healthy individuals were exposed to X4-HIV-1NL4-3-IRES-Ren or mock treated with medium and subsequently treated with 2000 U/ml IFNα2, IFNα14, or IFNβ. Cells were lysed 4 dpi and viral loads were determined by the relative light units (RLUs). (A) Inhibition of HIV replication by different IFNs in vitro. Additionally, flow cytometric analysis was performed to analyze immune responses by IFNα2, IFNα14, and IFNβ. (B–D) Frequencies of HLA-DR+, CD107a+, and TRAIL+ T and/or NK cells in LPMCs. (E–G) Frequencies of HLA-DR+, CD107a+, and TRAIL+ T and/or NK cells in PBMCs. Mean values ± SEM are shown for n=6. Statistical analyses between the treated groups within a cell population were done by using Friedman test and Dunn’s multiple comparison test. ****, P < 0.0001; **, P < 0.01; *, P < 0.05.
Figure 2
Figure 2
Cytokine and chemokine profile in supernatants from HIV- and mock-infected LPMCs after different IFN treatment. LPMCs were infected with X4-HIV-1NL4-3-IRES-Ren or mock treated with medium and treated with 2000 U/ml IFNα2, IFNα14, IFNβ, or without IFN (-IFN). Supernatants were harvested 4 dpi and 14 cytokines and chemokines were analyzed simultaneously by a multiplex bead-based assay. (A) Averaged fold changes (FC) of each individual donor of IFNα2, IL-6, CCL2, G-CSF, CCL5, IL-2, IFNγ, IL-7, IL-1RA, CXCL8, TNFα, CXCL10, CCL3, and IL-10 expression of HIV-infected LPMCs after stimulation with type I IFN subtypes relative to HIV-infected, non-treated LPMCs (-IFN). (B, C) Absolute quantification of IFNα2, and CXCL10 in supernatants of HIV-infected LPMCs treated with IFNα2, IFNα14, IFNβ, or without IFN (-IFN). Mean values ± SEM are shown for n=6. Statistical analyses between the treated groups within a cell population were performed by using Friedman test and Dunn’s multiple comparison test. *, P < 0.05.
Figure 3
Figure 3
Expression of cytotoxic molecules by in vitro stimulated T and NK cells of PBMCs from cART treated PLWH. PBMCs from cART-treated PLWH were stimulated either with 200 ng/ml SEB or with 1 µg/ml of an HLA class I restricted HIV peptide pool in presence of 2000 U/ml IFNα2, IFNα14, IFNβ, or without IFN (-IFN) for 4 days. PBMCs were re-stimulated with 5 µg/ml SEB or 1 µg/ml peptide pool respectively and incubated in presence of antibodies against the co-stimulatory molecules CD28 and CD49d for 6 h BFA was added after 1 h of stimulation. Flow cytometry was used to analyze T cell activation and cytokine expression. (A) Activation profile determined by the frequencies of HLA-DR+ CD4+ and CD8+ T cells with or without stimulation in the presence or absence of the different IFNs. (B–E) Frequencies of the cytotoxic molecules CD107a, TRAIL, GzmB, and IFNγ expressed on CD4+, CD8+ T cells, and CD56+ NK cells. Mean values ± SEM are shown for (A–C) n=6 and (D, E) n=3. Statistical analyses between the treated groups within a cell population were done by using Friedman test and Dunn’s multiple comparison test. *, P < 0.05.
Figure 4
Figure 4
Cytokine expression after IFN treatment of LPMCs, and PBMCs from healthy individuals. (A) LPMCs and (B) PBMCs from healthy individuals were stimulated as described before with SEB and treated with either 2000 U/ml IFNα2, IFNα14, IFNβ, or without IFN (-IFN). frequencies of HLA-DR, CD107a, TRAIL, GzmB, and IFNγ expressing cells as well as GzmB expression per cell shown as MFI after treatment of SEB-treated PBMCs and LPMCs. Mean values ± SEM are shown for (A) n=5 and (B) n=6. Statistical analyses were done by using Friedman test and Dunn’s multiple comparison test. ***, P < 0.001; **, P < 0.01; *, P < 0.05.
Figure 5
Figure 5
Cytokine and chemokine profile in supernatants of SEB and HIV peptide pool stimulated PBMCs from PLWH. PBMCs from cART-treated PLWH were stimulated as described in Figure 3 with SEB or HIV peptide pool and treated with either 2000 U/ml IFNα2, IFNα14, IFNβ, or without IFN (-IFN). On day 4 supernatants were collected for multiplex bead-based assay to quantify cytokines and chemokines. (A) Heatmap of IL-6, CCL2, G-CSF, IFNα2, CCL5, IL-2, IFNγ, IL-7, IL-1RA, CXCL8, TNFα, CXCL10, CCL3, and IL-10 concentrations in pg/ml after stimulation with SEB or (B) HIV peptide pool. (C–G) Concentration of IFNα2, IFNγ, IL-10, TNFα, and CCL3 in supernatants of SEB or HIV peptide pool stimulated PBMCs from PLWH after different IFN treatment. Mean values ± SEM are shown for n=3. Statistical analyses between the treated groups within a cell population were done by Friedman test and Dunn’s multiple comparison test. *, P < 0.05.
Figure 6
Figure 6
Phosphorylation of STAT molecules after IFN stimulation in LPMCs. LPMCs were stimulated with 2000 U/ml IFNα2, IFNα14, IFNβ, or without IFN (-IFN) in presence of the surface markers anti-CD3, anti-CD4, anti-CD8, anti-CD56, and the viability marker FVD. Cells were then fixated and permeabilized for phosphoflow analysis with anti-STAT1 pTyr702, anti-STAT5 pTyr694, anti-STAT3 pTyr705, and anti-STAT3 pSer727. (A) Frequencies of phosphorylated STAT1, (B) mean donor-specific fold changes of MFI (pSTAT1) (C) frequencies of phosphorylated STAT3 pTyr705, (D) STAT3 pSer727, and (E) STAT5 on CD4+, CD8+ T, and NK cells. Mean values ± SEM are shown for n=6. Statistical analyses between the treated groups within a cell population were done by using Friedman test and Dunn’s multiple comparison test. ***, P < 0.001; **, P < 0.01; *, P < 0.05. (F) Representative histograms of phosphorylated STAT1 expression by unstimulated or IFN-stimulated CD4+ and (G) CD8+ T cells.
Figure 7
Figure 7
Phosphorylation of STAT molecules after IFN stimulation in PBMCs. PBMCs from healthy donors were stimulated with 2000 U/ml IFNα2, IFNα14, IFNβ, or without IFN (-IFN) in presence of the surface markers anti-CD3, anti-CD4, anti-CD8, anti-CD56, and the viability marker FVD. Cells were then fixated and permeabilized for phosphostaining with anti-STAT1 pTyr702, anti-STAT5 pTyr694, anti-STAT3 pTyr705, and anti-STAT3 pSer727. (A) Frequencies of phosphorylated STAT1, (B) mean donor-specific fold changes of MFI (pSTAT1) (C) frequencies of phosphorylated STAT3 pTyr705, (D) STAT3 pSer727, (E) STAT5, and (F) mean donor-specific fold changes of MFI (pSTAT5) on CD4+, CD8+ T, and NK cells. Mean values ± SEM are shown for n=6. Statistical analyses between the treated groups within a cell population were done by using Friedman test and Dunn’s multiple comparison test. **, P < 0.01; *, P < 0.05. (G) Representative histograms of phosphorylated STAT1 expression by unstimulated or IFN-stimulated CD4+, (H) CD8+ T cells, and (I) NK cells as well as (J) phosphorylated STAT5 expression by CD4+, (K) CD8+ T cells, and (L) NK cells.
Figure 8
Figure 8
Phosphorylation of STAT molecules after IFN stimulation in PBMCs from PLWH. PBMCs from PLWH were stimulated with 2000 U/ml IFNα2, IFNα14, IFNβ, or without IFN (-IFN) in presence of the surface markers anti-CD3, anti-CD4, anti-CD8, anti-CD56, and the viability marker FVD. Cells were then fixated and permeabilized for phosphostaining with anti-STAT1 pTyr702, anti-STAT5 pTyr694, anti-STAT3 pTyr705, and anti-STAT3 pSer727. (A) Frequencies of phosphorylated STAT1, (B) mean donor-specific fold changes of MFI (pSTAT1) (C) frequencies of phosphorylated STAT3 pTyr705, (D) STAT3 pSer727, (E) STAT5, and (F) mean donor-specific fold changes of MFI (pSTAT5) on CD4+, CD8+ T, and NK cells. Mean values ± SEM are shown for n=5. Statistical analyses between the treated groups within a cell population were done by using Friedman test and Dunn’s multiple comparison test. **, P < 0.01; *, P < 0.05. (G, H) Representative histograms of phosphorylated STAT1 and STAT5 expression by unstimulated or IFN-stimulated by CD4+ T cells, and (I, J) CD8+ T cells.

Similar articles

Cited by

References

    1. Cull VS, Tilbrook PA, Bartlett EJ, Brekalo NL, James CM. Type I Interferon Differential Therapy for Erythroleukemia: Specificity of STAT Activation. Blood (2003) 101:2727–35. doi: 10.1182/blood-2002-05-1521 - DOI - PubMed
    1. Lavender KJ, Gibbert K, Peterson KE, Van Dis E, Francois S, Woods T, et al. . Interferon Alpha Subtype-Specific Suppression of HIV-1 Infection In Vivo . J Virol (2016) 90:6001–13. doi: 10.1128/JVI.00451-16 - DOI - PMC - PubMed
    1. Chen J, Li Y, Lai F, Wang Y, Sutter K, Dittmer U, et al. . Functional Comparison of Interferon-Alpha Subtypes Reveals Potent Hepatitis B Virus Suppression by a Concerted Action of Interferon-Alpha and Interferon-Gamma Signaling. Hepatology (2021) 73:486–502. doi: 10.1002/hep.31282 - DOI - PubMed
    1. Schuhenn J, Meister TL, Todt D, Bracht T, Schork K, Billaud JN, et al. . Differential Interferon-Alpha Subtype Induced Immune Signatures are Associated With Suppression of SARS-CoV-2 Infection. Proc Natl Acad Sci U.S.A. (2022) 119(8):e2111600119. doi: 10.1073/pnas.2111600119 - DOI - PMC - PubMed
    1. Dickow J, Francois S, Kaiserling RL, Malyshkina A, Drexler I, Westendorf AM, et al. . Diverse Immunomodulatory Effects of Individual IFNalpha Subtypes on Virus-Specific CD8(+) T Cell Responses. Front Immunol (2019) 10:2255. doi: 10.3389/fimmu.2019.02255 - DOI - PMC - PubMed

Publication types