. 2022 Jul 14:13:906217.
doi: 10.3389/fimmu.2022.906217. eCollection 2022.

Two Step Selection for Bias in β Chain V-J Pairing

Affiliations

Two Step Selection for Bias in β Chain V-J Pairing

Reut Levi et al. Front Immunol. .

Abstract

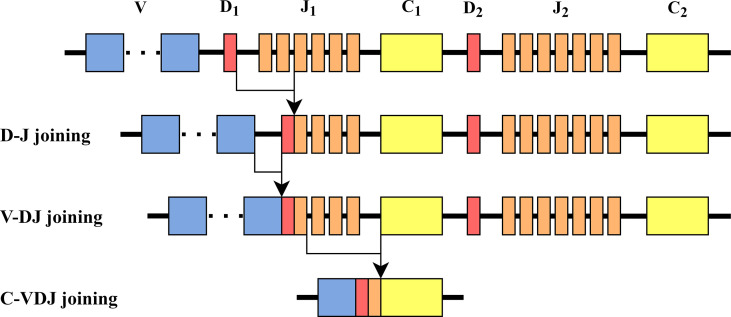
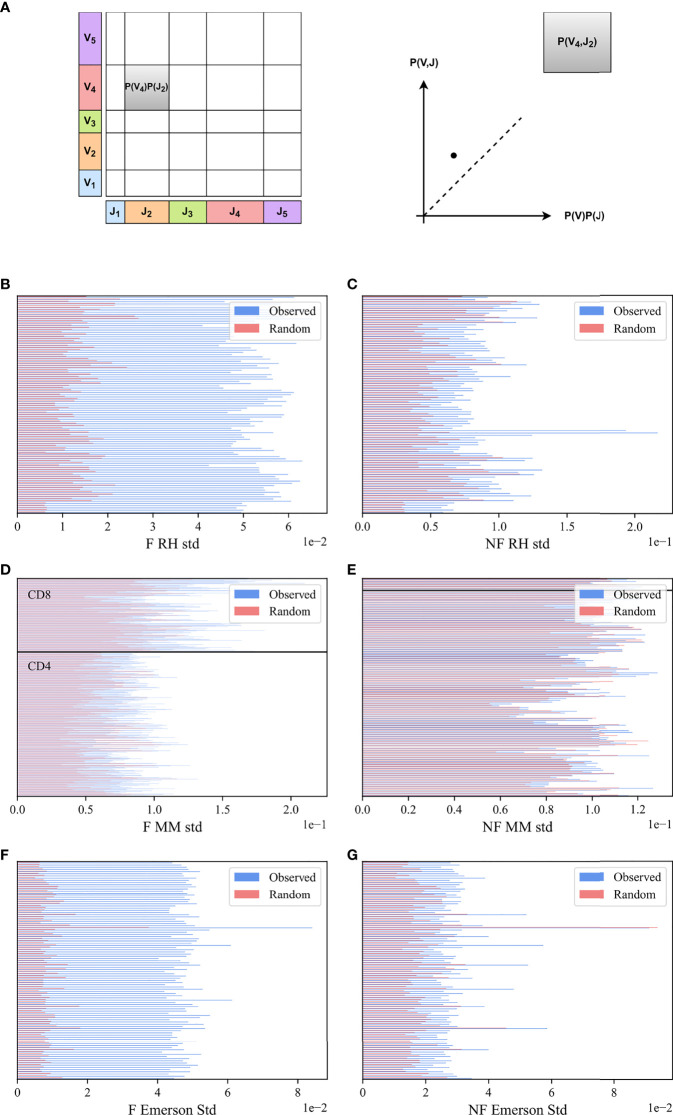
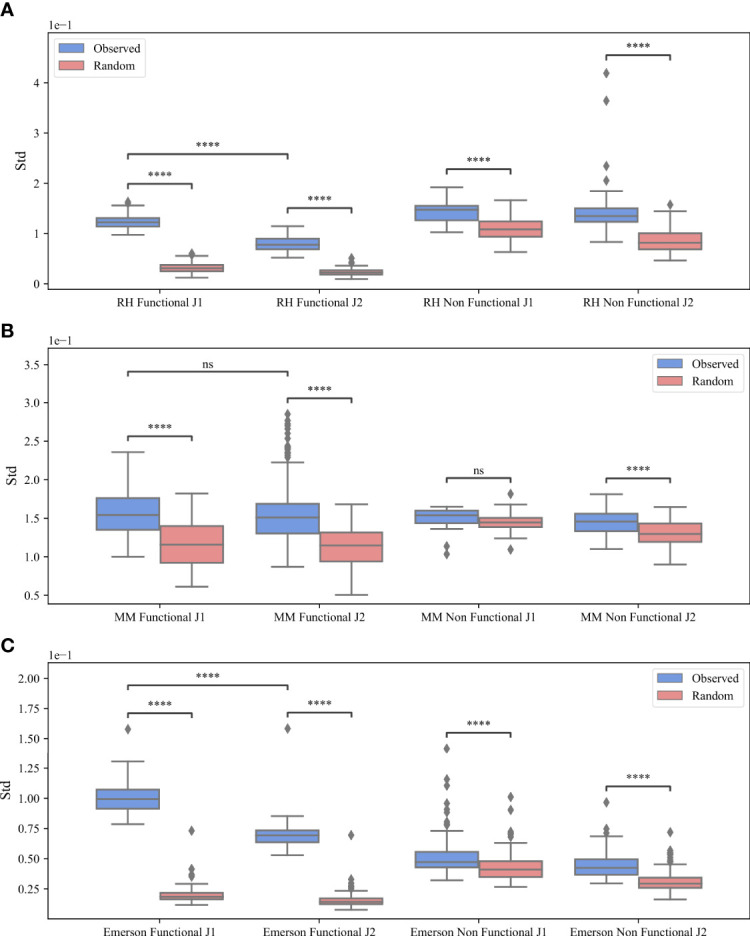
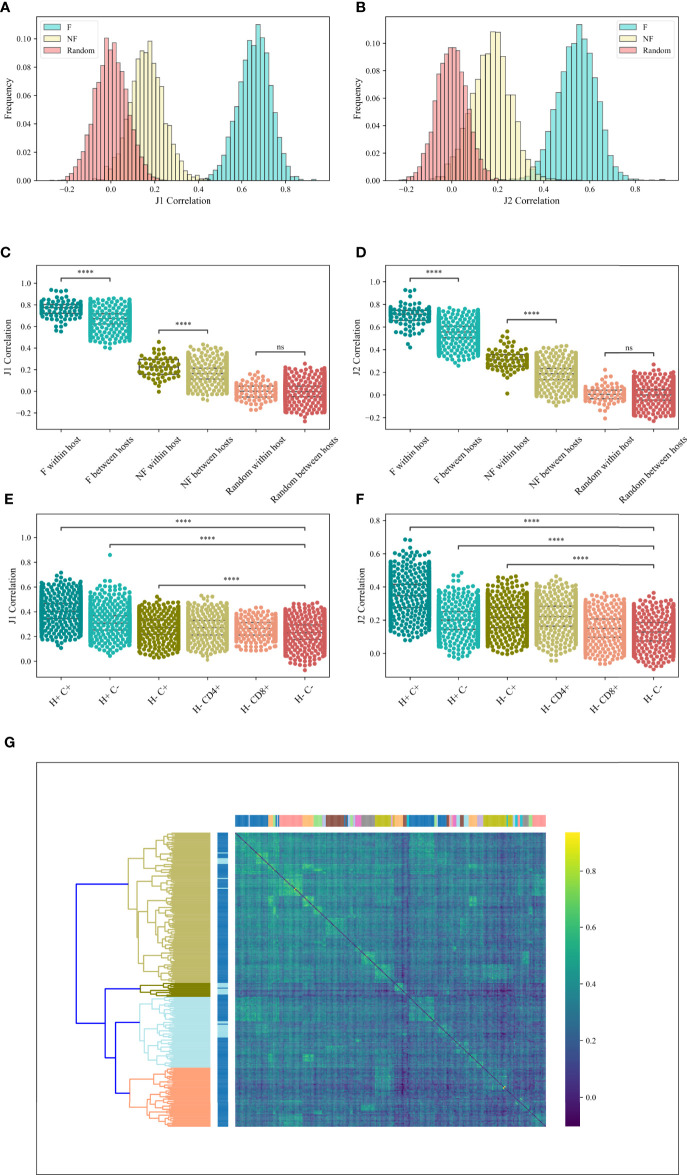
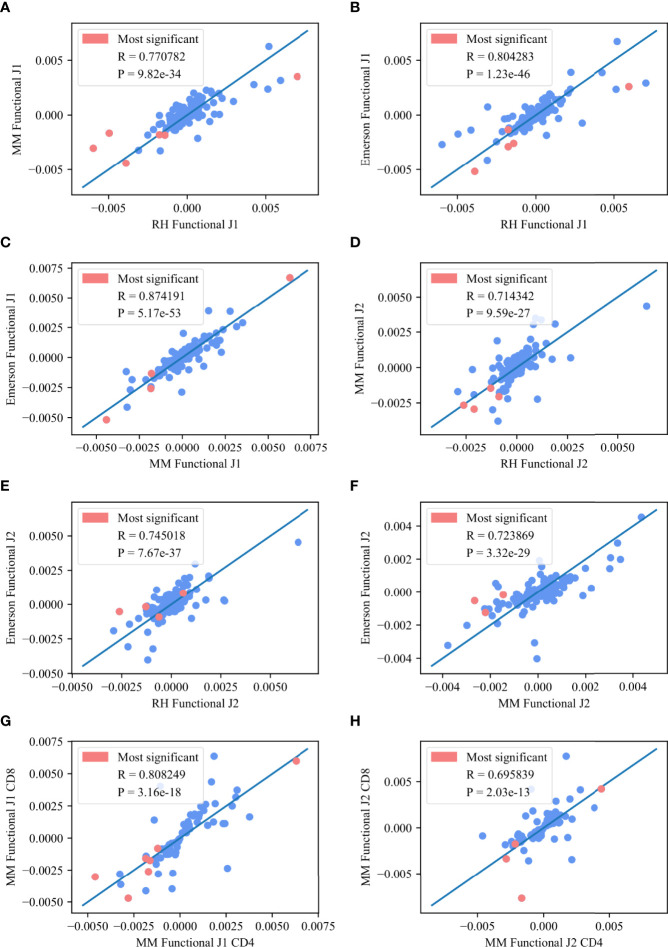
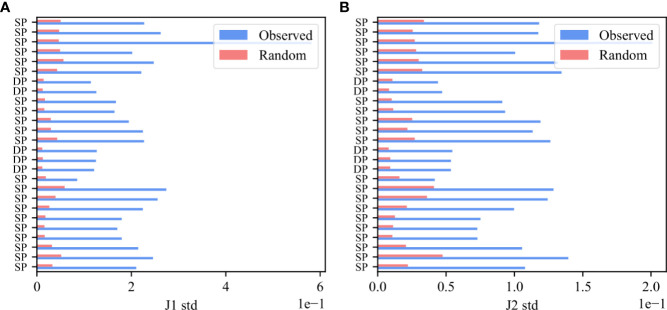
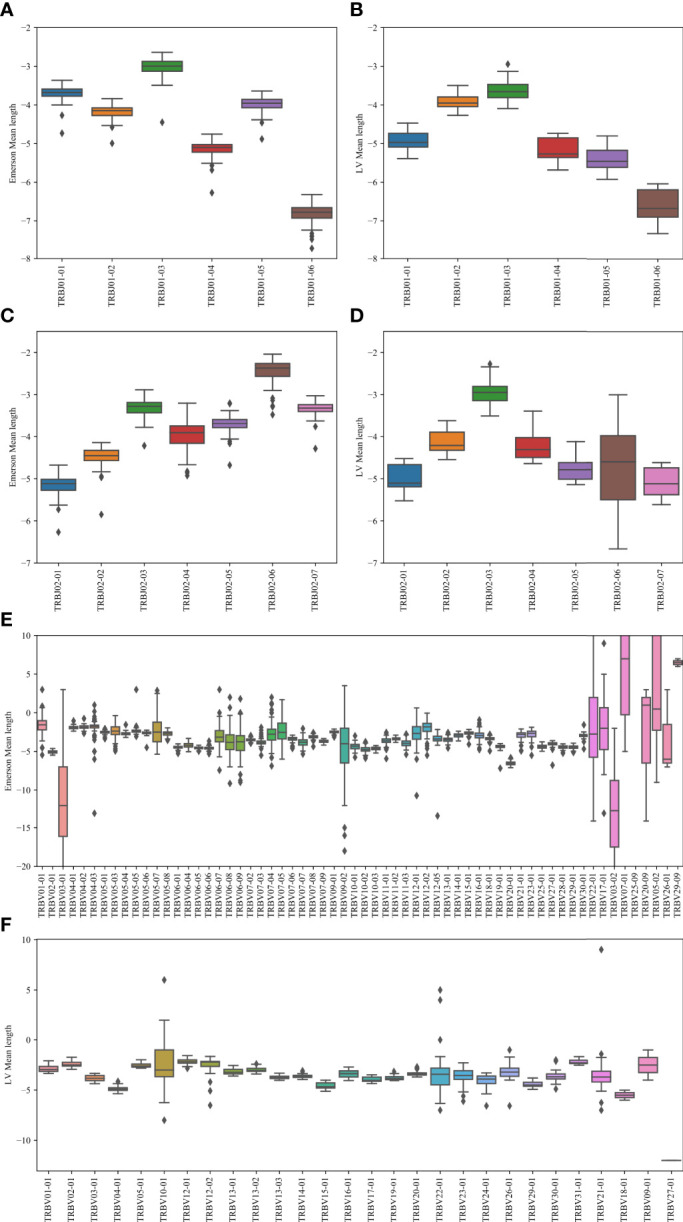
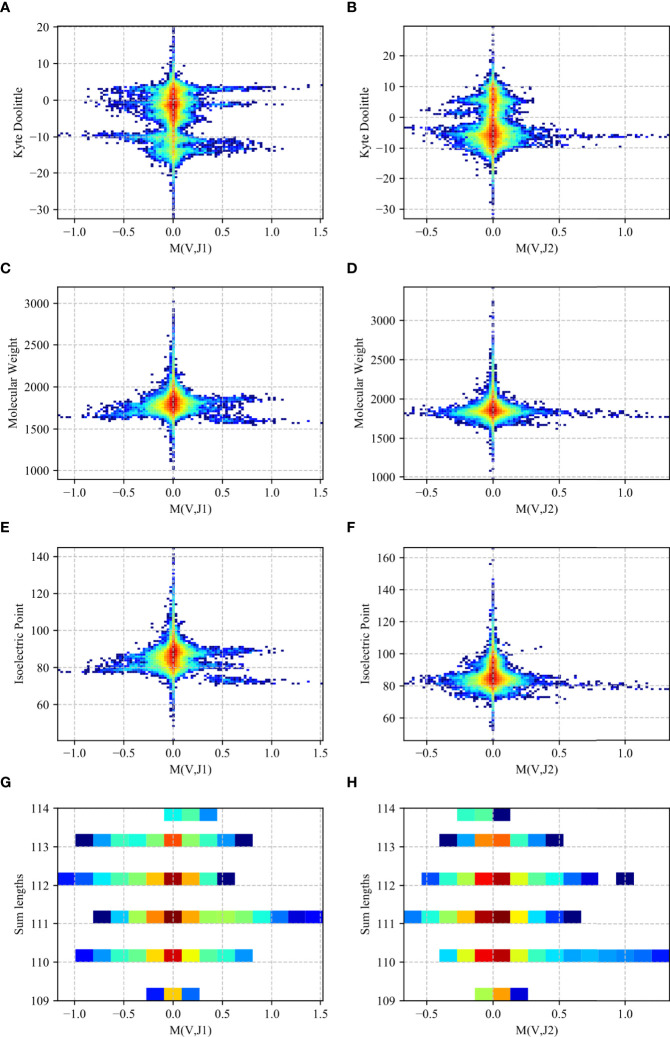
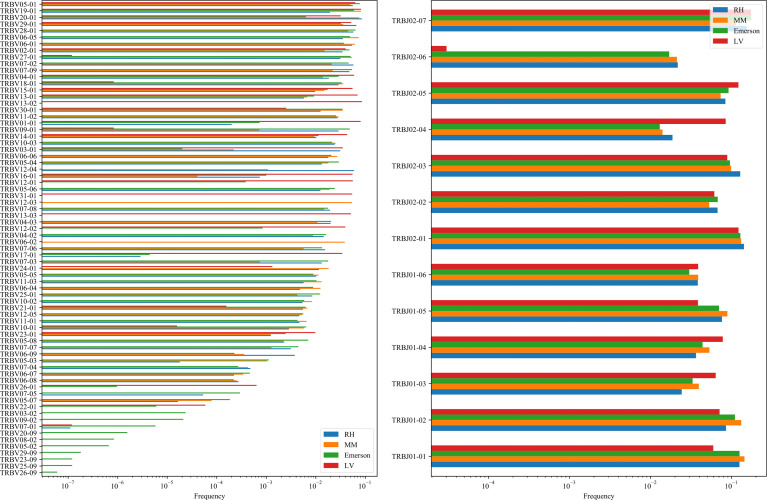
The β chain rearrangement in T cells is a two-step process where first Dβ and Jβ bind, and only then Vβ is joined to the complex. We here show that the frequency of human and mouse Vβ Jβ combinations deviates from the one expected based on each gene usage frequency. This bias is observed mainly in functional (F) rearrangements, but also slightly in non-functional (NF) rearrangements. Preferred Vβ Jβ combinations in F clones are shared between donors and samples, suggesting a common structural mechanism for these biases in addition to any host-specific antigen-induced peripheral selection. The sharing holds even in clones with J β 1 that share the same Dβ 1 gene. Vβ Jβ usage is correlated with the Molecular Weight and Isoelectric Point in F clones. The pairing is also observed in the Double Positive cells in mice thymocytes, suggesting that the selection leading to such a pairing occurs before thymic selection. These results suggest an additional structural checkpoint in the beta chain development prior to thymic selection during the T cell receptor expression. Understanding this structural selection is important for the distinction between normal and aberrant T cell development, and crucial for the design of engineered TCRs.

Keywords: TCR beta chain CDR3 repertoire; TCR repertoire; V-D-J rearrangement; junction length; selection.


Conflict of interest statement

The authors declare that the research was conducted in the absence of any commercial or financial relationships that could be construed as a potential conflict of interest. t:

Figures

Figure 1
Figure 1
TCR β chain rearrangement. First, Dβ and Jβ are bound, then Vβ is bound to Dβ Jβ , and then Vβ Dβ Jβ is bound to Cβ . The structure of the β chain in mice is similar to the one in humans.
Figure 2
Figure 2
M (Vβ , Jβ ) bias. (A) Schematic explanation M (Vβ , Jβ ) measure. We computed the marginal frequency in a sample of Jβ and Vβ (X and Y axes), defined to be the fraction of clones using each. We then computed their product (size of rectangles), and compared this product with the actual number of clones that use a given Vβ , Jβ pair. (B, C) The standard deviation of M (Vβ , Jβ ) values for the RH dataset. The blue bars describe the real F clones values (B) and the real NF clones values (C) while the pink bars represent the null model. (D, E) The standard deviation of M (Vβ , Jβ ) values for the MM dataset, with the same colors. All samples above the black line are CD8 T-cells, and below are CD4 T-cells. (F, G) Same results for the Emerson dataset.
Figure 3
Figure 3
M (Vβ , Jβ ) bias. The standard deviation of M (Vβ , Jβ ) values for the RH dataset (A), the MM dataset (B) and the Emerson dataset (C). The x-axis represents whether the clones are functional or non-functional and the different Jβ gene families, while the y-axis represents the standard deviation. The blue boxes describe the real clones values and the pink boxes represent the randomly generated clones. The boxes extend from the Q1 to Q3 quartile values of the data, with a line at the median (Q2). The whiskers extend from the edges of the box to show the range of the data, they extend to 1.5 * IQR (IQR = Q3 - Q1) from the edges of the box, ending at the farthest data point within that interval. Outliers are plotted as separate dots. A T-test was performed to test how significant the differences between the observed and random standard deviation of the M (Vβ , Jβ ) values are, where ****p-value < 0.0001, ***p-value < 0.001, **p-value < 0.01, *p-value < 0.05 and ns p-value > = 0.05.
Figure 4
Figure 4
M (Vβ , Jβ ) correlation. (A, B) The correlations histogram of the M (Vβ , Jβ ) values for the Jβ 1 family gene (A) and the Jβ 2 family gene (B) in the RH dataset. The blue histogram represents the F clones, the beige histogram is the NF clones and the pink histogram represents the null model. (C, D) Correlations of M (Vβ , Jβ ) values for the Jβ 1 family gene (C) and the Jβ 2 family gene (D) in the RH dataset within host and between hosts for F, NF and random clones. Star symbols follow the previous plot. (E, F) Correlations of M (Vβ , Jβ ) values for the Jβ 1 family gene (E) and the Jβ 2 family gene (F) in the MM dataset, where H+ represents within host, H- represents between hosts, C+ represents within compartment, C- represents between compartments. (G) Heatmap of the correlations of M (Vβ , Jβ ) values for the M Jβ 1 family gene of the F clones in the MM data set. At the top we colored according to a patient, while on the left we colored according to the compartments (CD4 or CD8).
Figure 5
Figure 5
Deviation from random pairing. (A–F) M (Vβ , Jβ ) values between any two functional datasets for the Jβ 1 family gene (A–C) and the Jβ 2 family gene (D–F). The pink points represent the common pairs of the 10 most significant pairs between these two datasets. (G, H) M (Vβ , Jβ ) values for the CD8 T-cells in the MM functional for the M Jβ 1 family gene (G) and the Jβ 2 family gene (H) asa function of M (Vβ , Jβ ) values for the CD4 T-cells in the MM functional for the same family gene. The pink points represent the common pairs of the 10 most significant pairs between these two data sets.
Figure 6
Figure 6
Bias in Double Positive samples in mice thymocytes. The standard deviation of M (Vβ , Jβ ) values for the Jβ 1 family gene (A) and for the Jβ 2 family gene (B). The blue bars describe the F clones values and the pink bars represent the null model.
Figure 7
Figure 7
Junction length. In the Jβ plots, the junction length is the average distance between the beginning of the germline Jβ gene, and the end of the germline Dβ gene. In the Vβ plot, the difference is between the Vβ germline and the Dβ germline genes. (A, B) The mean distance for the Emerson dataset (A) and for the LV dataset (B). The x-axis represents the various Jβ genes within the Jβ 1 family gene. (C, D) The mean distance values for the Emerson dataset (C) and for the LV dataset (D). The x-axis represents the various Jβ genes within the Jβ 2 family gene. (E, F) The mean distance values for the Emerson dataset (E) and for the LV dataset (F). The x-axis represents the various Vβ genes within the Jβ 1 family gene. The interpretation of the boxes follows the previous plots.
Figure 8
Figure 8
Two-dimensional histogram (RH dataset). 2D histogram where the x-axis represents the M (Vβ , Jβ ) values for the Jβ 1 family gene (A, C, E, G) and the Jβ 2 family gene (B, D, F, H) while the y-axis represents the Kyte-Doolittle values (A, B), Molecular Weight values (C, D), Isoelectric Point values (E, F) and the sum of the gene lengths values (G, H). The colors represent the fraction of clones with such a value. Blue colors are low frequencies, while red colors are high.
Figure 9
Figure 9
Vβ (A) and Jβ (B) distribution.

Similar articles

Cited by

References

    1. Wucherpfennig KW, Call MJ, Deng L, Mariuzza R. Structural Alterations in Peptide–Mhc Recognition by Self-Reactive T Cell Receptors. Curr Opin Immunol (2009) 21:590–5. doi: 10.1016/j.coi.2009.07.008 - DOI - PMC - PubMed
    1. Deng L, Mariuzza RA. Recognition of Self-Peptide–Mhc Complexes by Autoimmune T-Cell Receptors. Trends Biochem Sci (2007) 32:500–8. doi: 10.1016/j.tibs.2007.08.007 - DOI - PMC - PubMed
    1. Sewell AK. Why Must T Cells be Cross-Reactive? Nat Rev Immunol (2012) 12:669–77. doi: 10.1038/nri3279 - DOI - PMC - PubMed
    1. Bassing CH, Swat W, Alt FW. The Mechanism and Regulation of Chromosomal V (D) J Recombination. Cell (2002) 109:S45–55. doi: 10.1016/S0092-8674(02)00675-X - DOI - PubMed
    1. Benichou JI, van Heijst JW, Glanville J, Louzoun Y. Converging Evolution Leads to Near Maximal Junction Diversity Through Parallel Mechanisms in B and T Cell Receptors. Phys Biol (2017) 14:045003. doi: 10.1088/1478-3975/aa7366 - DOI - PubMed

Publication types

LinkOut - more resources