. 2022 Jul 13:13:847106.
doi: 10.3389/fimmu.2022.847106. eCollection 2022.

Differential Impacts of HHV-6A versus HHV-6B Infection in Differentiated Human Neural Stem Cells

Affiliations

Differential Impacts of HHV-6A versus HHV-6B Infection in Differentiated Human Neural Stem Cells

Elham Bahramian et al. Front Immunol. .

Abstract

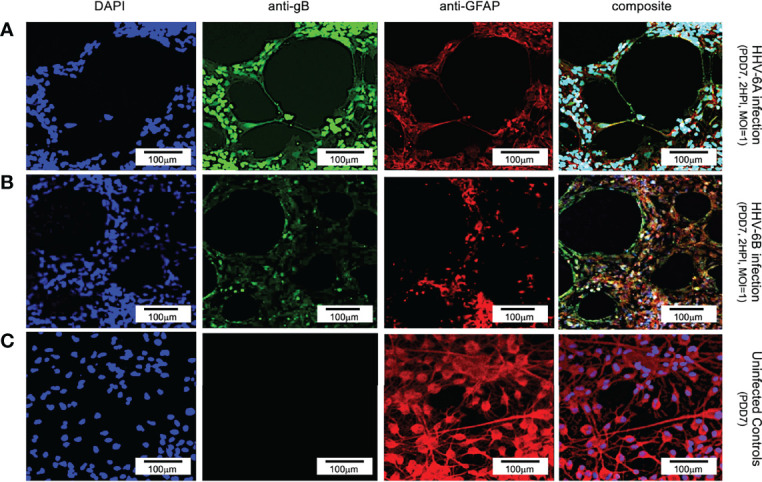
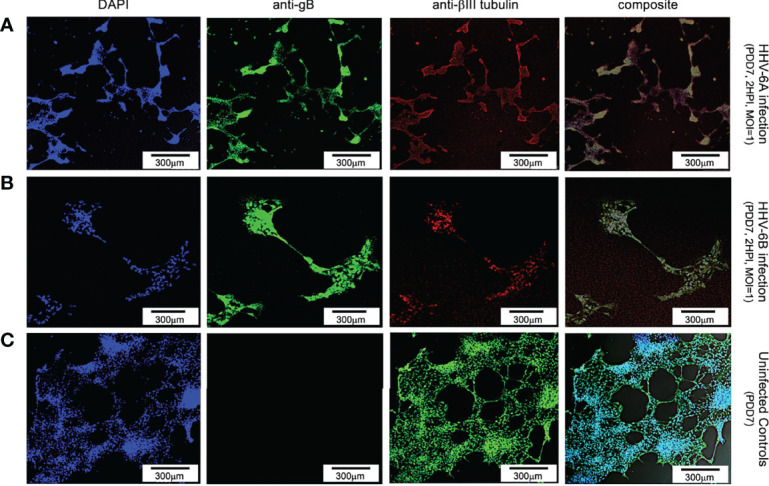
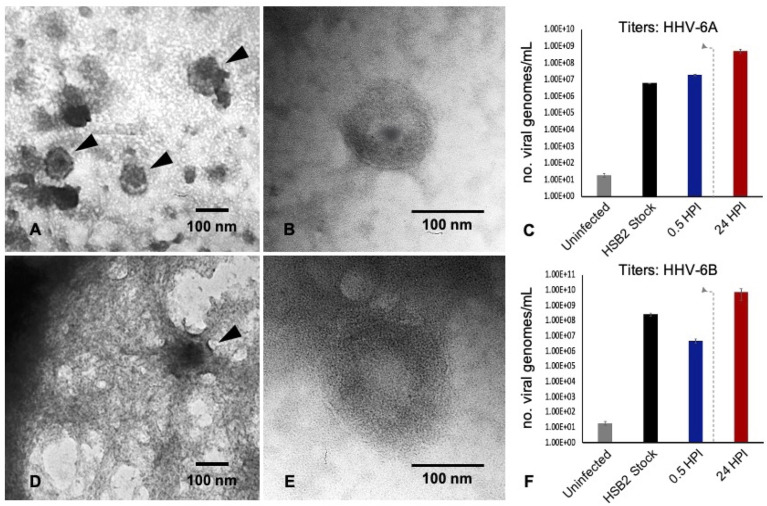
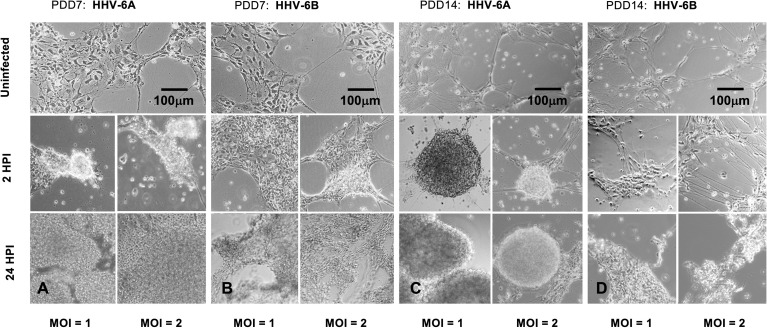
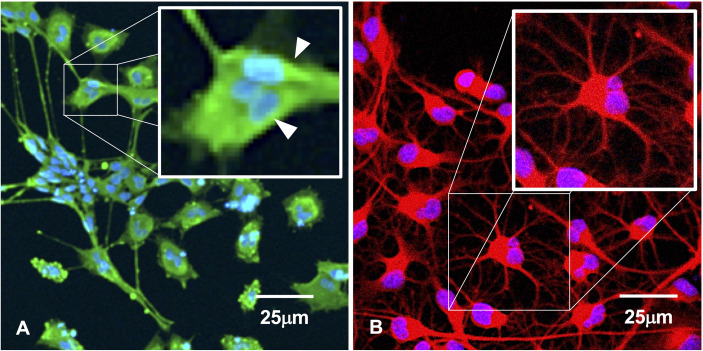
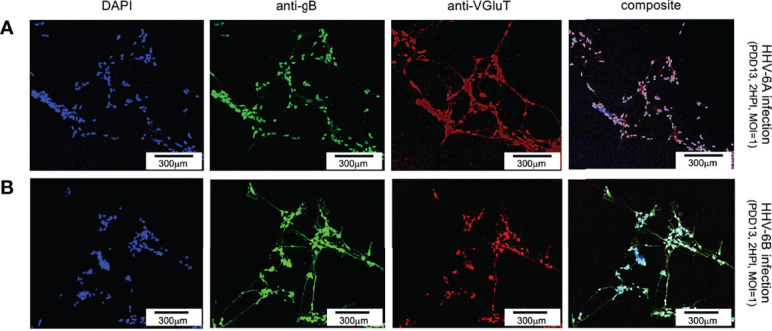
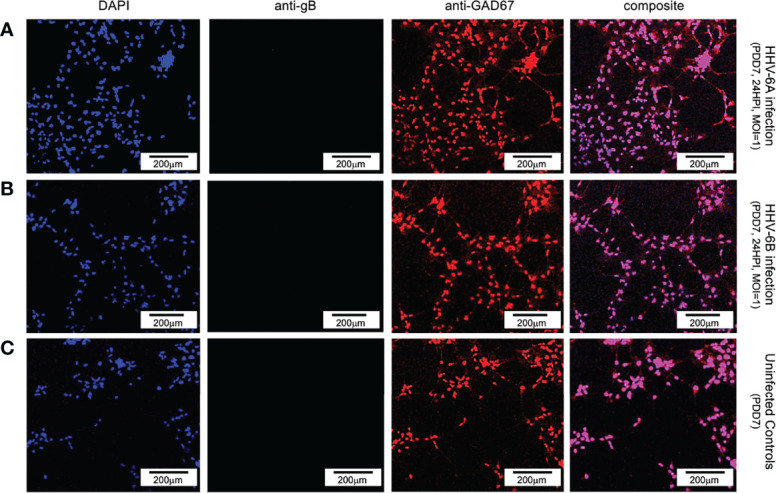
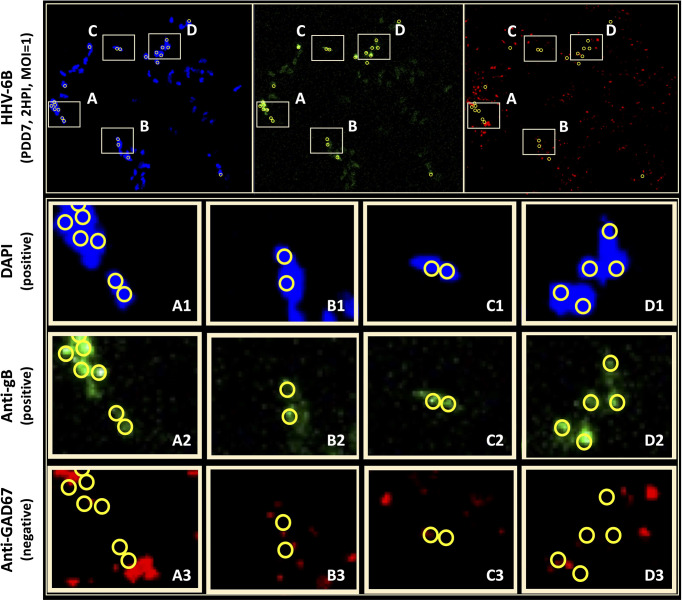
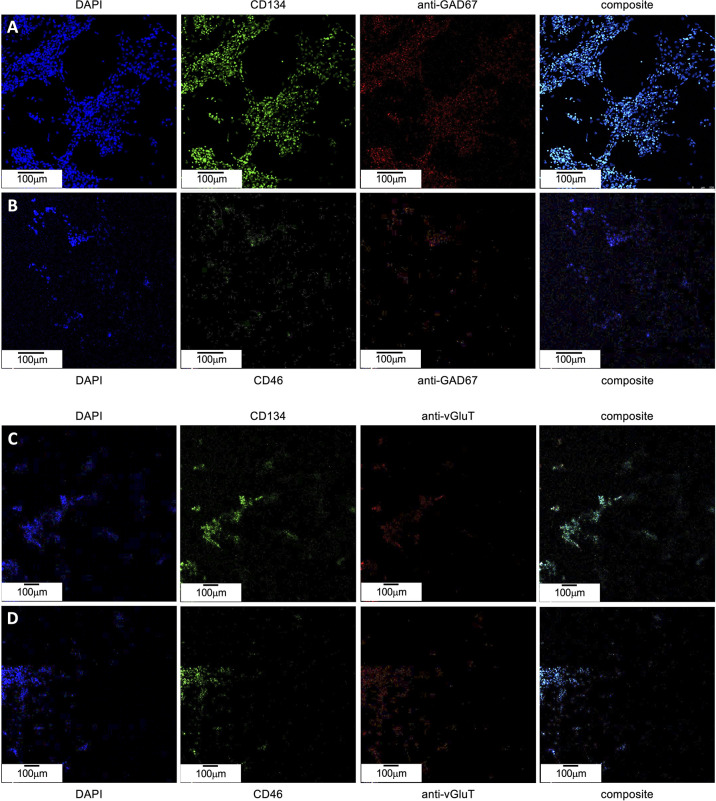
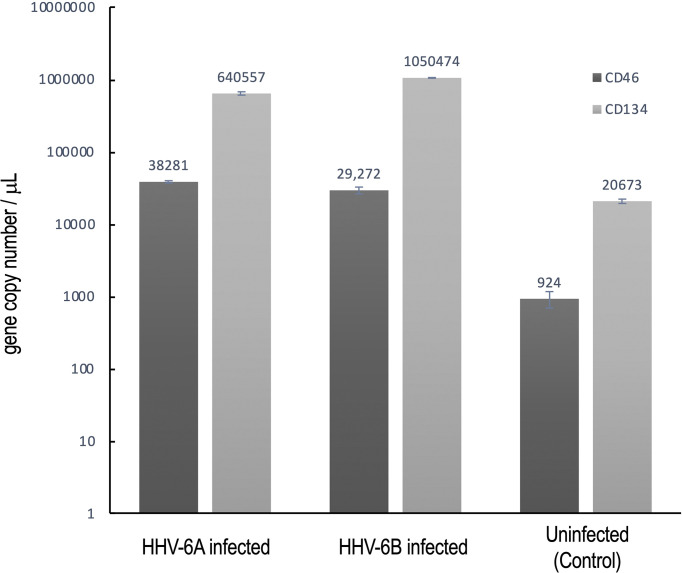
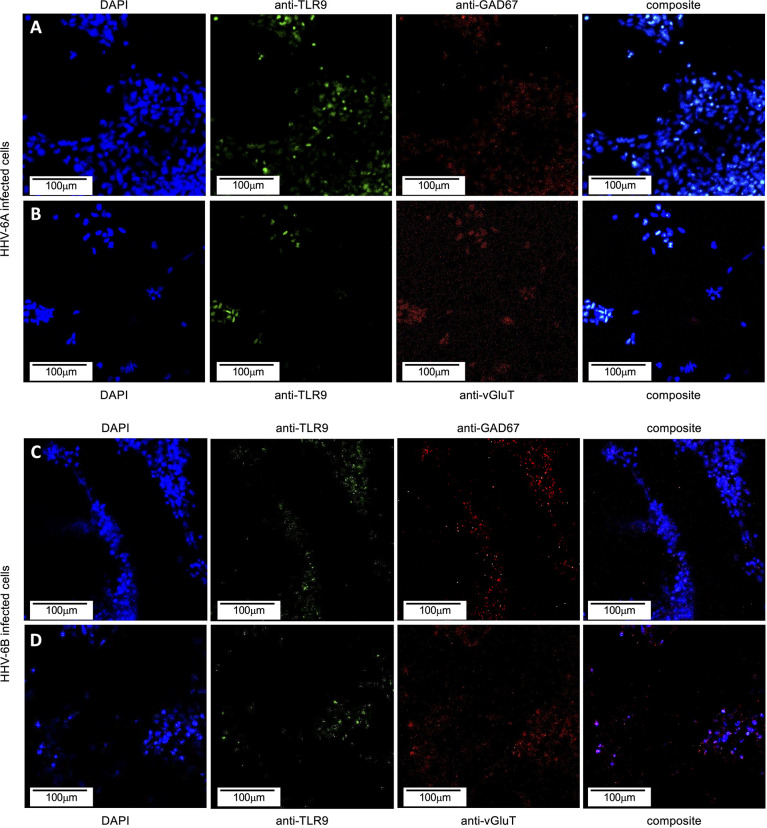
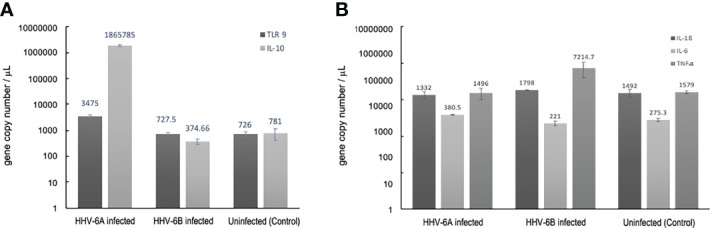
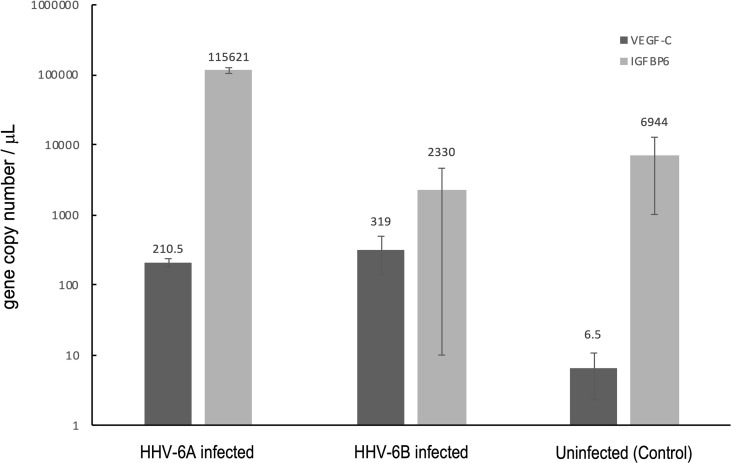
Within the family Herpesviridae, sub-family β-herpesvirinae, and genus Roseolovirus, there are only three human herpesviruses that have been described: HHV-6A, HHV-6B, and HHV-7. Initially, HHV-6A and HHV-6B were considered as two variants of the same virus (i.e., HHV6). Despite high overall genetic sequence identity (~90%), HHV-6A and HHV-6B are now recognized as two distinct viruses. Sequence divergence (e.g., >30%) in key coding regions and significant differences in physiological and biochemical profiles (e.g., use of different receptors for viral entry) underscore the conclusion that HHV-6A and HHV-6B are distinct viruses of the β-herpesvirinae. Despite these viruses being implicated as causative agents in several nervous system disorders (e.g., multiple sclerosis, epilepsy, and chronic fatigue syndrome), the mechanisms of action and relative contributions of each virus to neurological dysfunction are unclear. Unresolved questions regarding differences in cell tropism, receptor use and binding affinity (i.e., CD46 versus CD134), host neuro-immunological responses, and relative virulence between HHV-6A versus HHV-6B prevent a complete characterization. Although it has been shown that both HHV-6A and HHV-6B can infect glia (and, recently, cerebellar Purkinje cells), cell tropism of HHV-6A versus HHV-6B for different nerve cell types remains vague. In this study, we show that both viruses can infect different nerve cell types (i.e., glia versus neurons) and different neurotransmitter phenotypes derived from differentiated human neural stem cells. As demonstrated by immunofluorescence, HHV-6A and HHV-6B productively infect VGluT1-containing cells (i.e., glutamatergic neurons) and dopamine-containing cells (i.e., dopaminergic neurons). However, neither virus appears to infect GAD67-containing cells (i.e., GABAergic neurons). As determined by qPCR, expression of immunological factors (e.g., cytokines) in cells infected with HHV-6A versus HHV6-B also differs. These data along with morphometric and image analyses of infected differentiated neural stem cell cultures indicate that while HHV-6B may have greater opportunity for transmission, HHV-6A induces more severe cytopathic effects (e.g., syncytia) at the same post-infection end points. Cumulatively, results suggest that HHV-6A is more virulent than HHV-6B in susceptible cells, while neither virus productively infects GABAergic cells. Consistency between these in vitro data and in vivo experiments would provide new insights into potential mechanisms for HHV6-induced epileptogenesis.

Keywords: cell tropism; epilepsy; human herpesvirus 6; immunological response; neural stem cells; roseolovirus.


Conflict of interest statement

The authors declare that the research was conducted in the absence of any commercial or financial relationships that could be construed as a potential conflict of interest.

Figures

Figure 1
Figure 1
Fluorescence microscopy images of dHNSC treated with immunofluorescent antibodies and a fluoro-dye at PDD7: Differentiation to glial cells. From left to right, DAPI, anti-gB, anti-GFAP, and composites. PDD7 HNSC infected with HHV-6A (row A) show gB-positive signal on GFAP-positive cells (glial cells). PDD7 HNSC infected with HHV-6B (row B) also show gB-positive signal on GFAP-positive cells. Images for uninfected control culture (row C) show welldeveloped GFAP-positive cells with homogeneous distribution; many exhibit stellate morphotypes. [Scale bar = 100 micron].
Figure 2
Figure 2
Fluorescence microscopy images of dHNSCs treated with immunofluorescent antibodies and a fluoro-dye at PDD7: Differentiation to neurons. From left to right, DAPI, anti-gB, anti-bIII tubulin, and composites. PDD7 dHNSC infected with HHV-6A (row A) show gB-positive signal on bIII tubulin-positive cells. PDD7 HNSC infected with HHV-6B (row B) also show gB-positive signal on bIII tubulinpositive cells. Images for uninfected control culture (row C) show developed bIII tubulin-positive cells with significant neurite-neurite and neurite-soma connectivity. [Scale bar = 300 micron].
Figure 3
Figure 3
TEM and qPCR data from HHV6-infected dHNSC. TEM images illustrate: (A) HHV-6A virus particles within a cell; (B) HHV-6A virions in cell-free filtered supernatant from cell lysate; (D) HHV-6B virions in a cell; (E) HHV-6B virions in cell-free filtered supernatant. qPCR titer methods show productive virus infection for: (C) HHV-6A and (F) HHV-6B. Uninfected cells show negligible amplification of an HHV6-specific marker (i.e., U22 gene). After 30 min post-infection HHV6 is still present. After a wash at 2 HPI (dashed line) and 22 h incubation (24HPI), titers increase indicating production of progeny virions at densities greater than the number of viruses (i.e., viral genomes) present immediately after inoculation. [Scale bar = 100 nanometer].
Figure 4
Figure 4
Light microscopy of HHV6-induced cytopathic effects (CPEs) on dHNSC at PDD 7 and 14. (A) Uninfected cultures of HNSC at PDD7 show healthy cells adhering to the plate surface (top). After two hours post-infection (2HPI) at MOIs = 1, 2 (middle, left and right, respectively) with HHV-6A, cells begin to aggregate and at 24HPI with HHV-6A at MOIs = 1, 2 (bottom, left and right) there is highdensity clumping and cell detachment. (B) Uninfected cultures of HNSC at PDD7 show healthy cells adhering to the plate surface (top). After 2HPI with HHV-6B at MOIs = 1, 2 (middle, left and right), cells begin to aggregate and at 24HPI with HHV-6B at MOI = 1, 2 (bottom, left and right) there is higher-density aggregation. (C) At PDD14, uninfected healthy cells persist (top); however, at 2HPI at MOIs = 1,2 (middle, left and right) infection with HHV-6A results in highdensity cell aggregation and at 24HPI rampant cell death and detachment is observed (bottom, left and right). (D) At PDD14, uninfected cells persist (top); however, HHV-6B infection at MOIs = 1,2 for 2 HPI results in lower-density cell aggregation (middle, left and right) with higher-density clumping occurring at 24HPI (bottom, left and right). [Scale bar = 100 micron].
Figure 5
Figure 5
Immunofluorescence suggests syncytia. (A) HHV-6A infection in HNSC results in syncytia formation as indicated by cell membrane fusion and multi-nucleated cells (arrows). (B) Uninfected culture shows individual well-bounded dHNSC membranes and the absence of any cell aggregation that would suggest syncytia-like formations. [Scale bar = 25 micron].
Figure 6
Figure 6
Fluorescence microscopy images of dHNSC treated with immunofluorescent antibodies and a fluoro-dye at PDD13: Glutamatergic neurons. VGluT1- positive dHNSC at PDD13 (2 HPI, MOI=1) shown (left to right) by DAPI staining, anti-gB, and anti-VGluT immunofluorescence (with composites) indicate that gB (green) colocalizes with VGluT1 (red) in DAPI stained (blue) cells for both HHV-6A (row A) and HHV-6B (row B) infected cultures, suggesting susceptibility of glutamatergic neurons to both viruses. (Results were consistent across 6 replicate trials). [Scale bar = 300 micron].
Figure 7
Figure 7
Fluorescence microscopy images of dHNSC treated with immunofluorescent antibodies and fluoro-dye (DAPI) at PDD7: Dopaminergic neurons. DA-positive dHNSC at PDD7 (2HPI, MOI = 1) shown (left to right) by DAPI staining and antigB and anti-DA immunofluorescence (with composites) indicate that gB (green) colocalizes with dopamine (red) in DAPI stained (blue) cells for both HHV-6A (row A) and HHV-6B (row B) infected cultures, suggesting susceptibility of dopaminergic neurons to both viruses (Results were consistent across 6 replicate trials). [Scale bar = 300 micron].
Figure 8
Figure 8
Fluorescence microscopy images of dHNSC treated with immunofluorescent antibodies and a fluoro-dye (DAPI) at PDD7: GABAergic neurons. GAD67- positive dHNSCs at PDD7 (2HPI, MOI=1) shown (left to right) by DAPI dye and anti-GAD67 immunofluorescence (with composites) indicate that gB (green) immunofluorescence does not colocalize with GAD67 (red) in DAPI stained (blue) cells for both HHV-6A (row A) and HHV-6B (row B) infected cultures, suggesting GABAergic neurons are not susceptible to either virus. No gB signal (green) is detected in uninfected controls (row C). (Results were consistent across 6 replicates). [Scale bar = 200 micron].
Figure 9
Figure 9
Anti-gB/DAPI fluorescence does not colocalize with GAD67-positive cells in mixed cultures. DAPI microscopy images of immunofluorescence and fluorescence staining of dHNSC at PDD7, MOI = 1, 2HPI challenged with HHV-6B. Out of multiple trials, only one anti-GAD67 positive culture displayed an anti-gB fluorescence signal indicating possible infection of GABA-containing neurons (top). However, upon closer examination of anti-gB cell clusters (regions A-D), it appears that DAPI positive cells (rows A1-D1) and anti-gB positive (rows A2-D2) cells are anti-GAD67 negative (row A3-D3) providing further evidence for GABAergic neuron resistance to HHV-6 infection. DAPI/anti-gB positive fluorescence is likely from adjacent glial cells or other neuronal neurotransmitter phenotypes in the mixed culture.
Figure 10
Figure 10
CD46 and CD134 colocalize with GAD67-positive and VGluT-positive differentiated H9 stem cells. (A) GAD67-positive (red, mid-right) dHNSCs at PDD7 stained with DAPI (blue, left) exhibit a coincident anti-CD134 immunofluorescence signal (green, mid-left). (B) GAD67-positive (red, mid-right) dHNSCs at PDD7 stained with DAPI (blue, left) also show colocalized anti-CD46 (green, mid-left). Thus, GAD-67-positive cells appear to express both CD134 and CD46 (composites, right). (C) VGluT-positive (red, mid-right) dHNSCs at PDD7 stained with DAPI (blue, left) also show colocalization of anti-CD134 immunofluorescence signal (green, mid-left). (D) VGluT-positive (red, mid-right) dHNSCs at PDD7 stained with (blue, left) show anti-CD46 immunofluorescence (green, mid-left). This indicates VGluT-positive cells also express CD134 and CD46 (composites, right). [Scale bar = 100 micron].
Figure 11
Figure 11
CD134 and CD46 gene expression in HHV6 infected cells. Using RT-qPCR CD134 and CD46 mRNA expression was determined for dHNSC (i.e., H9 cells) after infection with either HHV-6A or HHV-6B and compared to uninfected controls. After 2 hr post-infection, CD134 (light grey) and CD46 (dark grey) mRNA levels were elevated when compared to uninfected control cultures (far right); (N=6, p=0.0002). CD134 expression levels are greater than CD46 in HHV-6A and HHV-6B infected cultures; (N=6, p=0.0013). CD134 expression is also greater in uninfected cells. These data indicate that cells express CD134 at higher levels and that infection results in overexpression of both CD46 and CD134.
Figure 12
Figure 12
TLR9 in HHV6 infected excitatory (VGluT-positive) and inhibitory (GAD67-positive) cells. Immunofluorescence assays indicate that both HHV-6A and HHV-6B infected dHNSCs express TLR9. (A) DAPI stained cells (blue, left) emitting GAD67-positive immunofluorescence signals (red, mid-right) also show signal for anti-TLR9 fluoroprobes (green, mid-left) during HHV-6A infection. (B) HHV-6A infected VGluT-positive neurons (red, mid-right) stained with DAPI (blue, left) also show coincident TLR9 immunofluorescence (green, mid-right). (C) DAPI stained cells (blue, left) emitting GAD67-positive immunofluorescence signals (red, mid-right) also show signal for anti-TLR9 fluoroprobes (green, mid-left) during HHV-6B infection. (D) HHV-6B infected VGluT-positive cells (red, mid-right) stained with DAPI (blue, left) also show coincident TLR9 fluorescence (green, mid-right). [Infections in A-D were performed seven days post-differentiation day (PDD7). [Scale bar = 100 micron].
Figure 13
Figure 13
Cellular cytokine responses to HHV6 infection in dHNSCs via RT-qPCR. (A) TLR9 gene expression levels (i.e., mRNA) are elevate in HHV-6A infected cultures;(N=3, p=0.0150) while no significant increase in TLR9 gene expression in HHV-6B infected dHNSCs when compared to uninfected controls (dark grey). Likewise, a significant increase in IL-10 is observed in HHV-6A infected cultures;(N=3, p=0.0029), while no significant increase in IL-10 gene expression is observed in HHV-6B infected dHNSCs (light grey). (B) Gene expression levels of IL-6 are slightly elevated in HHV-6 infected cultures (light grey), while no significant difference in IL-6 expression in HHV-6B infected dHNSCs is observed as compared to uninfected controls. TNFα expression is elevated in HHV-6B infected dHNSCs. No significant difference is observed in HHV-6A infected cells when compared to uninfected controls (medium grey). No change in IL-1β is noted for either HHV-6A or HHV-6B infected cells (dark grey).
Figure 14
Figure 14
Growth factor responses to HHV6 infection in dHNSCs via RT-qPCR. Expression levels of vascular endothelial growth factor C (VEGF-C) and insulin-like growth factor binding protein 6 (IGFBP6) were measured via RT-qPCR during infection with HHV-6A and HHV-6B. Both HHV-6A(N=3, p=0.0009) and HHV-6B (N=3, p=0.0022) infected dHNSCs show elevated expression of VEGF-C compared to uninfected controls (dark grey); (N=3, p=0.0000). HHV-6A infection of dHNSCs also results in increased expression of IGFBP6; (N=3, p=0.0064) while HHV-6B infection does not (light grey).

Similar articles

Cited by

References

    1. Adams MJ, Carstens E. "Ratification Vote on Taxonomic Proposals to the International Committee on Taxonomy of Viruses, (2012).". Arch Vinrol (2012) 157(7):1411–22. doi: 10.1007/s00705-012-1299-6 - DOI - PMC - PubMed
    1. Isegawa Y, Mukai T, Nakano K, Kagawa M, Chen J, Mori Y, et al. "Comparison of the Complete DNA Sequences of Human Herpesvirus 6 Variants A and B.". J Virol (1999) 73(10):8053–63. doi: 10.1128/JVI.73.10.8053-8063.1999 - DOI - PMC - PubMed
    1. Dominguez G, Dambaugh TR, Stamey FR, Dewhurst S, Inoue N, Pellett PE. "Human Herpesvirus 6B Genome Sequence: Coding Content and Comparison With Human Herpesvirus 6A.". J Virol (1999) 73(10):8040–52. doi: 10.1128/JVI.73.10.8040-8052.1999 - DOI - PMC - PubMed
    1. Rapp JC, Krug LT, Inoue N, Dambaugh TR, Pellett PE. "U94, the Human Herpesvirus 6 Homolog of the Parvovirus Nonstructural Gene, is Highly Conserved Among Isolates and is Expressed at Low mRNA Levels as a Spliced Transcript.". Virology (2000) 268(2):504–16. doi: 10.1006/viro.1999.0163 - DOI - PubMed
    1. Achour A, Malet I, Le Gal F, Dehée A, Gautheret-Dejean A, Bonnafous P, et al. "Variability of gB and gH Genes of Human Herpesvirus-6 Among Clinical Specimens.". J Med Virol (2008) 80(7):1211–21. doi: 10.1002/jmv.21205 - DOI - PubMed

Publication types