

Lactate Metabolism-Associated lncRNA Pairs: A Prognostic Signature to Reveal the Immunological Landscape and Mediate Therapeutic Response in Patients With Colon Adenocarcinoma
- PMID: 35911752
- PMCID: PMC9328180
- DOI: 10.3389/fimmu.2022.881359
Lactate Metabolism-Associated lncRNA Pairs: A Prognostic Signature to Reveal the Immunological Landscape and Mediate Therapeutic Response in Patients With Colon Adenocarcinoma
Abstract
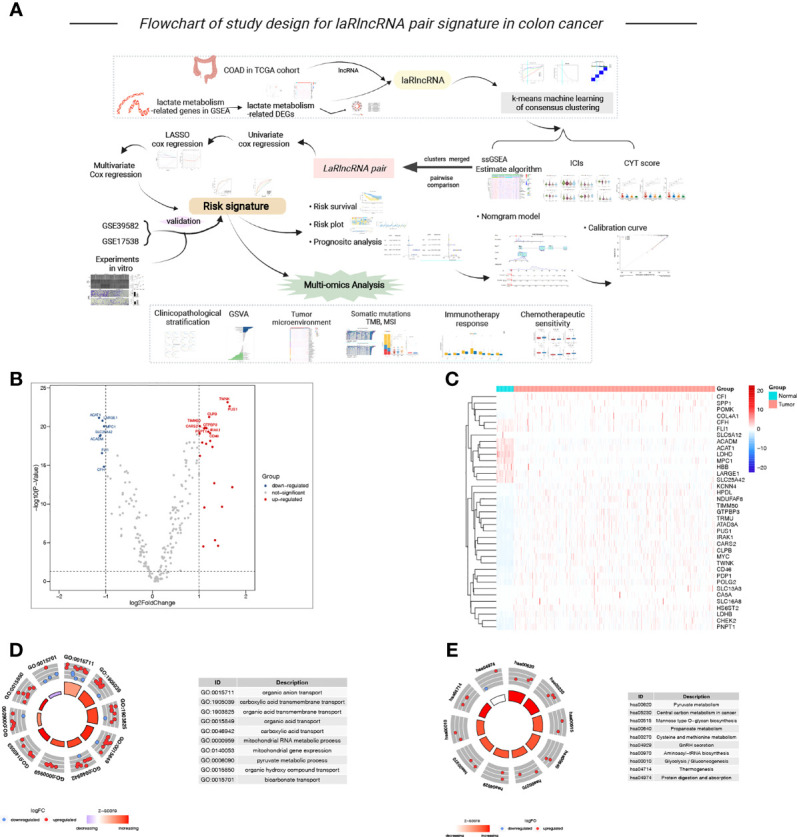
Background: Lactate metabolism is critically involved in the tumor microenvironment (TME), as well as cancer progression. It is important to note, however, that lactate metabolism-related long non-coding RNAs (laRlncRNAs) remain incredibly understudied in colon adenocarcinoma (COAD).
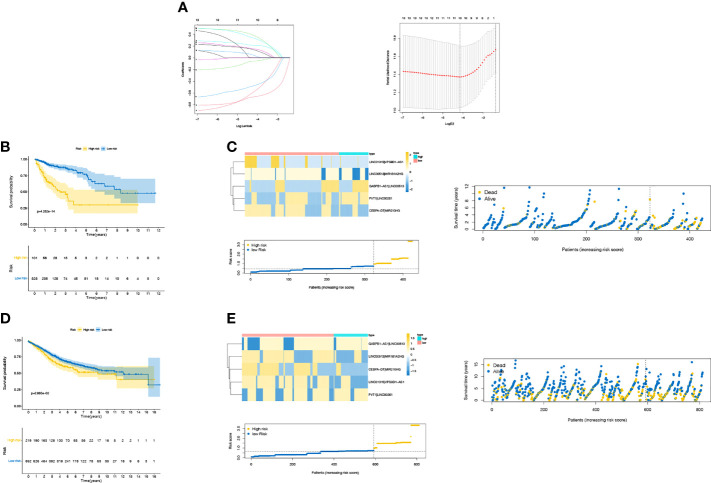
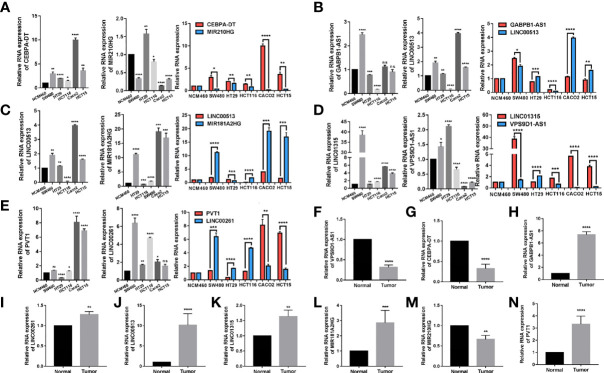
Methods: A gene expression profile was obtained from the Cancer Genome Atlas (TCGA) database to identify laRlncRNA expression in COAD patients. A risk signature with prognostic value was identified from TCGA and Gene Expression Omnibus (GEO) cohort based on laRlncRNA pairs by the least absolute shrinkage and selection operator (LASSO) and Cox regression analyses. Quantitative real-time polymerase chain reaction (qRT-PCR) and functional experiments were carried out to verify the expression of laRlncRNAs in COAD. The relationship of laRlncRNA pairs with immune landscape as well as the sensitivity of different therapies was explored.
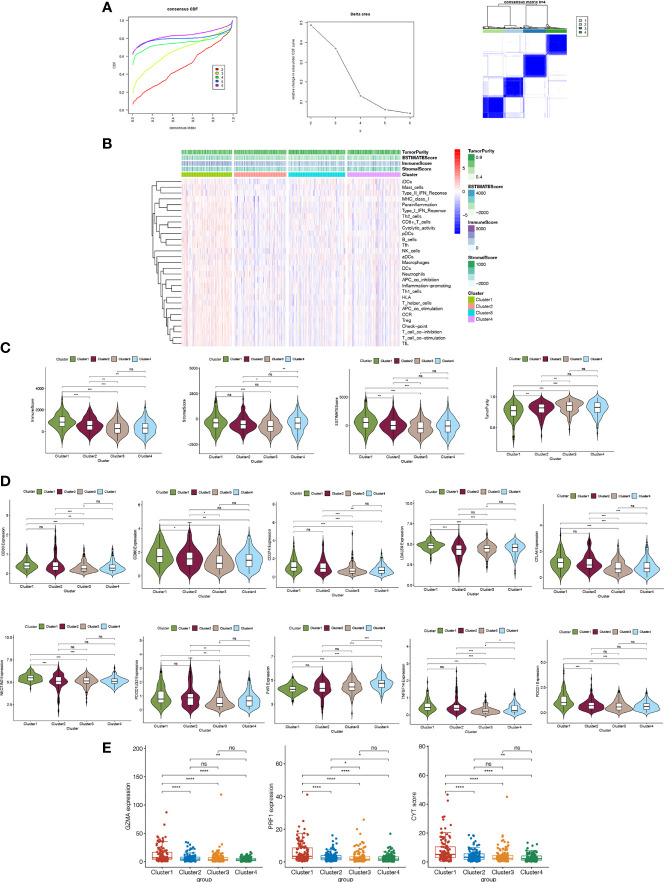
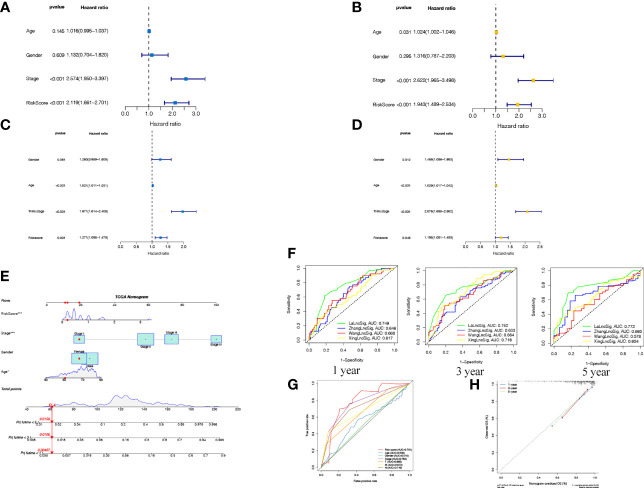
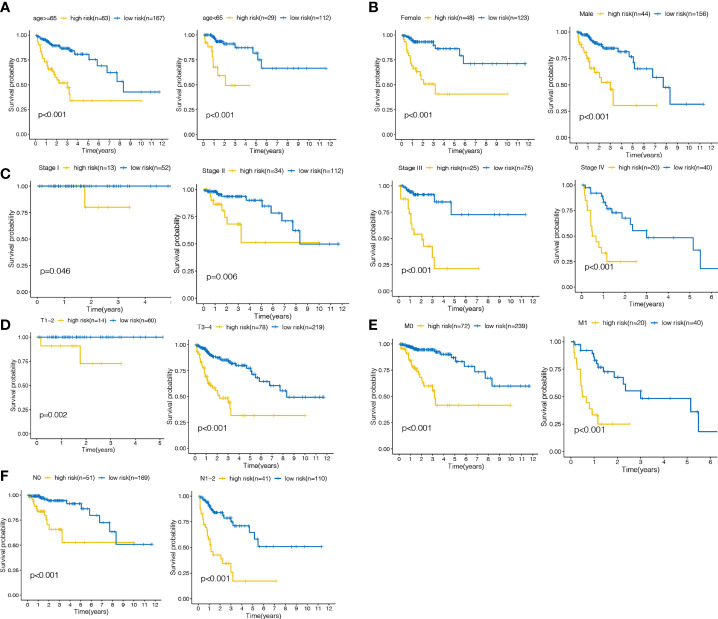
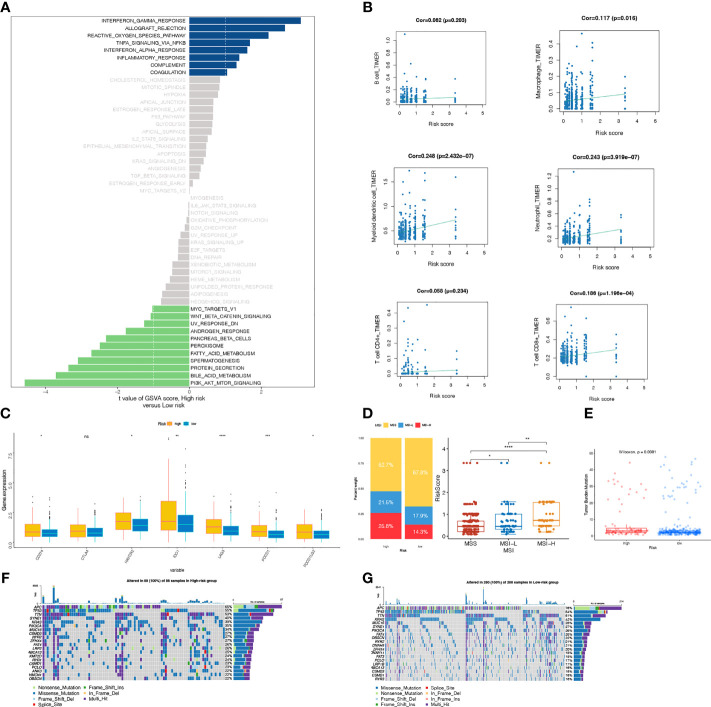
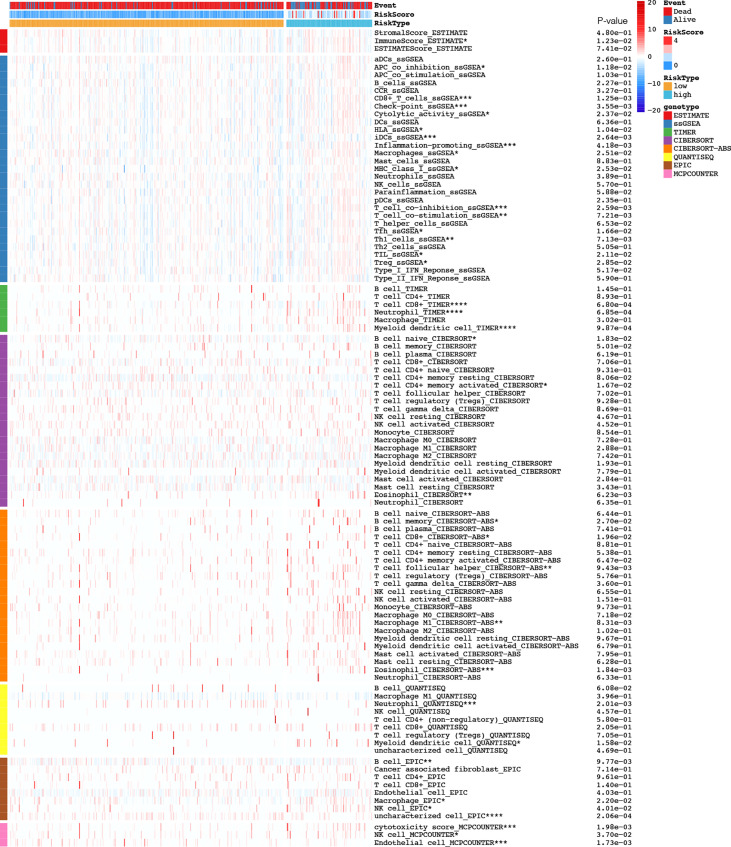
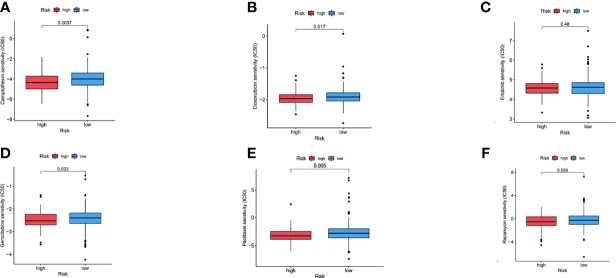
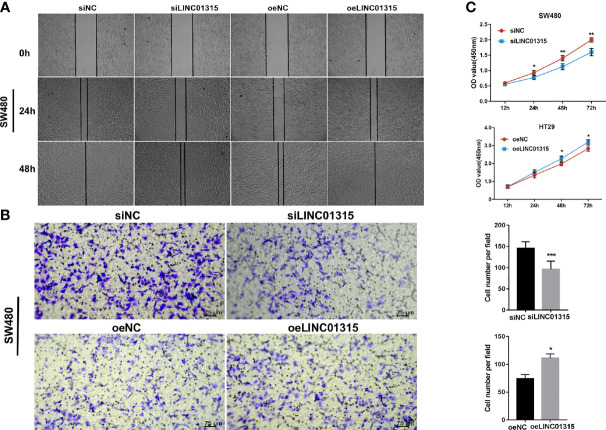
Results: In total, 2378 laRlncRNAs were identified, 1,120 pairs of which were studied to determine their prognostic validity, followed by a risk signature established based on the screened 5 laRlncRNA pairs. The laRlncRNA pairs-based signature provided a better overall survival (OS) prediction than other published signatures and functioned as a prognostic marker for COAD patients. According to the calculated optimal cut-off point, patients were divided into high- and low-risk groups. The OS of COAD patients in the high-risk group were significantly shorter than that of those in the low-risk group (P=4.252e-14 in the TCGA cohort and P=2.865-02 in the GEO cohort). Furthermore, it remained an effective predictor of survival in strata of gender, age, TNM stage, and its significance persisted after univariate and multivariate Cox regressions. Additionally, the risk signature was significantly correlated with immune cells infiltration, tumor mutation burden (TMB), microsatellite instability (MSI) as well as immunotherapeutic efficacy and chemotherapy sensitivity. Finally, one of the laRlncRNA, LINC01315, promotes proliferation and migration capacities of colon cancer cells.
Conclusion: The newly identified laRlncRNAs pairs-based signature exhibits potential effects in predicting prognosis, deciphering patients' immune landscape, and mediating sensitivity to immunotherapy and chemotherapy. Findings in our study may provide evidence for the role of laRlncRNAs pairs as novel prognostic biomarkers and potentially individualized therapy targets for COAD patients.
Keywords: colon adenocarcinoma; lactate metabolism-related lncRNAs; prognosis; therapy response; tumor immune cell infiltration.
Copyright © 2022 Xiao, Wang, Liu, Liu, Yi and Hu.
Conflict of interest statement
The authors declare that the research was conducted in the absence of any commercial or financial relationships that could be construed as a potential conflict of interest.
Figures
Similar articles
-
Developing a RiskScore Model based on Angiogenesis-related lncRNAs for Colon Adenocarcinoma Prognostic Prediction.Curr Med Chem. 2024;31(17):2449-2466. doi: 10.2174/0109298673277243231108071620. Curr Med Chem. 2024. PMID: 37961859
-
Identification of a PANoptosis-related long noncoding rna risk signature for prognosis and immunology in colon adenocarcinoma.BMC Cancer. 2025 Apr 10;25(1):662. doi: 10.1186/s12885-025-14021-2. BMC Cancer. 2025. PMID: 40211224 Free PMC article.
-
Crosstalk of lactate metabolism-related subtypes, establishment of a prognostic signature and immune infiltration characteristics in colon adenocarcinoma.Sci Rep. 2025 Apr 26;15(1):14599. doi: 10.1038/s41598-025-98735-0. Sci Rep. 2025. PMID: 40287503 Free PMC article.
-
Exploring and validating the necroptotic gene regulation and related lncRNA mechanisms in colon adenocarcinoma based on multi-dimensional data.Sci Rep. 2024 Sep 27;14(1):22251. doi: 10.1038/s41598-024-73168-3. Sci Rep. 2024. PMID: 39333335 Free PMC article.
-
Construction of a novel choline metabolism-related signature to predict prognosis, immune landscape, and chemotherapy response in colon adenocarcinoma.Front Immunol. 2022 Nov 14;13:1038927. doi: 10.3389/fimmu.2022.1038927. eCollection 2022. Front Immunol. 2022. PMID: 36451813 Free PMC article.
Cited by
-
Developing a RiskScore Model based on Angiogenesis-related lncRNAs for Colon Adenocarcinoma Prognostic Prediction.Curr Med Chem. 2024;31(17):2449-2466. doi: 10.2174/0109298673277243231108071620. Curr Med Chem. 2024. PMID: 37961859
-
Glycolysis-associated lncRNAs in cancer energy metabolism and immune microenvironment: a magic key.Front Immunol. 2024 Sep 13;15:1456636. doi: 10.3389/fimmu.2024.1456636. eCollection 2024. Front Immunol. 2024. PMID: 39346921 Free PMC article. Review.
-
Identification and validation of a prognostic risk-scoring model based on sphingolipid metabolism-associated cluster in colon adenocarcinoma.Front Endocrinol (Lausanne). 2022 Nov 28;13:1045167. doi: 10.3389/fendo.2022.1045167. eCollection 2022. Front Endocrinol (Lausanne). 2022. PMID: 36518255 Free PMC article.
-
Identification of a lactate metabolism-related lncRNAs signature for predicting the prognosis in patients with kidney renal clear cell carcinoma.Transl Androl Urol. 2024 Apr 30;13(4):509-525. doi: 10.21037/tau-23-483. Epub 2024 Apr 18. Transl Androl Urol. 2024. PMID: 38721281 Free PMC article.
-
Lactate-related lncRNAs assessment model predicts the prognosis of pancreatic ductal adenocarcinoma.Sci Rep. 2025 Jul 1;15(1):21226. doi: 10.1038/s41598-025-05486-z. Sci Rep. 2025. PMID: 40594525 Free PMC article.
References
Publication types
MeSH terms
Substances
LinkOut - more resources
Full Text Sources